- Essentials
- Getting Started
- Datadog
- Datadog Site
- DevSecOps
- Serverless for AWS Lambda
- Agent
- Integrations
- Containers
- Dashboards
- Monitors
- Logs
- APM Tracing
- Profiler
- Tags
- API
- Service Catalog
- Session Replay
- Continuous Testing
- Synthetic Monitoring
- Incident Management
- Database Monitoring
- Cloud Security Management
- Cloud SIEM
- Application Security Management
- Workflow Automation
- CI Visibility
- Test Visibility
- Test Impact Analysis
- Code Analysis
- Learning Center
- Support
- Glossary
- Standard Attributes
- Guides
- Agent
- Integrations
- OpenTelemetry
- Developers
- Authorization
- DogStatsD
- Custom Checks
- Integrations
- Create an Agent-based Integration
- Create an API Integration
- Create a Log Pipeline
- Integration Assets Reference
- Build a Marketplace Offering
- Create a Tile
- Create an Integration Dashboard
- Create a Recommended Monitor
- Create a Cloud SIEM Detection Rule
- OAuth for Integrations
- Install Agent Integration Developer Tool
- Service Checks
- IDE Plugins
- Community
- Guides
- API
- Datadog Mobile App
- CoScreen
- Cloudcraft
- In The App
- Dashboards
- Notebooks
- DDSQL Editor
- Sheets
- Monitors and Alerting
- Infrastructure
- Metrics
- Watchdog
- Bits AI
- Service Catalog
- API Catalog
- Error Tracking
- Service Management
- Infrastructure
- Application Performance
- APM
- Continuous Profiler
- Database Monitoring
- Data Streams Monitoring
- Data Jobs Monitoring
- Digital Experience
- Real User Monitoring
- Product Analytics
- Synthetic Testing and Monitoring
- Continuous Testing
- Software Delivery
- CI Visibility
- CD Visibility
- Test Optimization
- Code Analysis
- Quality Gates
- DORA Metrics
- Security
- Security Overview
- Cloud SIEM
- Cloud Security Management
- Application Security Management
- AI Observability
- Log Management
- Observability Pipelines
- Log Management
- Administration
Datadog Mobile App
The Datadog Mobile app enables you to view alerts from Datadog on your mobile device. When receiving an alert via Slack, e-mail, Pagerduty or other pager apps, you’ll be able to investigate issues by opening monitor graphs and dashboards on your mobile device.
Installing
Download the app from the Apple App Store for your iOS device, or from the Google Play store for your Android device.
Logging in
You can log in using standard authentication, Google authentication, or SAML - for both the US and the EU region.
Enabling SAML
SAML login requires you to set up and authenticate your SAML provider with Datadog. For SAML IdP-initiated login, refer to the end of this section. To authenticate SAML:
- In the mobile app, select your data center region (for example, US1) in the upper right corner.
- Press the log-in button.
- Click the “Using Single Sign-On (SAML)?” link.
- Enter your company email and send the email.
- While on your mobile device, open the email and click on the indicated link.
- Enter your org’s SAML credentials to be rerouted to an authenticated session of the Datadog mobile app.
Optionally, you may also authenticate through a QR Code or manual entry, outlined below.
QR code
- In a browser, navigate to your Datadog account Personal Settings Organizations page and click Log in to Mobile App for the organization you are currently logged into. This pops up a QR code.
- Use your default phone camera app to scan the QR code and then tap the suggested link to open the Datadog App. You will be automatically logged in.
Note: If you click the Log in to Mobile App button of an organization you are not currently logged into, the org UUID is automatically inserted into the login screen. You still have to provide authentication using your standard method.
Manual entry
- To manually enter the SAML ID, open the Datadog Mobile app and press the “Using Single Sign-On (SAML)?” button.
- Press the “Use another method to login” button, and enter the SAML ID manually.
By clicking Authorize when logging in, you link the mobile device you’re using to your account. For security purposes, you will have to go through this flow once per month.
SAML IdP initiated login
If you keep getting errors while trying to login with SAML, your identity provider may enforce IdP-initiated login. For more information regarding enabling IdP initiated SAML, please see our IdP initiated SAML page IdP Initiated SAML page
Monitors
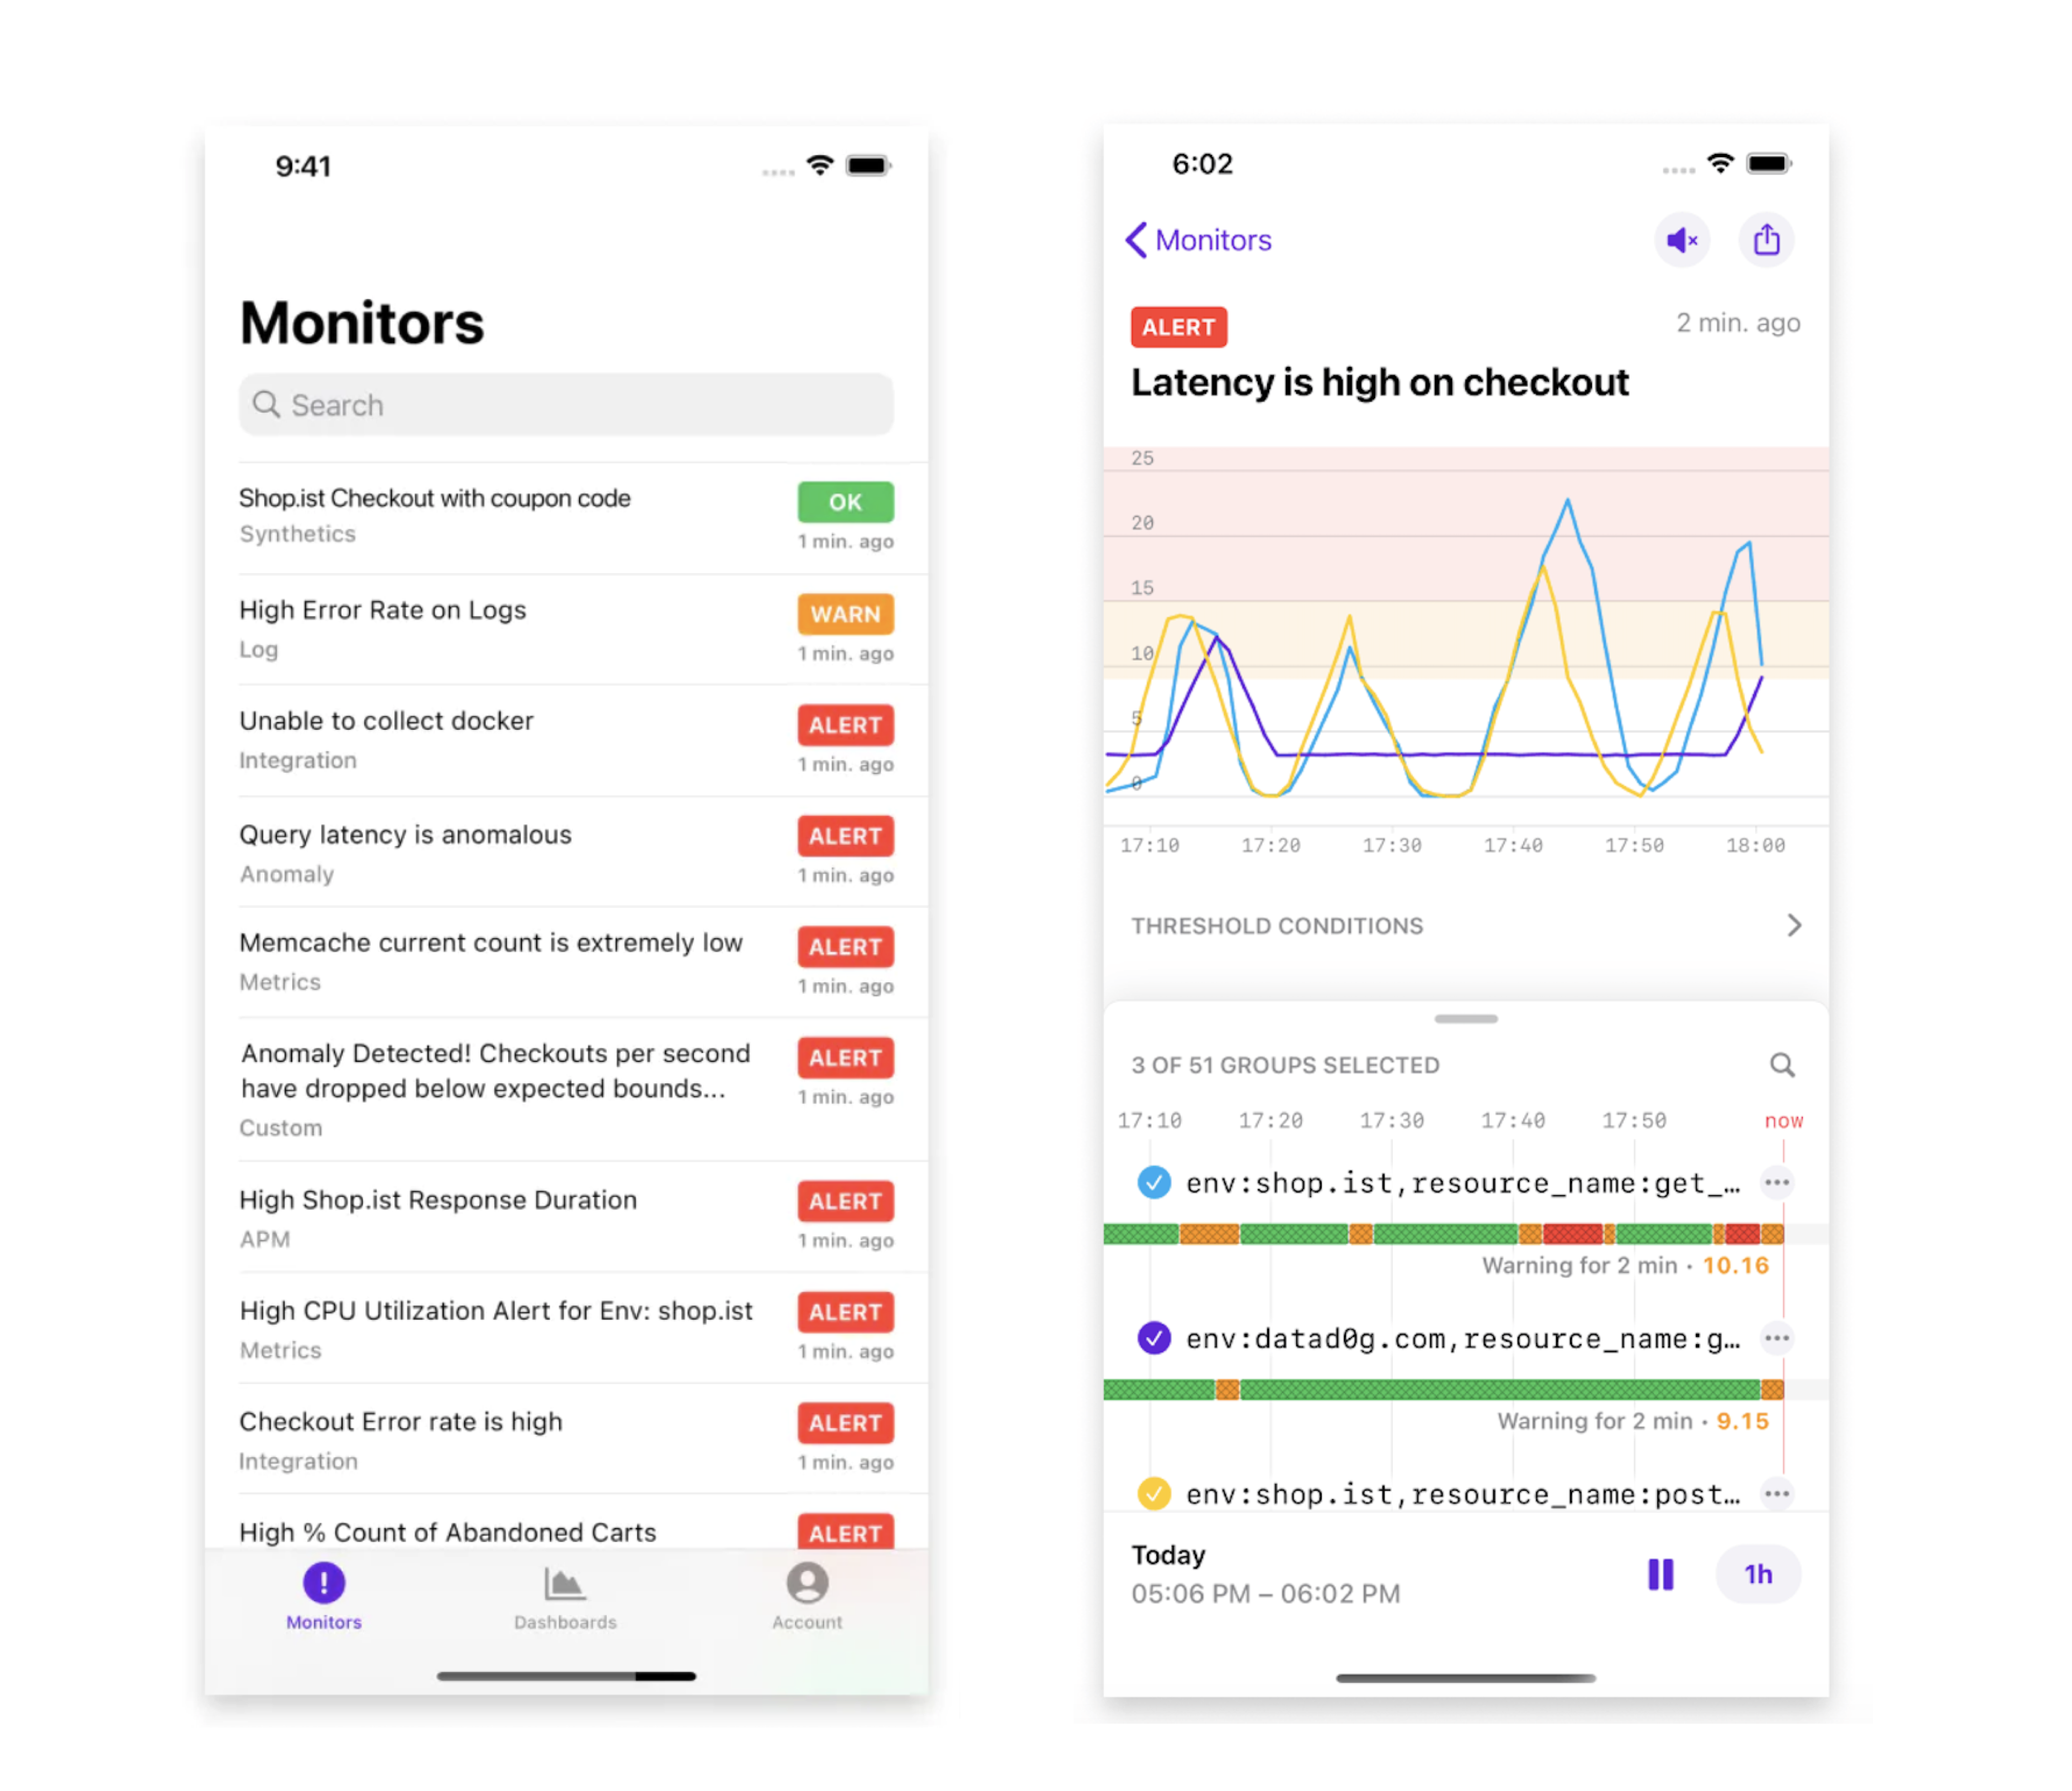
On the Monitors page, you can view and search all of the monitors that you have access to in your Datadog org. You can specify by field name and build-specific search queries based on your tagging strategy. For more information about search, see the Manage Monitors Search section.
For example, to filter on metric monitors related to the SRE team that is being alerted, use the query "status:Alert type:Metric team:sre". Click into individual alerts to see details, which can be filtered by type and by alert time. You can also mute the alert. Your ten most recent searches are saved so that you have faster access previous queries. Furthermore, you can filter your monitor list using saved views, which surface when you activate the search bar. Lastly, view and run synthetic tests when viewing your synthetic monitors.
Note: To set up or edit monitors, notifications, or saved views, you need to do it in the Datadog web app. All monitors set up in the web app are visible in the mobile app. For more information, see Creating monitors.
Dashboards
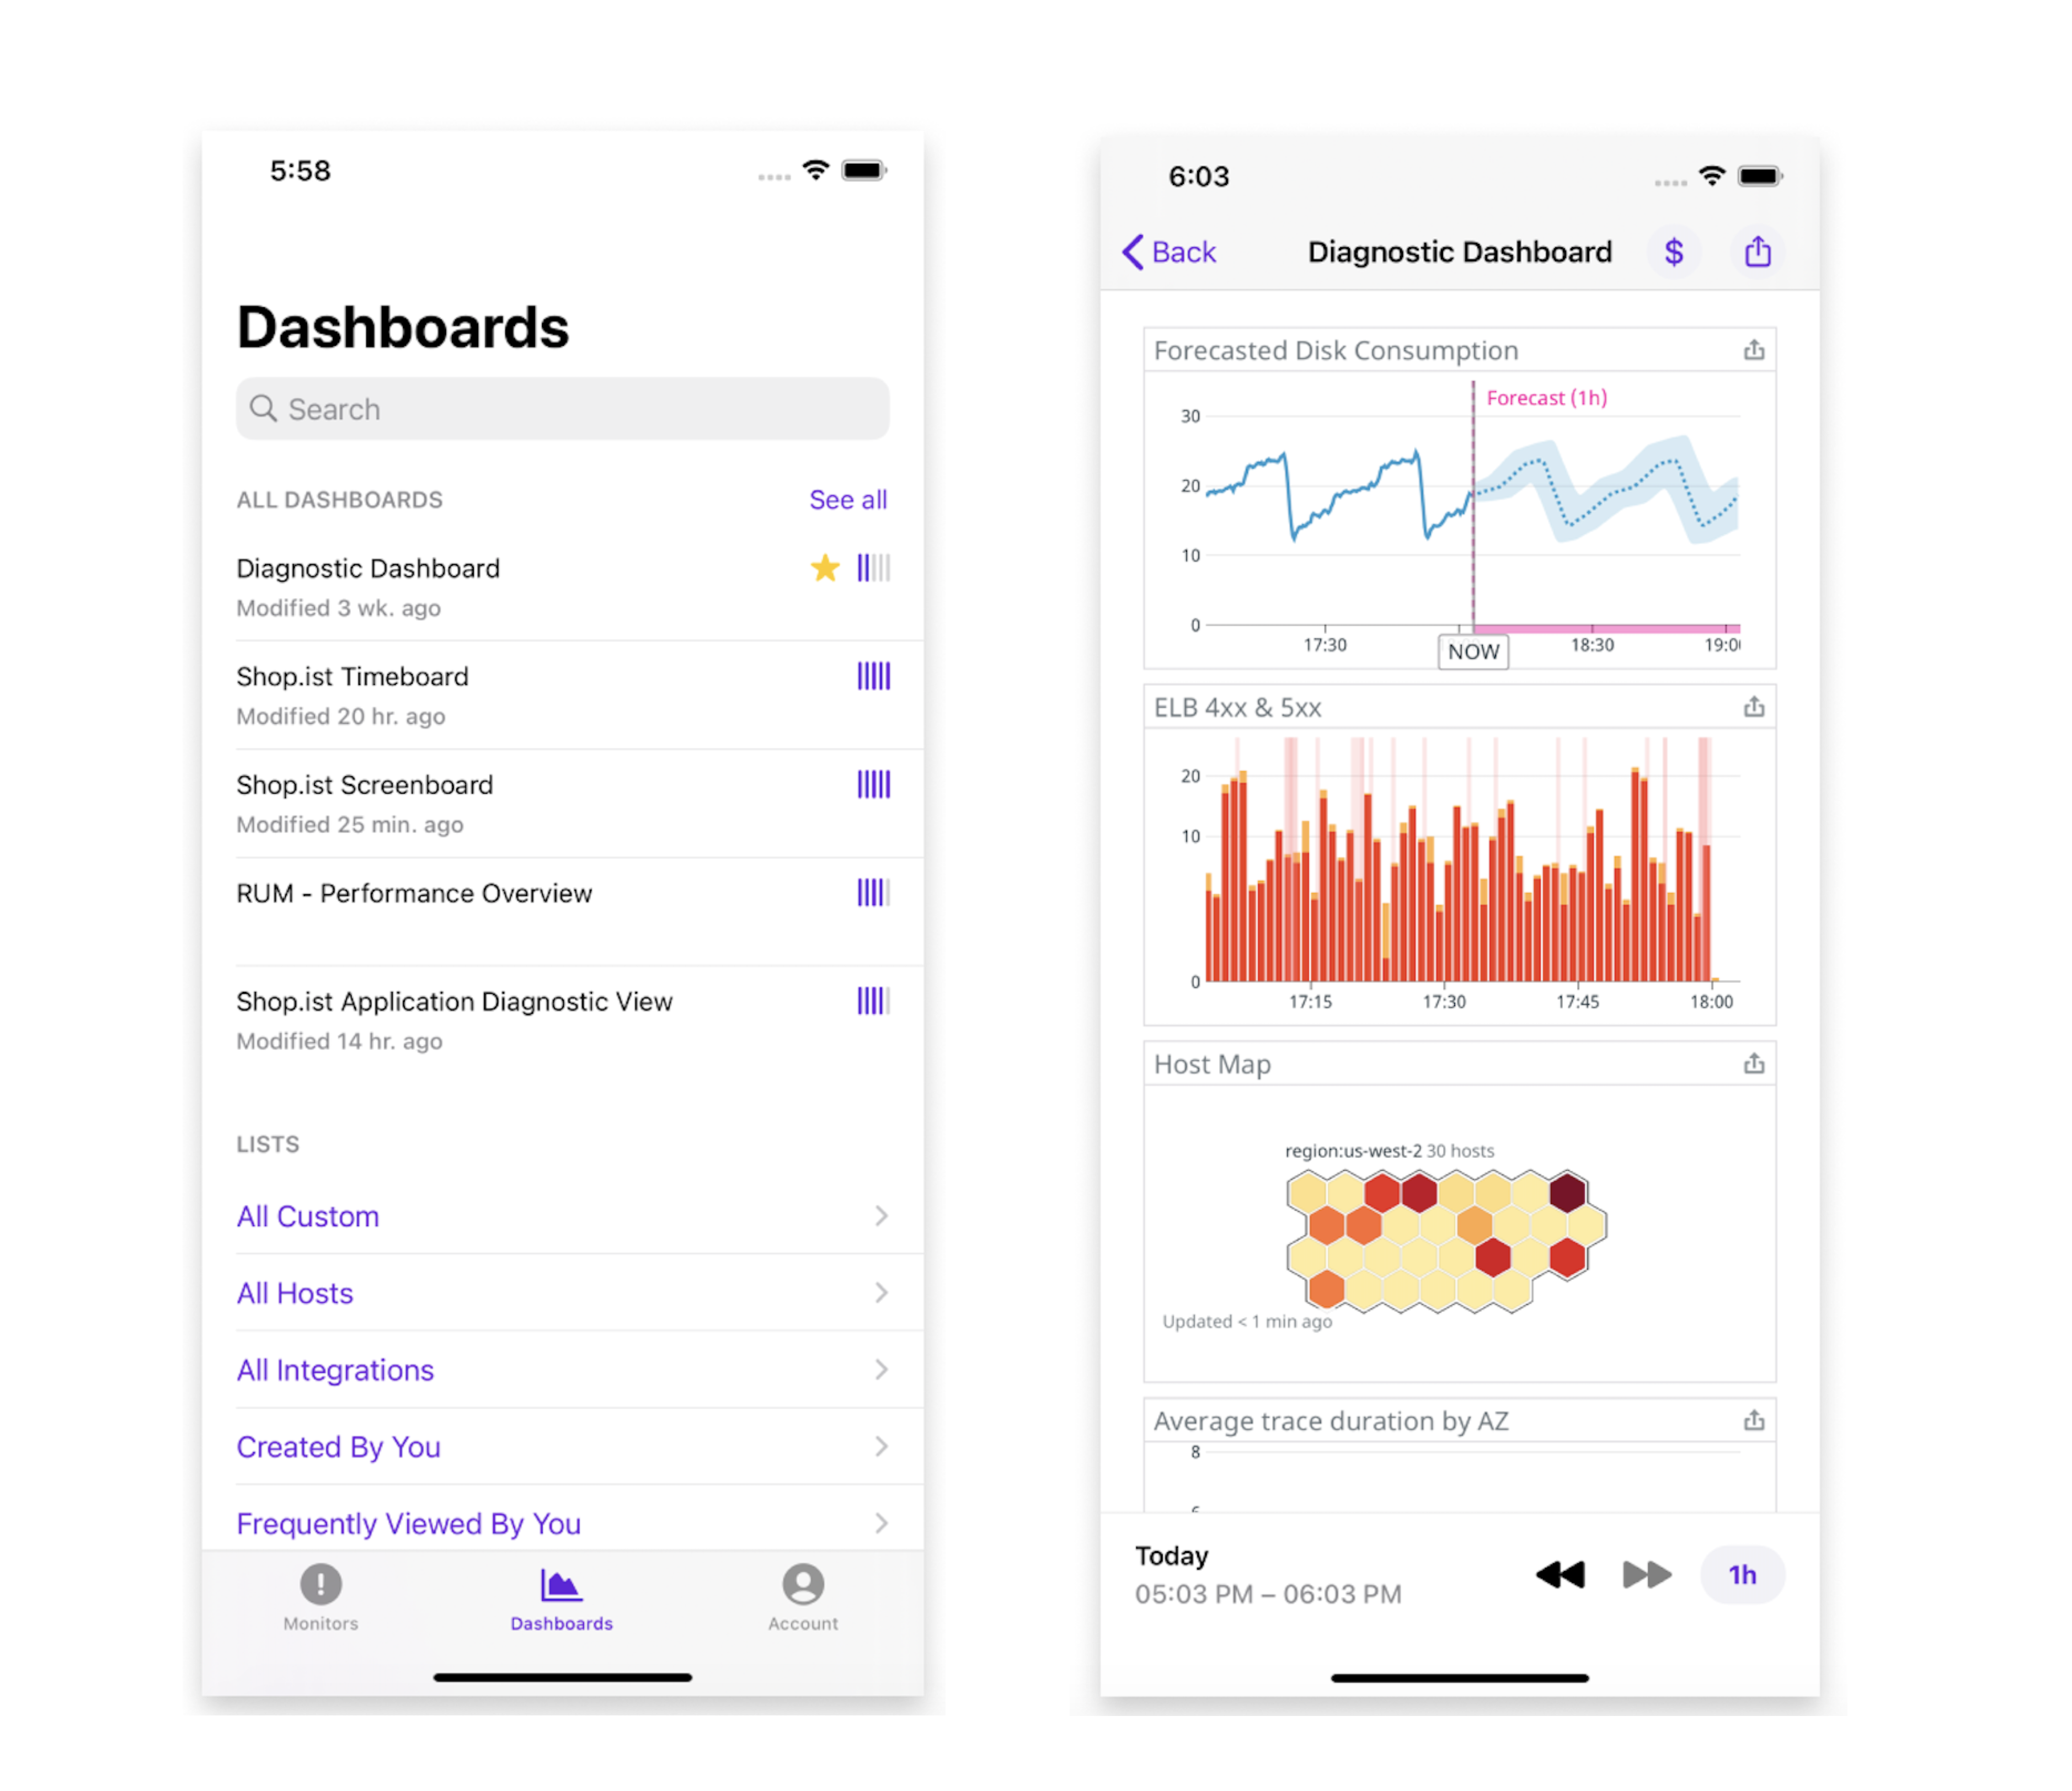
On the Dashboards page, you can view and search all of the dashboards that you have access to in your Datadog org, and filter them using the same template variables you have set up in the Datadog web app. Quickly filter your dashboards using template variable saved views. For more information about template variable saved views, see Dashboard Saved Views. Click on an individual dashboard to view it.
Note: To set up or edit a dashboard, you need to login to the Datadog browser app. For more information, see Dashboards.
Incidents
On the Incidents page, you can view, search and filter all incidents that you have access to in your Datadog account from the Datadog Mobile App to ensure quick response and resolution from anywhere. You can also declare and edit incidents and seamlessly communicate to your teams through integrations with Slack, Zoom, and many more. For more information about Incidents, see the Datadog Incident Management documentation.
Create an incident
- Navigate to the incident list by clicking on the Incidents Tab in the bottom bar.
- Click the “+” button in the top right corner.
- Give your incident a title, severity, and commander.
Receive push notifications for incidents
- Navigate to Account.
- Click Notifications.
- Select the toggle for Enable Notifications. (Note: For Android, notifications will be enabled automatically when you install the latest version of the Datadog mobile app.)
- Next, in the Datadog web app, navigate to Incident Notification Rules.
- Create or edit a notification rule and under Notify, type your name. Two options should appear, allowing you to choose between email notifications and your mobile device.
- Select your mobile device and click Save.
For more information on configuring Incident Notification Rules, see the Incidents settings docs.
Widgets
Open Incidents widget
View your open incidents from your mobile home screen with Datadog widgets.
To dive deeper into issues, tap any open incident displayed in the widget to have it open with more details in the Datadog mobile app.
Also, you can customize your Open Incidents widgets by filtering on:
- Organization
- Severity levels
- Customers impacted
- Ordering
Create an Open Incidents widget
- Tap the + button on the top left corner of the screen.
- Search for “Datadog” widgets.
- Select your preferred size (small, medium, or large).
- Drag the widget to your desired, on-screen location.
- Long press on your home screen.
- Tap the Widgets button on your home screen editor. If you have app shortcuts, it might appear as only an icon on the top right corner of the bubble.
- Drag the widget to your desired, on-screen home screen.
- Resize the widget to fit your preference.
Edit an Open Incidents widget
- Long press the widget to configure.
- Tap Edit Widget.
- Tap Choose next to the Organzation label to fetch open incidents from the selected organization.
- Tap SEV-1 and SEV-2 next to the Severities label to specify severity filters.
- Tap Both next to the Customer Impacted label to filter on open incidents that have impacted customers.
- Type in the Type additional filters text box to specify any further filtering.
- Tap Ordering to specify the order of how incidents are listed.
- Tap outside of the widget to save your selection and exit the configuration screen.
- Tap the widget title to configure.
- Tap Organization to fetch open incidents from the selected organization.
- Tap Severities to specify severity filters.
- Tap Customer impacted to filter on open incidents that have impacted customers.
- Tap Query to specify any further filtering.
- Tap Sorted by to specify the order of how incidents are listed.
- Tap Save or Apply to save your selection and exit the configuration screen.
- Long press and resize the widget to fit your preference.
Display Open Incidents from multiple organizations
You can display open incidents from multiple organizations on your mobile home screen.
- Tap Choose next to the Organization label to fetch open incidents from the selected organization.
- Tap the widget title to configure.
- From the configuration screen, tap Organization.
- Select a new organization (you may need to sign in).
- Size the widget to fit your preference.
- Tap Save or Apply.
Delete an Open Incidents widget
Delete a widget by tapping the - button at the top left of the widget when editing your home screen, or by long pressing the widget and selecting Remove Widget.
Delete a widget by long pressing, dragging, and dropping the widget to the Remove button.
SLOs widget
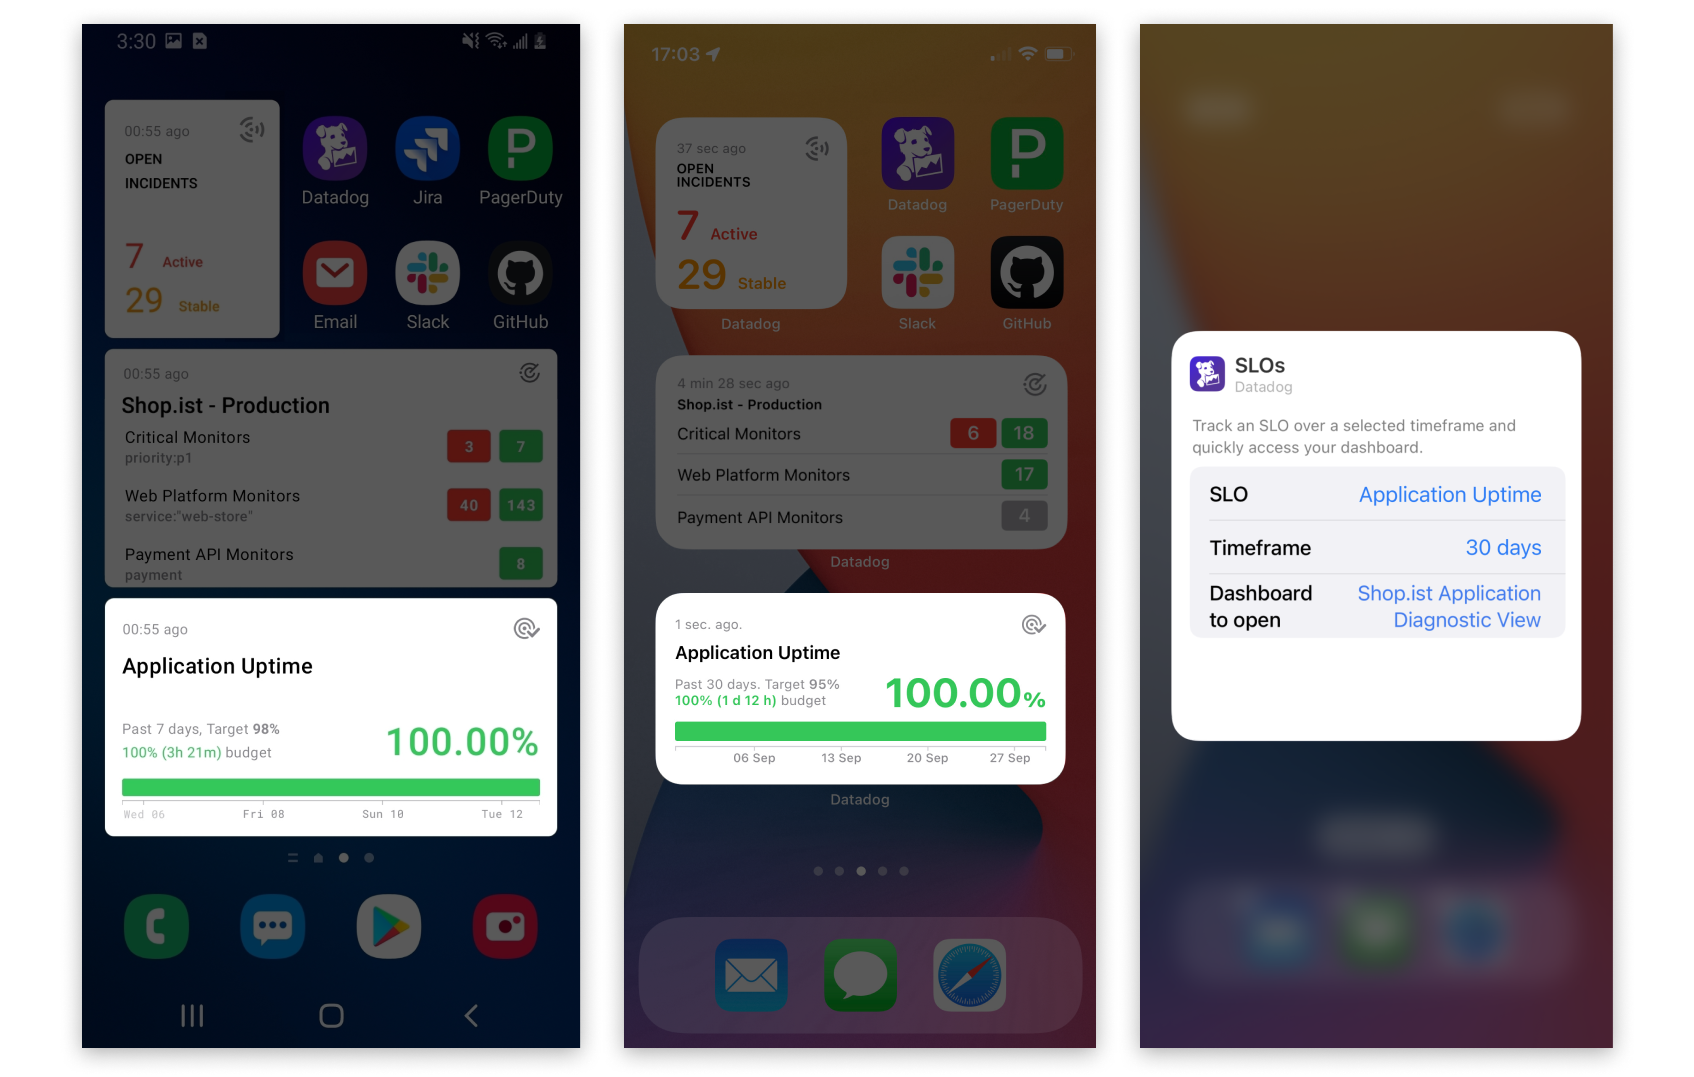
View your SLOs from your mobile home screen with Datadog widgets. You can add any SLOs from your organization as a widget, along with a timeframe.
Timeframe options are:
- 7 days
- 30 days
- 90 days
- Previous week
- Previous month
- Week to date
- Month to date
You can also specify a dashboard that opens by default when you tap on an SLOs widget, allowing you to quickly investigate further into your metrics.
Note: If you do not specify a dashboard that opens by default, tapping an SLOs widget opens the Datadog app.
Create an SLOs widget
- Long press on your home screen.
- Tap the “+” button on the top left corner of the screen.
- Search for “Datadog” widgets.
- Select your preferred size (small shows one SLO and medium shows one SLO along with a visualized timeframe of its health).
- Drag the widget to your desired, on-screen location.
- Long press on your home screen.
- Tap the “Widgets” button on your home screen editor. If you have app shortcuts, it might appear as just an icon on the top right corner of the bubble.
- Drag the widget to your desired, on-screen home screen.
- Resize the widget to fit your preference. It always shows one SLO. If you size the widget to take up the width of your mobile home screen, it displays the selected SLO along with a visualized timeframe of its health.
Edit an SLOs widget
- Long press on the widget to configure.
- Tap “Edit Widget.”
- Tap “Choose” next to the SLO label to choose an SLO to track.
- Depending on the SLO chosen, a “Timeframe” label may appear. Tap “Choose” next to the “Timeframe” label to choose the SLO timeframe.
- Tap “Choose” next to the “Dashboard to open” label to choose a dashboard that opens when the SLOs widget is tapped.
- Tap out of the widget to validate your selection and exit the configuration screen.
- Tap the widget title to configure.
- Tap “Selected SLO” to choose an SLO to track.
- Tap “Selected Time Window” to choose the SLO timeframe.
- Tap “Dashboard to open” to choose a dashboard that opens when the SLOs widget is tapped.
- Tap “Save” or “Apply” to validate your selection and exit the configuration screen.
- Long press and resize the widget to fit your preference.
Display SLOs from multiple organizations
You can display SLOs from multiple organizations on your mobile home screen.
All organizations you’ve logged into are displayed in the configuration screen. If you do not see your organization, sign into it again.
- Tap the widget title to configure.
- From the configuration screen, tap “Organization”.
- Select a new organization (You might need to sign in).
- Size the widget to fit your preference.
- Tap “Save” or “Apply”.
Delete an SLOs widget
Delete a widget by tapping the “-” button at the top left of the widget when editing your home screen, or by long pressing on the widget and selecting “Remove Widget”.
Delete a widget by long pressing, dragging, and dropping the widget to the “Remove” button.
Monitors widget
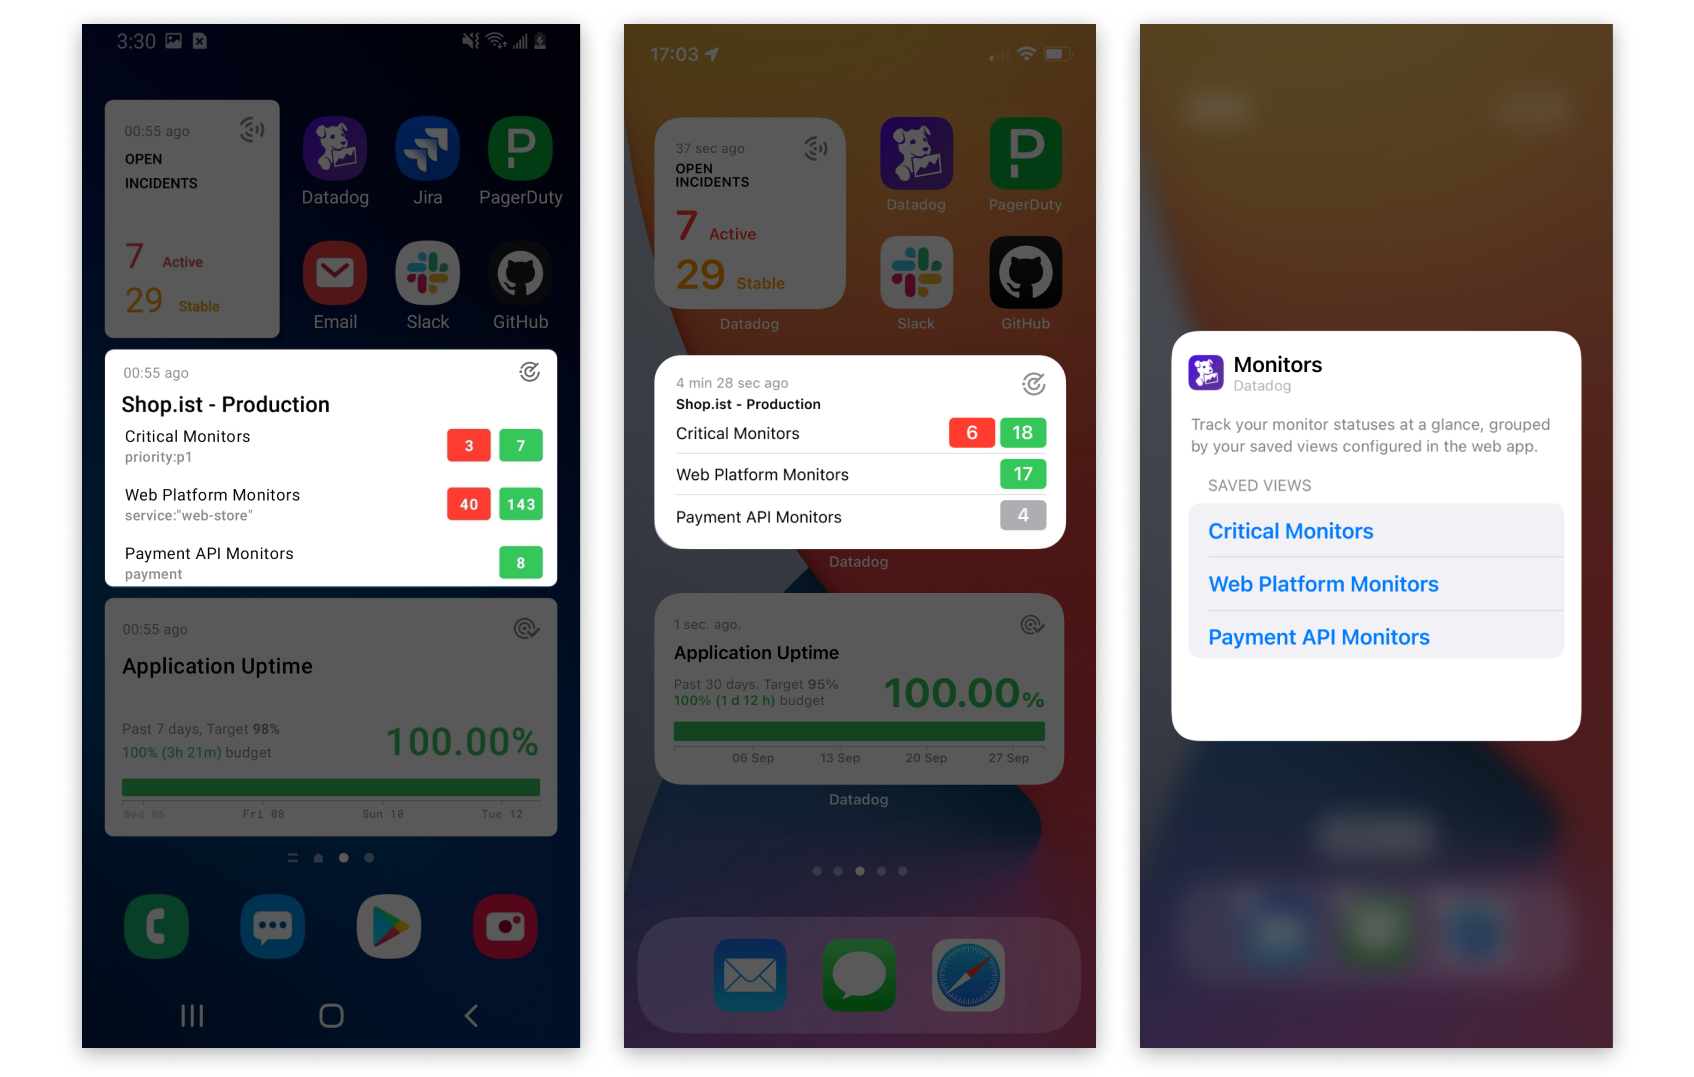
View your monitors from your home screen with Datadog widgets. Tap any cell to open the Monitor Search screen in the app, with your monitors already filled in.
Note: If you do not have any monitor saved views, the widget shows you all monitors by default.
Create a Monitors widget
- Long press on the home screen.
- Tap the “+” button on the top left corner of the screen.
- Search for “Datadog” widgets.
- Select your preferred size (small shows two monitor saved views, medium allows up to three monitor saved views, and large up to six monitor saved views).
- Drag the widget to your desired, on-screen location.
- Long press on your home screen.
- Tap “Widgets” on your home screen editor. If you have app shortcuts, it might appear as just an icon on the top right corner of the bubble.
- Drag the widget to your desired, on-screen home screen.
- Resize the widget to fit your preference. To show more saved views, increase the length of the widget on your mobile home screen.
Edit a Monitors widget
- Long press on the widget to configure.
- Tap on “Edit Widget”.
- Tap on the individual saved view cell to select and deselect.
- Reorder the views by dragging and dropping each cell.
- Tap out of the widget to validate your selection and exit the configuration screen.
- Tap on the widget title to configure.
- Tap on “Saved Views”.
- Tap on the individual saved view cell to select and deselect.
- Reorder the views by dragging and dropping each cell.
- Tap “Save” or “Apply” to validate your selection and exit the configuration screen.
- Scroll inside the widget to see more saved views. Long press and resize the widget to fit your preference.
Display Monitors from multiple organizations
You can display Monitors from multiple organizations within the same widget.
All organizations you’ve logged-in are displayed in the configuration screen. If you do not see your organization, you may need to sign in again.
- Tap the widget title to configure.
- From the configuration screen, tap “Organization”.
- Select a new organization (you might need to sign in).
- Edit the widget to fit your preference.
- Tap “Save” or “Apply”.
Delete a Monitors widget
Delete a widget pressing the “-” button at the top left of the widget when editing your home screen, or by long pressing on the widget and then selecting “Remove Widget”.
Delete a widget by long pressing, dragging, and dropping the widget on the “Remove” button.
Quick actions
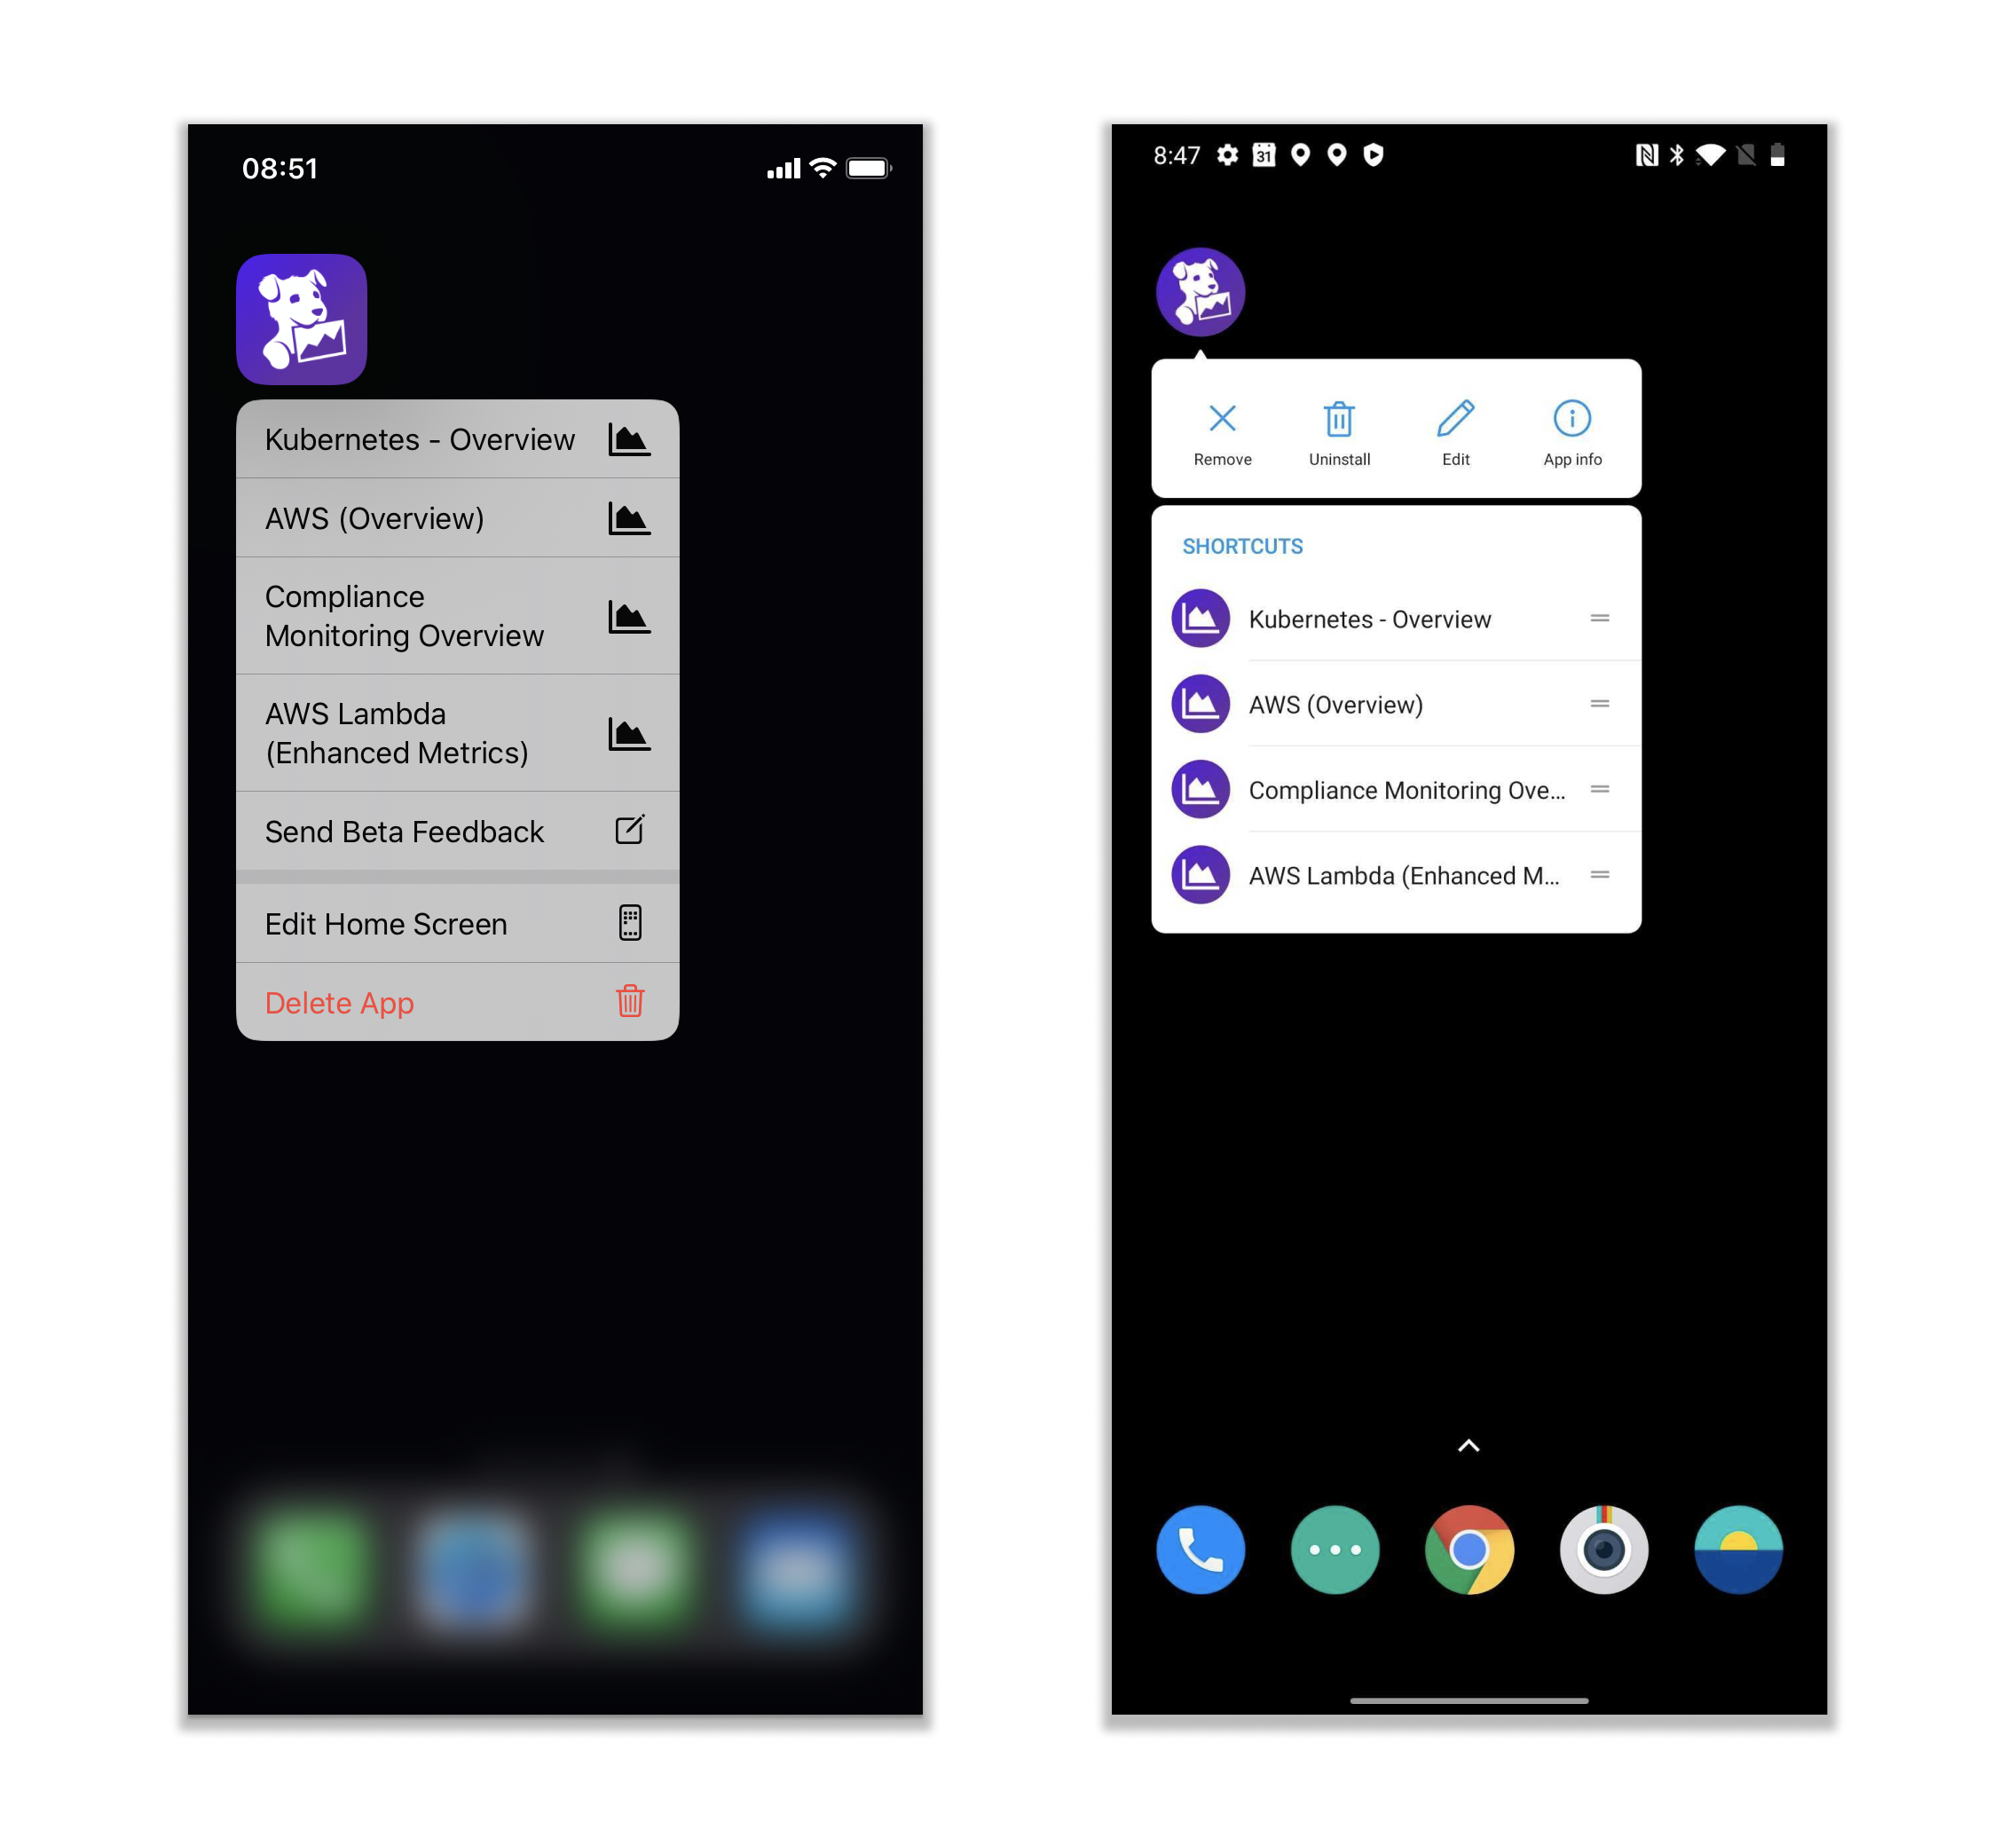
Long-press the app icon to display a quick-action sheet of your top five Frequently Viewed By Me dashboards for iOS (measured by view count and recency), or your five most opened dashboards on mobile for Android. Tap a result to open the dashboard in-app.
Search from home screen
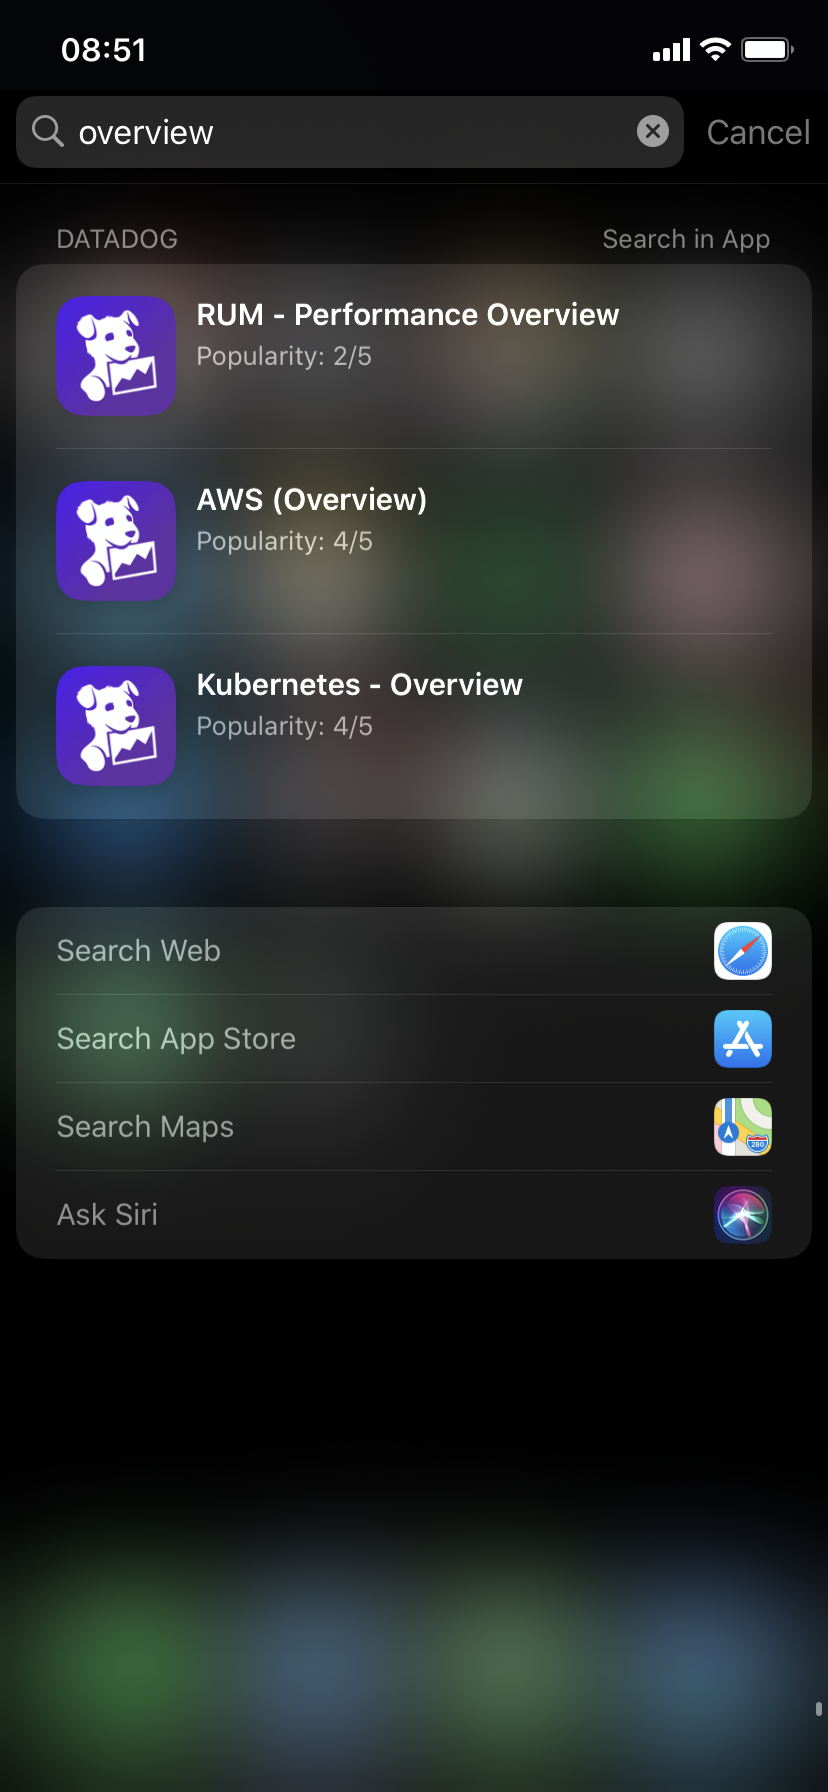
iOS only: Within iPhone Search, filter and search for the name of any desired dashboard. Press on a result to open the dashboard view directly on the mobile app, or press the “Search in App” button to open the search query in the in-app Dashboard List page.
Shortcuts and Siri suggestions
Android: Create shortcut icons for your dashboards by touching and holding the Datadog app icon, then lift your finger. If the app has shortcuts, it displays a list. Touch and hold the desired shortcut, then drag and drop it to another location on your screen to create a unique shortcut icon.
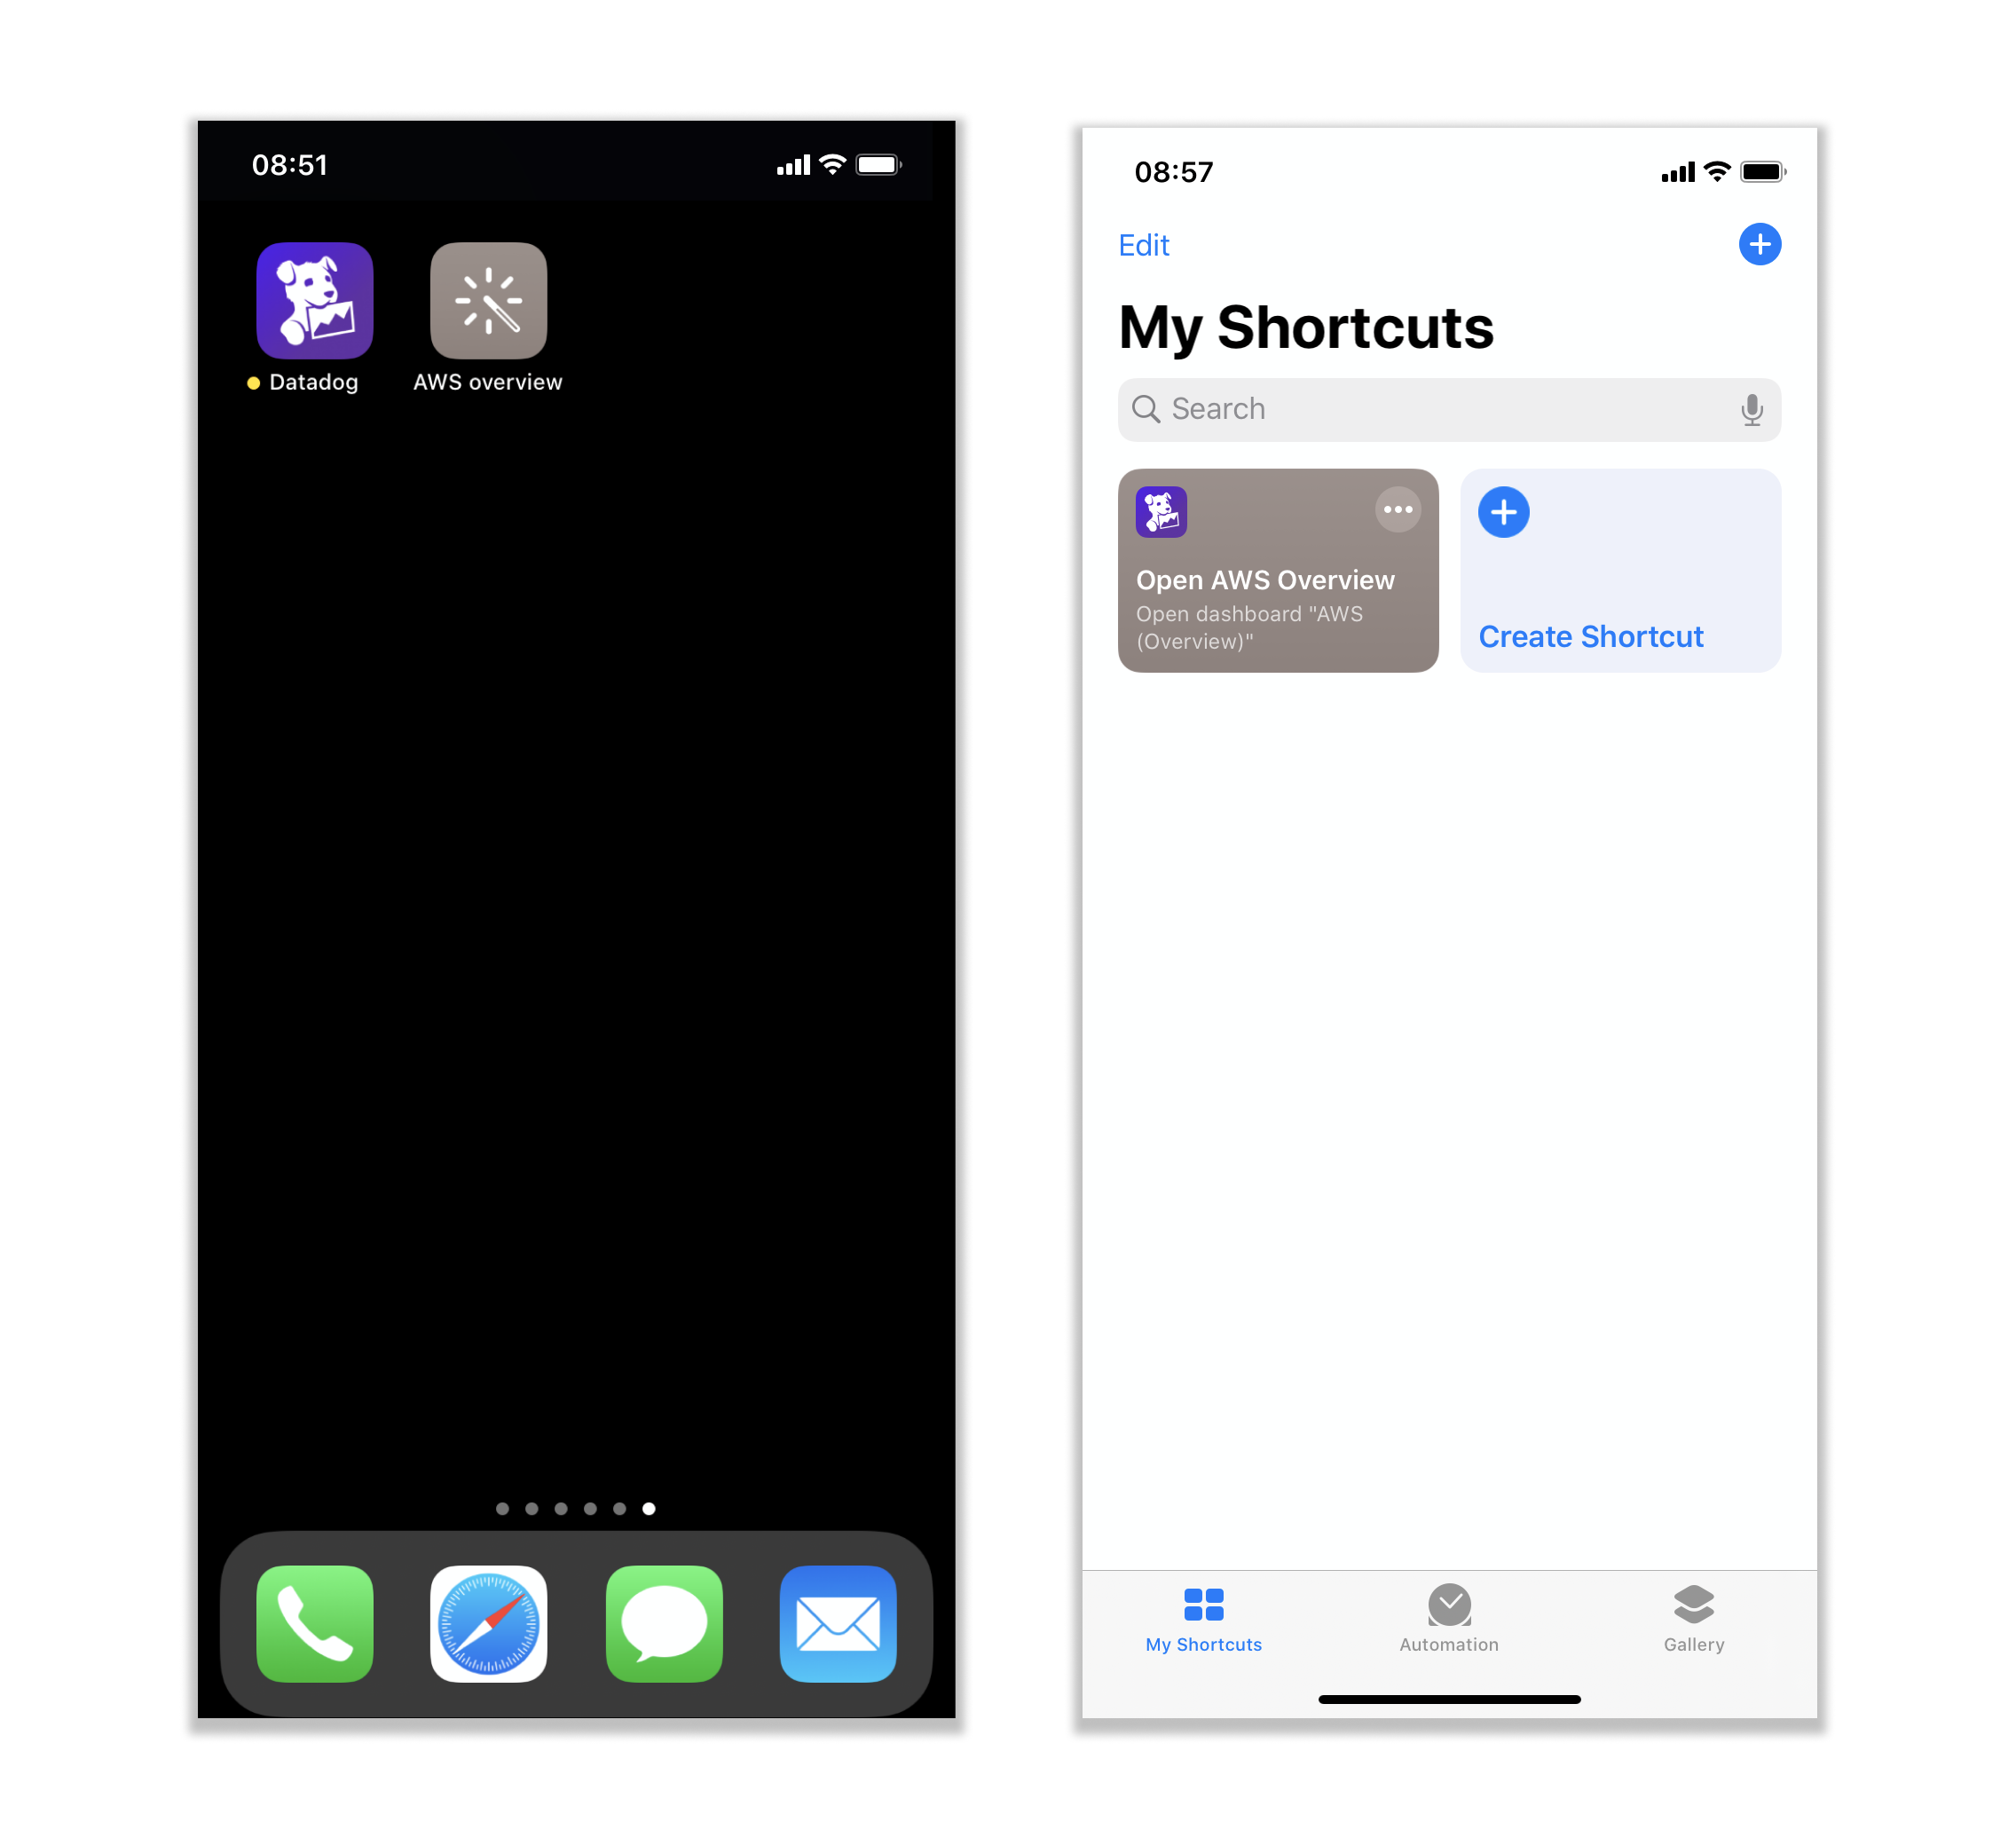
iOS: Create Siri Shortcuts for Datadog dashboards and monitors through the Shortcuts App. For a shortcut to be available for creation, you must execute the desired action at least once in the app. For example, to create an “Open AWS Overview Dashboard” shortcut, open the AWS Overview Dashboard in your mobile app at least once.
With the shortcut, you can access your dashboards and monitors through three key actions:
- Pin the shortcut as an icon in your home screen. To do so, access the Shortcuts app, and open the edit menu for your dashboard shortcut.
- Siri Voice: say your shortcut name, such as “Open AWS Overview”, and Siri opens your dashboard in-app.
- Siri suggestions: Siri learns your routine, and suggests dashboard shortcuts when you most need them, through a home or lock-screen banner, iPhone search, or iOS 14 Siri Suggestions widgets.
For more information about Siri shortcuts and suggestions, read the Apple Siri documentation.
Handoff
iOS Only: Use Apple Handoff to continue your task across Apple devices. While in use, the icon of the Datadog mobile app appears on your Mac at the left end of the Dock. Click on the icon to open your current dashboard or monitor on your Mac.
For Handoff to work, each device must:
- Be signed in to iCloud with the same Apple ID
- Have Bluetooth enabled
- Have Wi-Fi enabled
- Have Handoff enabled
For more information about Handoff, read the Apple Handoff documentation.
Account
Switch organizations or log out from the Account page.
Troubleshooting
For help with troubleshooting, contact Datadog support. You can also send a message in the Datadog public Slack #mobile-app channel.
Further Reading
Additional helpful documentation, links, and articles:
