- Essentials
- Getting Started
- Datadog
- Datadog Site
- DevSecOps
- Serverless for AWS Lambda
- Agent
- Integrations
- Containers
- Dashboards
- Monitors
- Logs
- APM Tracing
- Profiler
- Tags
- API
- Service Catalog
- Session Replay
- Continuous Testing
- Synthetic Monitoring
- Incident Management
- Database Monitoring
- Cloud Security Management
- Cloud SIEM
- Application Security Management
- Workflow Automation
- CI Visibility
- Test Visibility
- Test Impact Analysis
- Code Analysis
- Learning Center
- Support
- Glossary
- Standard Attributes
- Guides
- Agent
- Integrations
- OpenTelemetry
- Developers
- Authorization
- DogStatsD
- Custom Checks
- Integrations
- Create an Agent-based Integration
- Create an API Integration
- Create a Log Pipeline
- Integration Assets Reference
- Build a Marketplace Offering
- Create a Tile
- Create an Integration Dashboard
- Create a Recommended Monitor
- Create a Cloud SIEM Detection Rule
- OAuth for Integrations
- Install Agent Integration Developer Tool
- Service Checks
- IDE Plugins
- Community
- Guides
- API
- Datadog Mobile App
- CoScreen
- Cloudcraft
- In The App
- Dashboards
- Notebooks
- DDSQL Editor
- Sheets
- Monitors and Alerting
- Infrastructure
- Metrics
- Watchdog
- Bits AI
- Service Catalog
- API Catalog
- Error Tracking
- Service Management
- Infrastructure
- Application Performance
- APM
- Continuous Profiler
- Database Monitoring
- Data Streams Monitoring
- Data Jobs Monitoring
- Digital Experience
- Real User Monitoring
- Product Analytics
- Synthetic Testing and Monitoring
- Continuous Testing
- Software Delivery
- CI Visibility
- CD Visibility
- Test Optimization
- Code Analysis
- Quality Gates
- DORA Metrics
- Security
- Security Overview
- Cloud SIEM
- Cloud Security Management
- Application Security Management
- AI Observability
- Log Management
- Observability Pipelines
- Log Management
- Administration
Manage Monitors
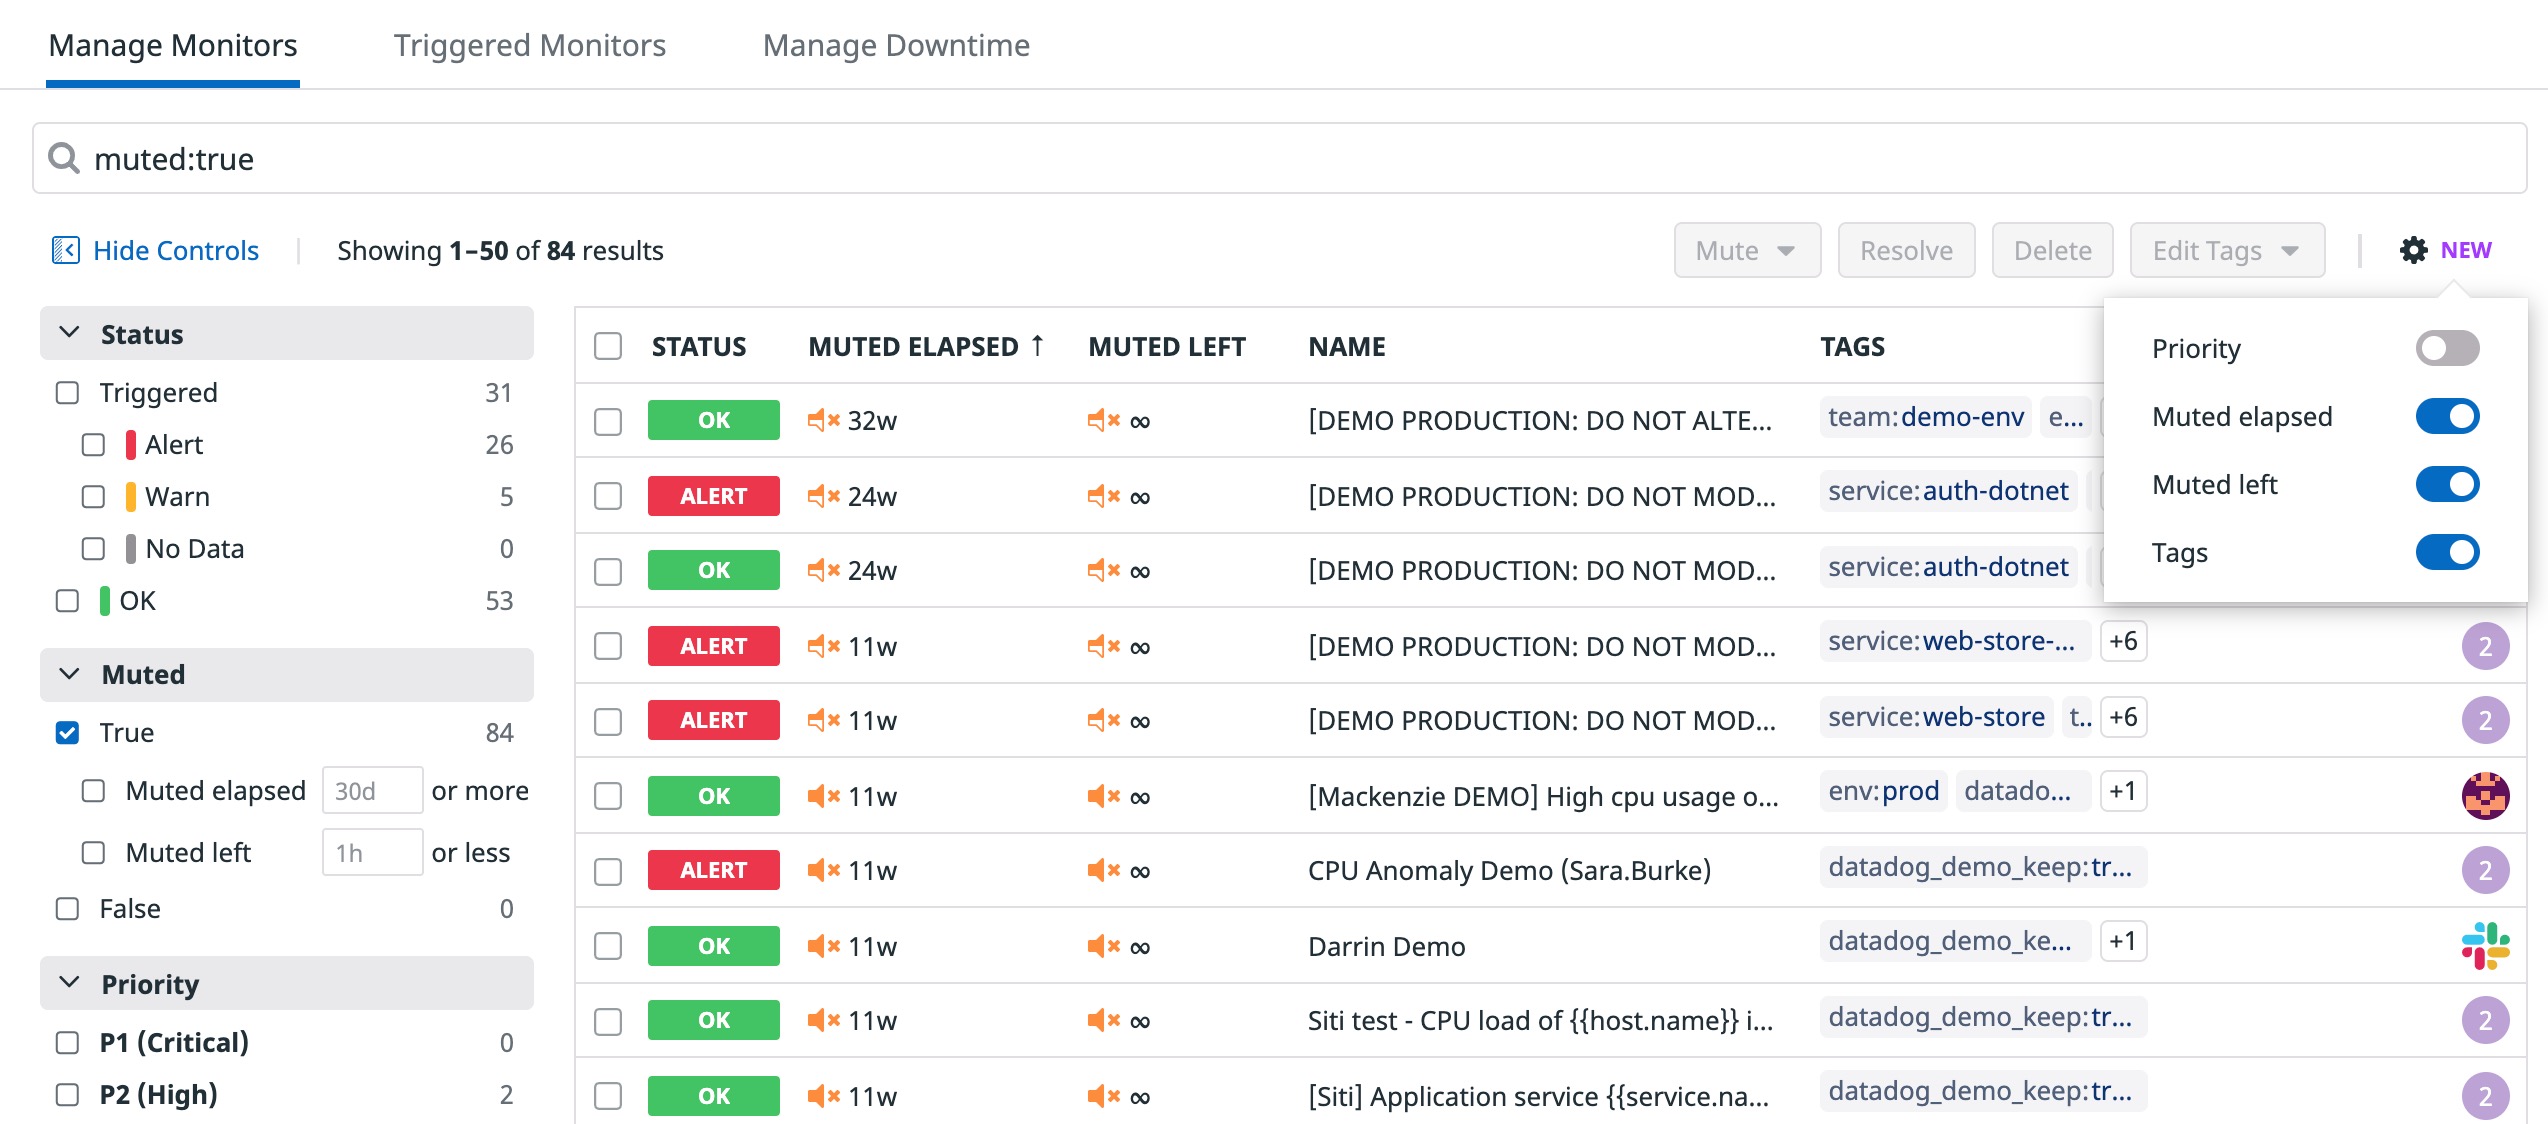
Use the Manage Monitors page to search, delete, mute, or resolve your monitors and edit monitor tags in bulk. You can also clone or edit individual monitors from the search results.
Search
To search your monitors, construct a query using the facet panel on the left or the search bar at the top.
Manage
After searching, select one or more monitors to update using the checkboxes next to each result. Select all results with the top checkbox next to the STATUS column heading. Modify the monitors in bulk using the buttons at the right above the search results:
| Option | Description |
|---|---|
| Mute | Mute the selected monitors for 1h, 4h, 12h, 1d, 1w, or Forever. |
| Unmute | If the selected monitors are muted, unmute them. |
| Resolve | Resolve the alert for the selected monitors. |
| Delete | Delete the selected monitors. |
| Edit Tags | Edit the monitor tags for the selected monitors. |
| Edit Teams | Edit the teams for the selected monitors. |
To edit an individual monitor, hover over it and use the buttons to the far right: Edit, Clone, Mute, Delete. To see more details on a monitor, click its name to see the status page.
Note: You can view Monitor Saved Views from your mobile device home screen or view and mute monitors by downloading the Datadog Mobile App, available on the Apple App Store and Google Play Store.
Triggered monitors
You can mute or resolve triggered monitors in bulk using the Triggered Monitors page. This page only shows monitors with a triggered status (Alert, Warn, or No Data).
Grouped results
The triggered monitors page shows a row for each group (reporting source) of each monitor. For example, a monitor grouped by host with 14 hosts in a triggered status shows 14 rows on the triggered monitors page. This lets you mute or resolve a monitor for specific reporting sources.
When writing a search query, the same attributes from the manage monitors page are available, even if they are not displayed as check boxes on the triggered monitors page.
Attribute differences for the triggered monitors page:
group_statusis the attribute name instead ofstatus.- The
triggeredattribute lets you filter monitors by how long they have been triggered. - The
groupattribute helps you narrow down search results for monitors grouped by more than one tag. For example, a monitor is grouped byhostandenv. After searching, you see four rows with the groupshost:web01,env:dev,host:web02,env:dev,host:web01,env:prod, andhost:web02,env:prod. Use thegroupattribute to only show prod hosts (group:"env:prod") or web02 hosts (group:"host:web02").
Monitor tags
Monitor tags are independent of tags sent by the Agent or integrations. Add up to 80 tags directly to your monitors for filtering on the manage monitors, triggered monitors, or manage downtime pages. Learn more about monitor tags in Assigning Tags for the UI.
Note: Monitor tags are added to the alert event generated by the monitor.
Further Reading
Additional helpful documentation, links, and articles:

