- Essentials
- Getting Started
- Datadog
- Datadog Site
- DevSecOps
- Serverless for AWS Lambda
- Agent
- Integrations
- Containers
- Dashboards
- Monitors
- Logs
- APM Tracing
- Profiler
- Tags
- API
- Service Catalog
- Session Replay
- Continuous Testing
- Synthetic Monitoring
- Incident Management
- Database Monitoring
- Cloud Security Management
- Cloud SIEM
- Application Security Management
- Workflow Automation
- CI Visibility
- Test Visibility
- Test Impact Analysis
- Code Analysis
- Learning Center
- Support
- Glossary
- Standard Attributes
- Guides
- Agent
- Integrations
- OpenTelemetry
- Developers
- Authorization
- DogStatsD
- Custom Checks
- Integrations
- Create an Agent-based Integration
- Create an API Integration
- Create a Log Pipeline
- Integration Assets Reference
- Build a Marketplace Offering
- Create a Tile
- Create an Integration Dashboard
- Create a Recommended Monitor
- Create a Cloud SIEM Detection Rule
- OAuth for Integrations
- Install Agent Integration Developer Tool
- Service Checks
- IDE Plugins
- Community
- Guides
- API
- Datadog Mobile App
- CoScreen
- Cloudcraft
- In The App
- Dashboards
- Notebooks
- DDSQL Editor
- Sheets
- Monitors and Alerting
- Infrastructure
- Metrics
- Watchdog
- Bits AI
- Service Catalog
- API Catalog
- Error Tracking
- Service Management
- Infrastructure
- Application Performance
- APM
- Continuous Profiler
- Database Monitoring
- Data Streams Monitoring
- Data Jobs Monitoring
- Digital Experience
- Real User Monitoring
- Product Analytics
- Synthetic Testing and Monitoring
- Continuous Testing
- Software Delivery
- CI Visibility
- CD Visibility
- Test Optimization
- Code Analysis
- Quality Gates
- DORA Metrics
- Security
- Security Overview
- Cloud SIEM
- Cloud Security Management
- Application Security Management
- AI Observability
- Log Management
- Observability Pipelines
- Log Management
- Administration
Device Topology Map
Overview
The Network Device Topology Map provides an overview of your network’s physical connections, so you can more easily identify issues in your devices and understand their upstream and downstream impacts.
Setup
The Datadog Agent version 7.52 and later automatically collects topology data. No additional installation is necessary.
Prerequisites
- Devices have LLDP (Link Layer Discovery Protocol) and/or CDP (Cisco Discovery Protocol) enabled with SNMP. Use the same protocol on connected devices so that they can discover each other. LLDP is generally preferred as it is a more common option.
- Datadog Agent version 7.52 or later is installed.
Navigation options
In the Network Topology Map, the following navigation options are available:
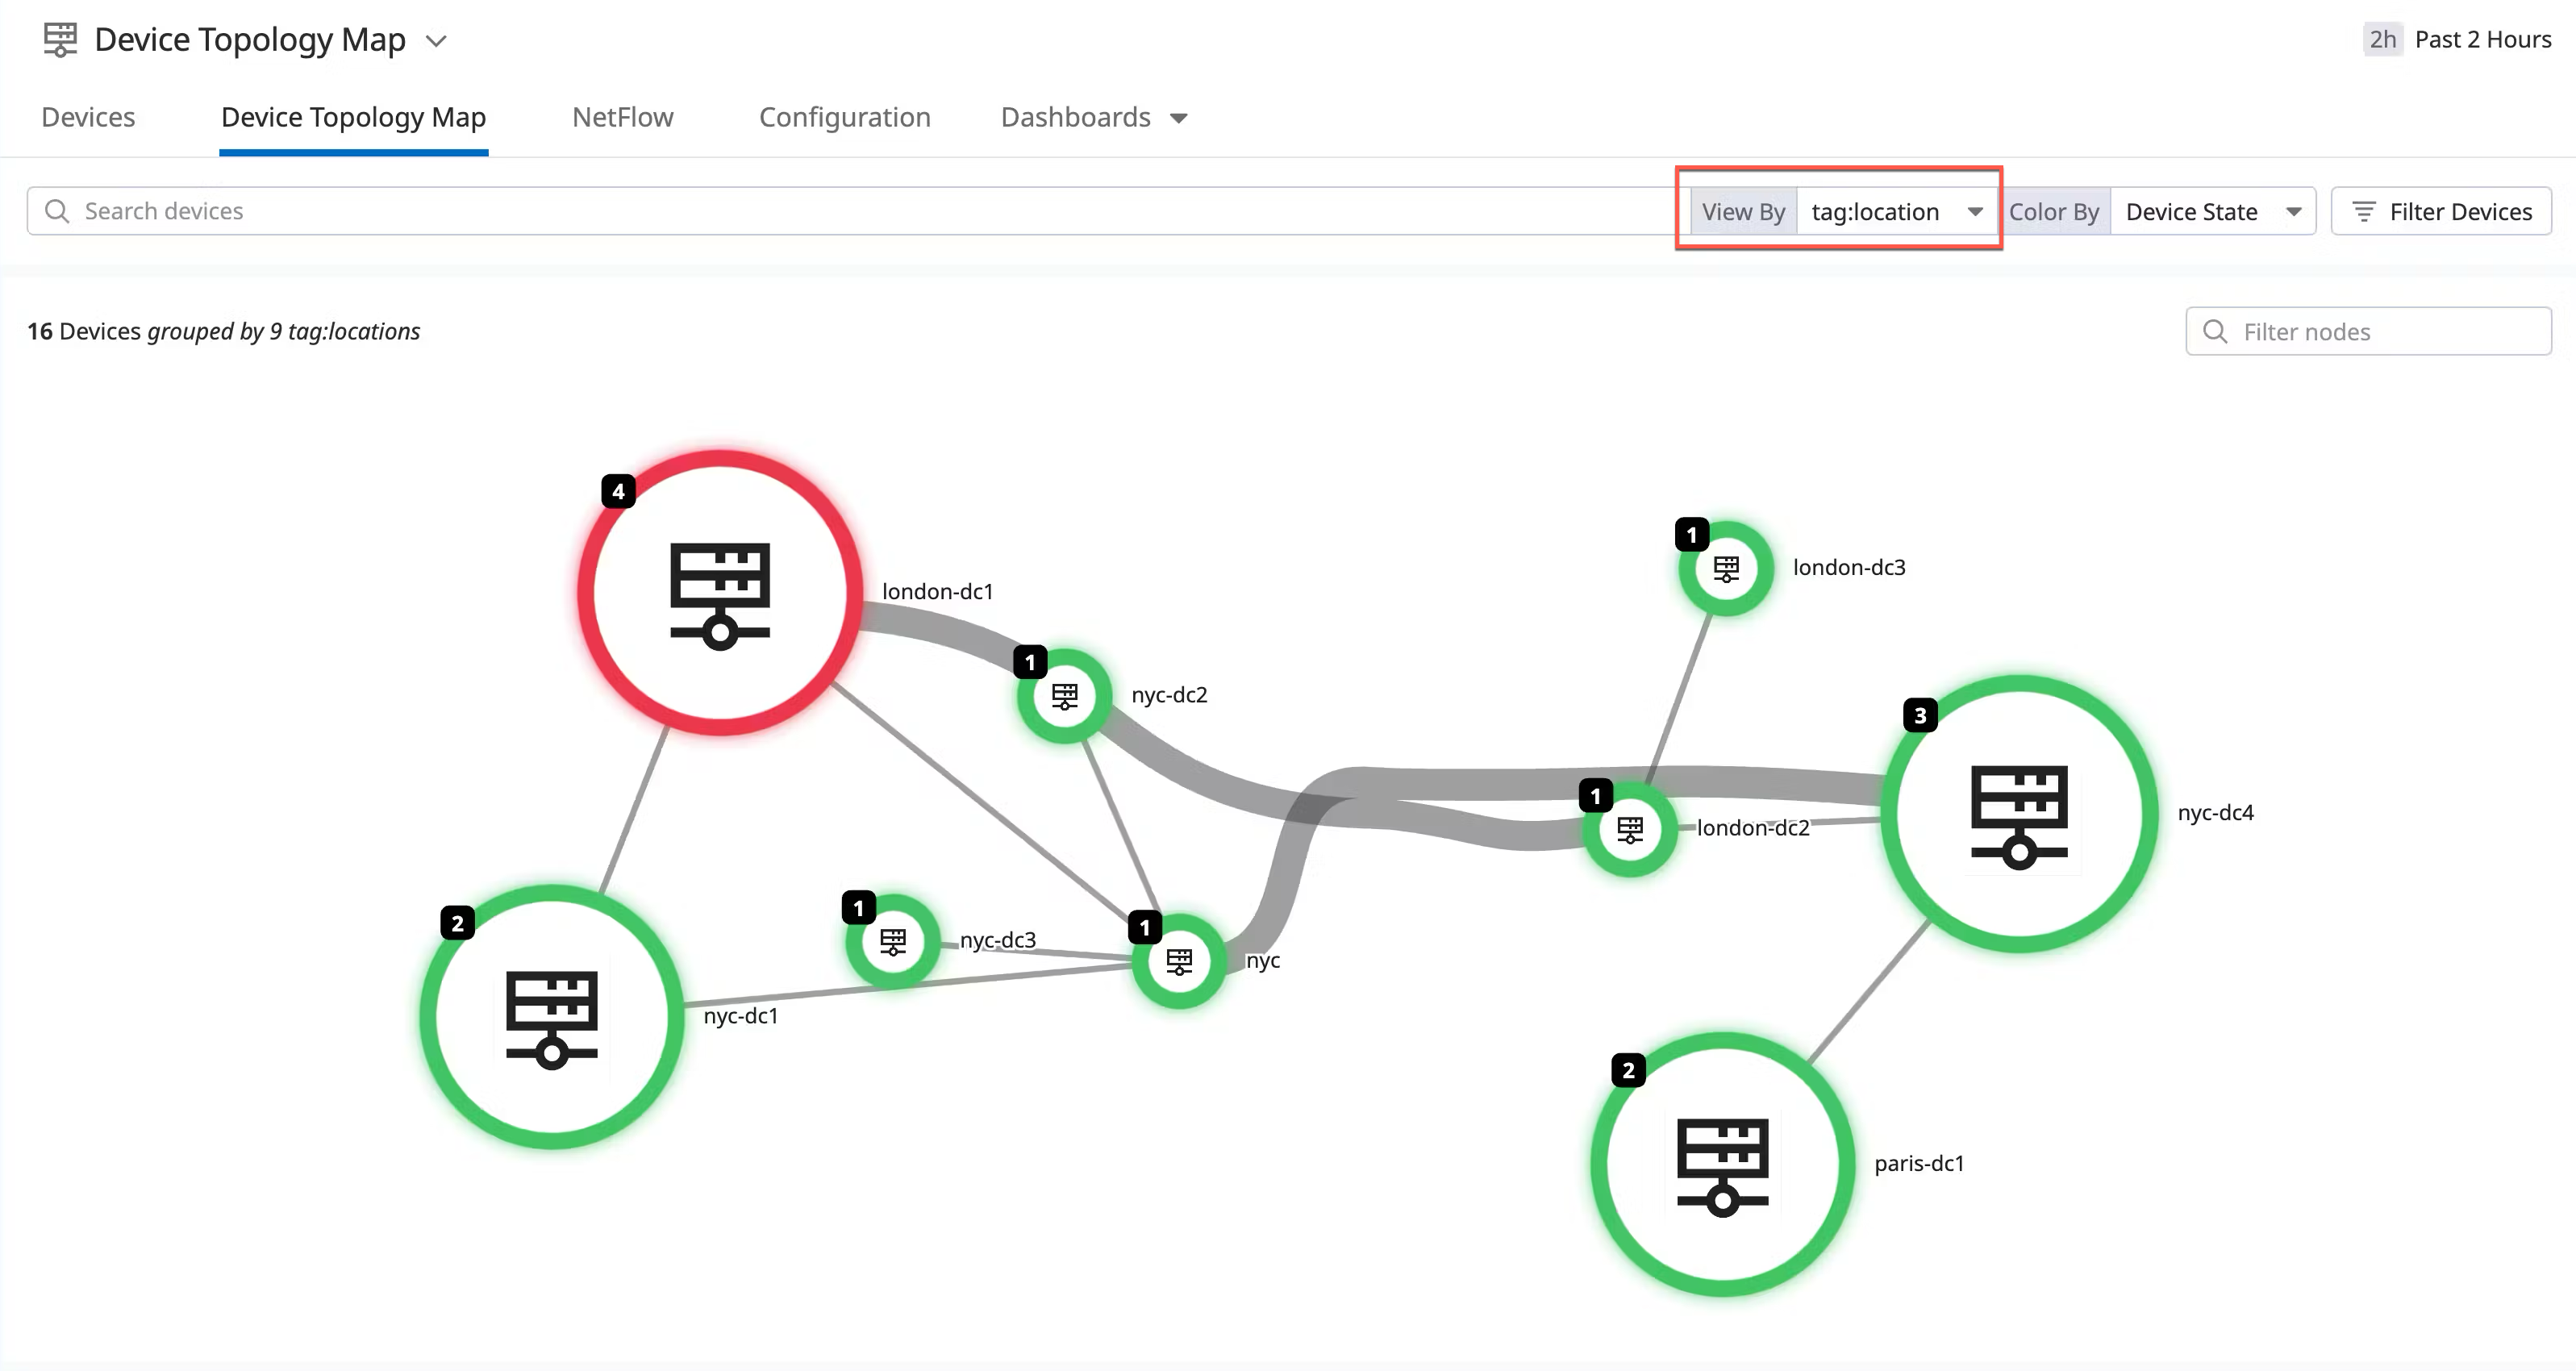
View
- In View By, use tags to select how you want to visualize devices:
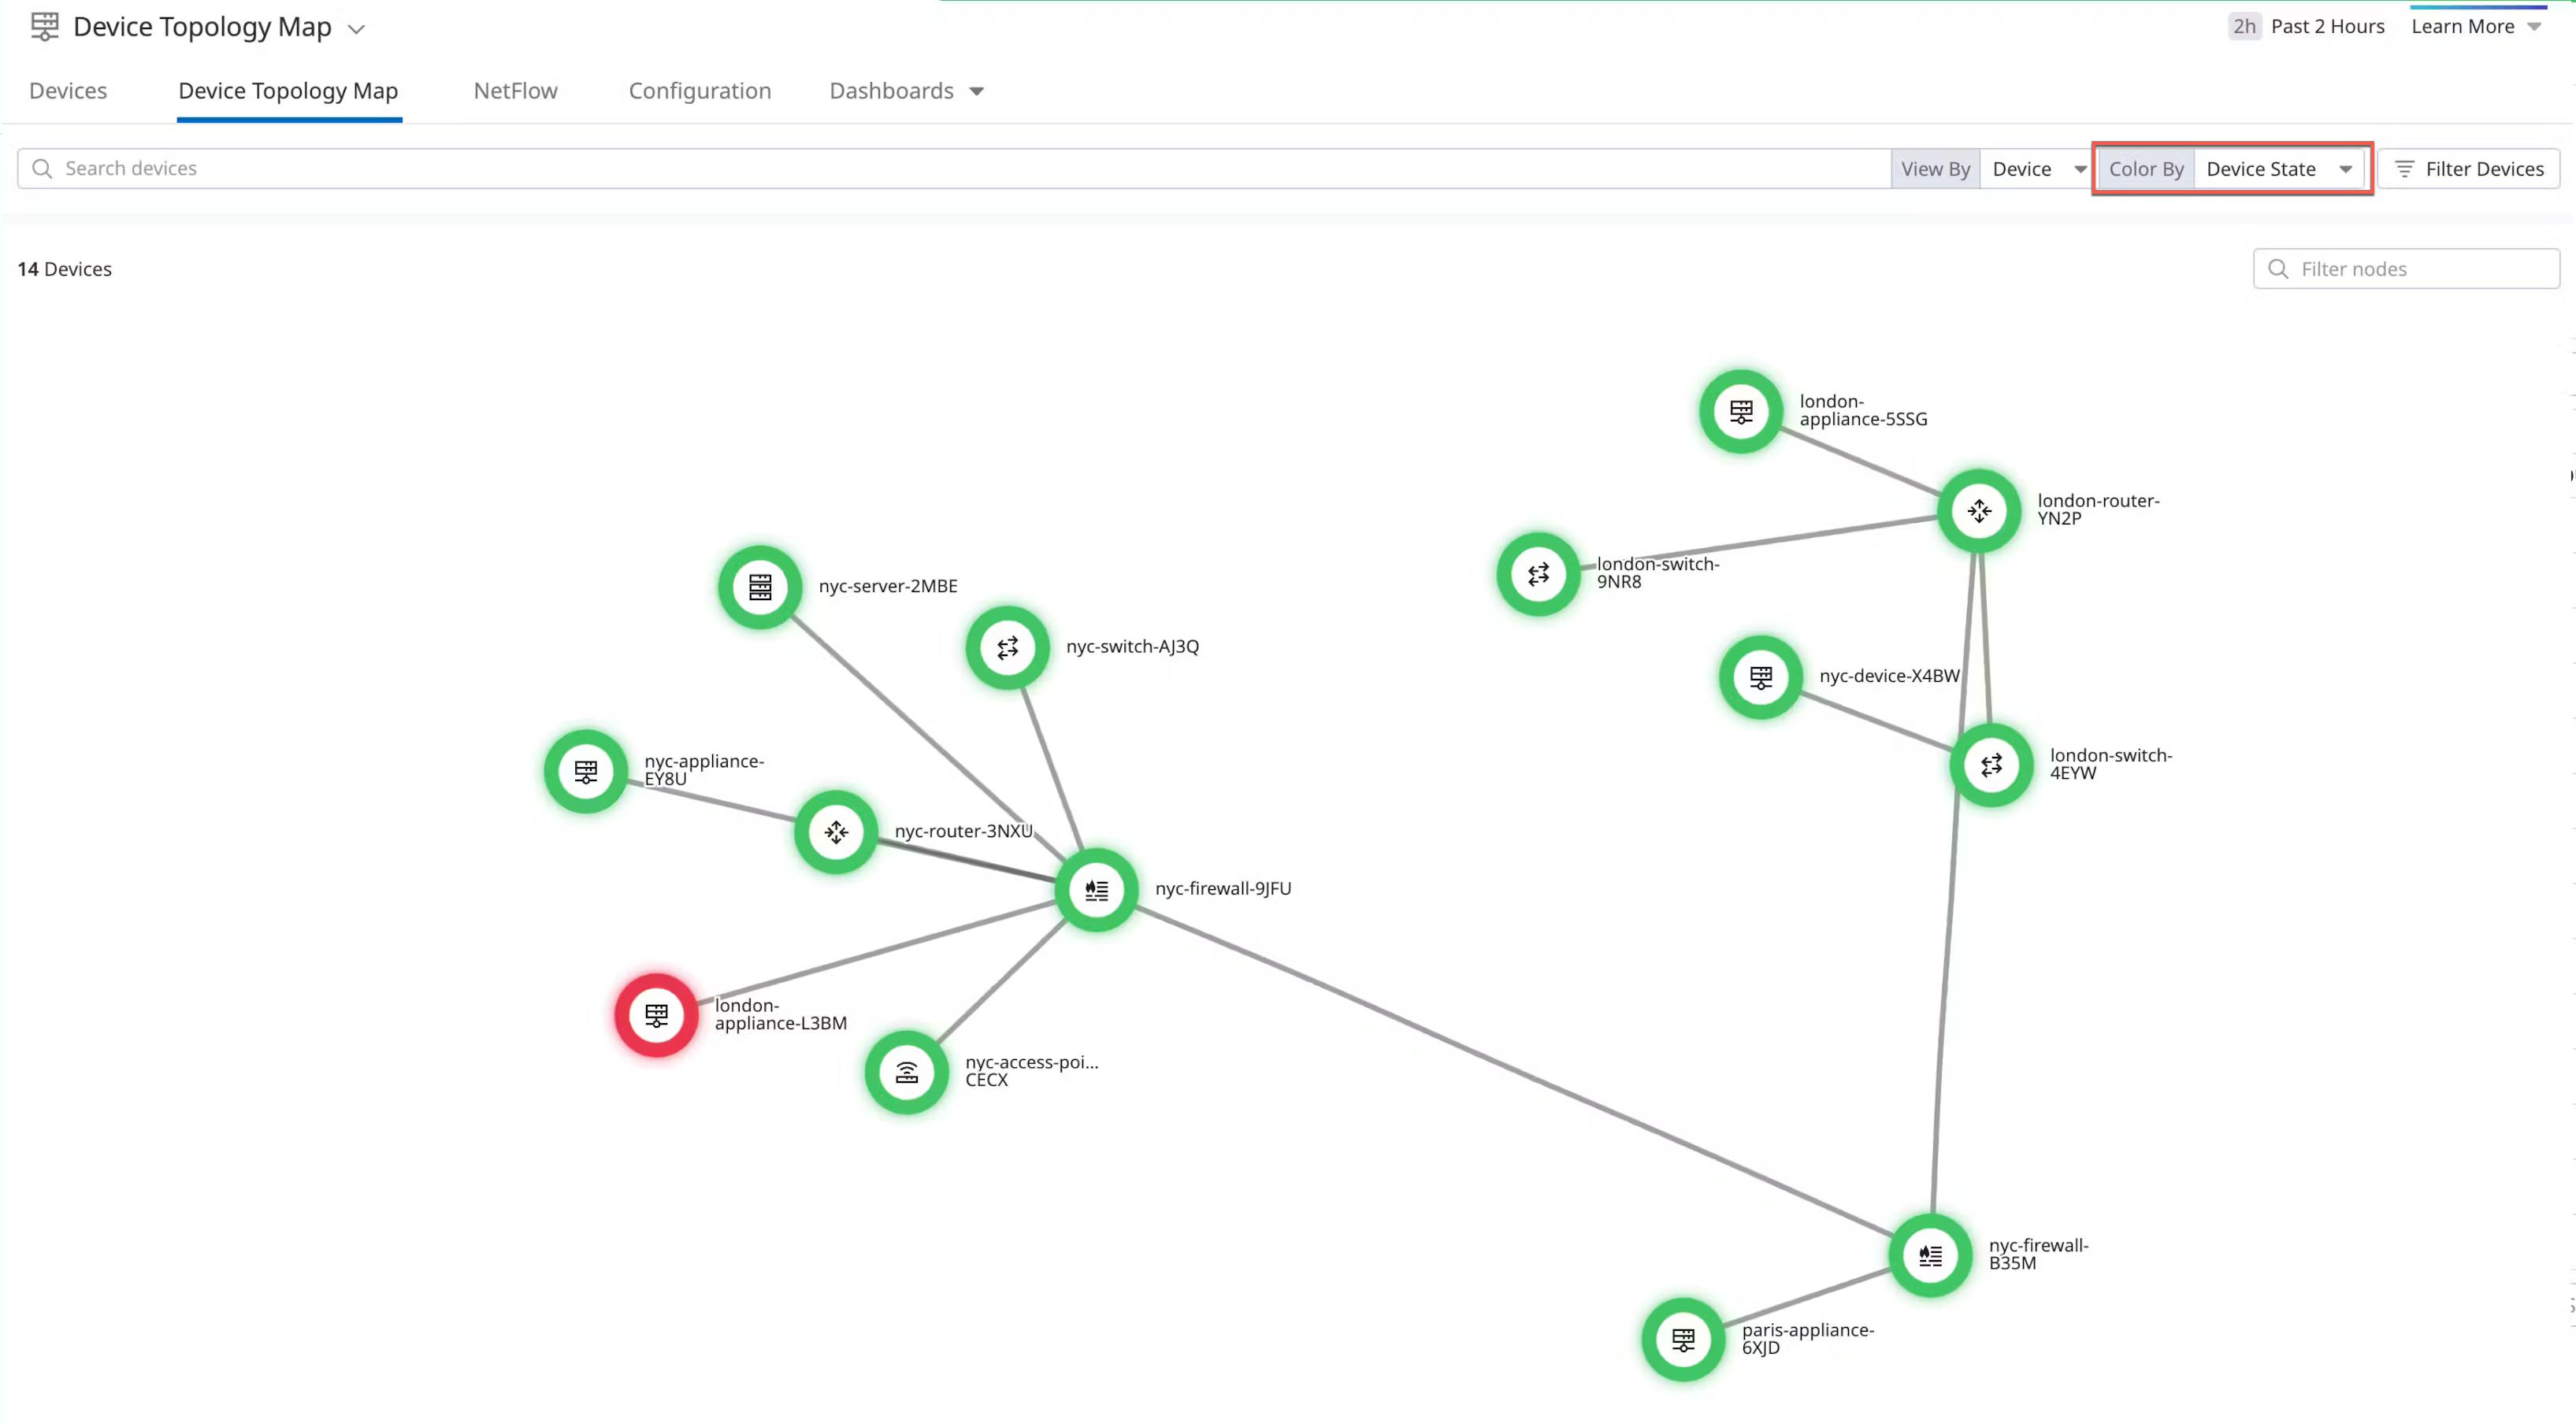
Color
- Under Color By, change how nodes on the Device Topology Map are colored based on:
- Device State: Display nodes on the Device Topology Map by SNMP reachability.
- Ping State: Display nodes on the Device Topology Map by Ping status.
The following are the definitions of the nodes for each color state:
| Color | Description |
|---|---|
| Green | Device is reachable. |
| Red | Issue with device, such as unreachable through SNMP. |
| Gray | Device is monitored by NDM; however, no data has been received. For example, if the ping wasn’t configured and you opted to color by Ping State in the Device Topology Map, the devices are displayed in gray. |
| No color | Shadow devices that are not directly monitored by NDM, but are discoverable through LLDP/CDP from a connected device that NDM is monitoring. You can toggle on/off the Hide N unmonitored device section if you want these devices to be shown on the Device Topology Map. |
Filter devices
- Under Filter Devices, gain further granular control over what devices are shown on the Device Topology Map.
Note: The Filter Devices setting impacts what devices are shown on the Device Topology Map for all queries you might make. For example, if you filter by a device facet in the search bar.
- Hide N Unmonitored Devices - Turned OFF by default.
- Toggling this on hides devices on the Device Topology Map that are not directly monitored by Network Device Monitoring, but still discovered by LLDP/CDP, and shown on the map from adjacent devices that are monitored by Network Device Monitoring.
- Hide N Unconnected Devices - Turned OFF by default.
- Toggling this on hides any devices that have no link connections. Devices can be unconnected for reasons such as improper configuration, or the device does not support LLDP/CDP.
Icon legend
SNMP devices are matched to a representative icon based on their device type in each device node, as defined in their device profiles.
| Icon | Description |
|---|---|
| Access Point | |
| Firewall | |
| Router | |
| Server | |
| Switch | |
| Device |
Investigating devices
In addition to providing an overview of your network’s physical connections, you can investigate individual devices to understand their connections, flows, and overall status. Hovering over a device displays its overall status and key metrics. You can also click on a device to see the following options:
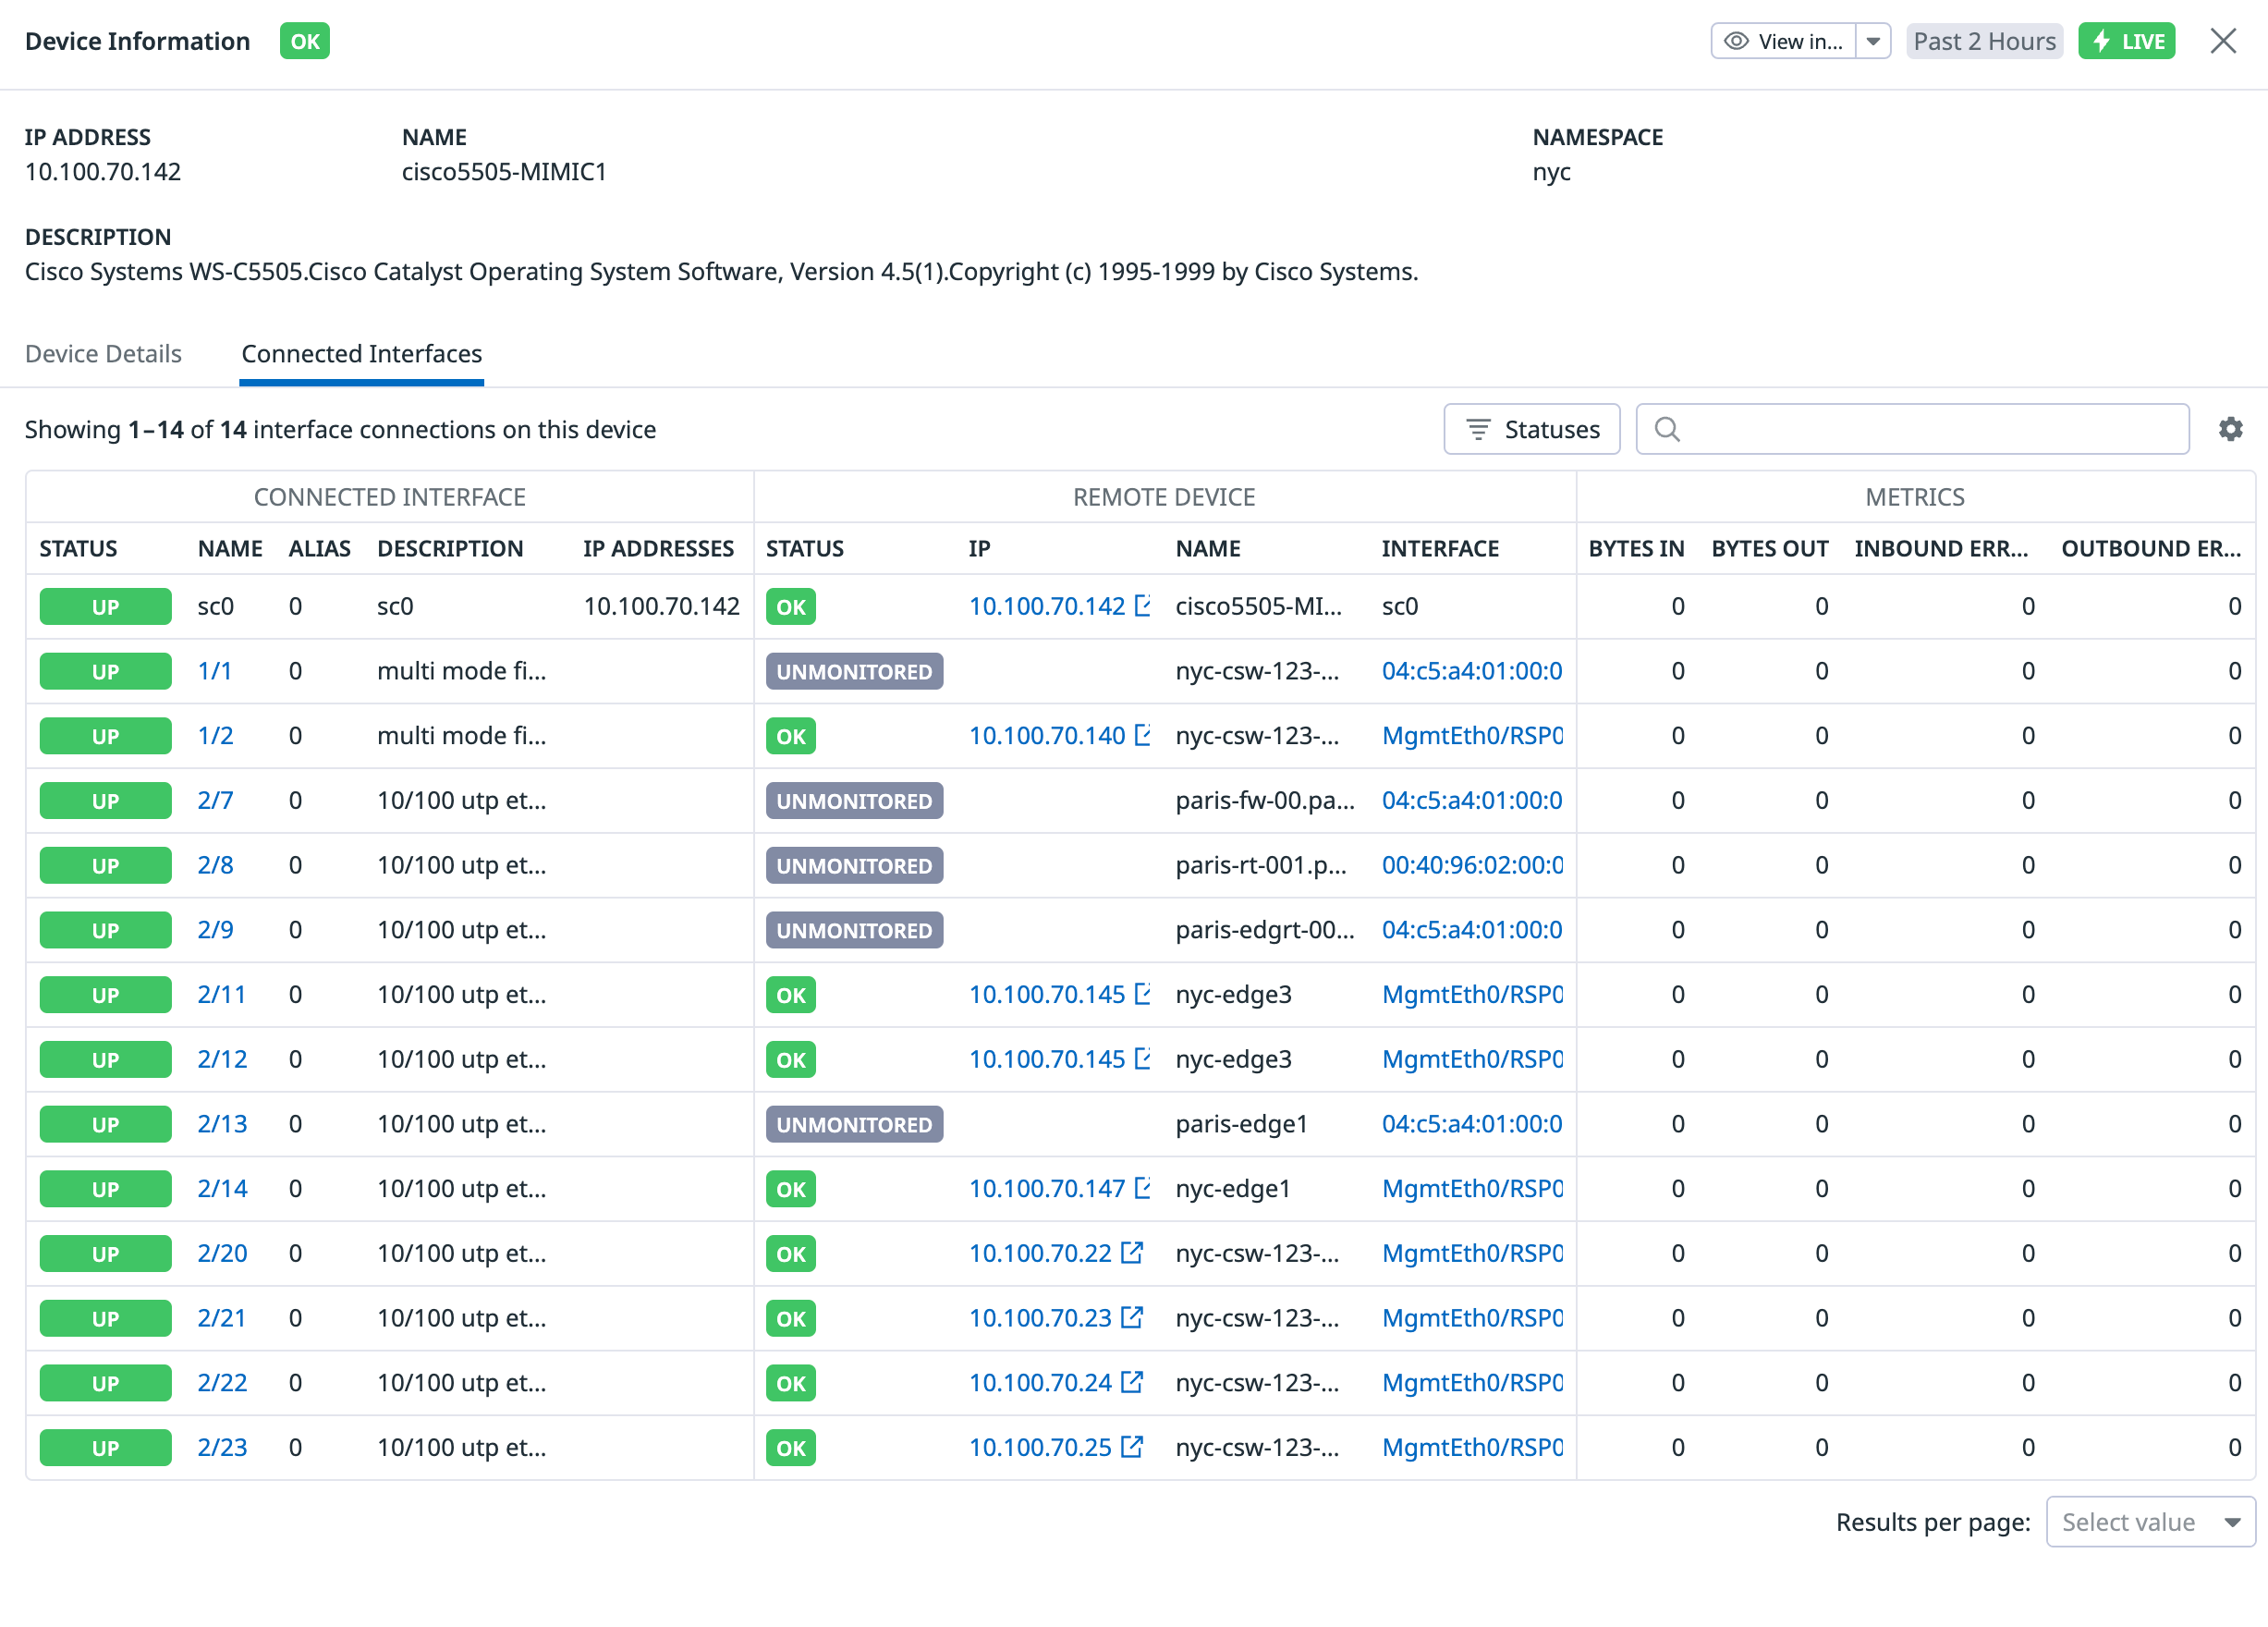
Inspect
Choose Inspect to see the device’s interface connections. Click on any of the connected interfaces for further investigation. This view shows only the physical interfaces that are actually connected to another device. This means that it shows a subset of the total set of interfaces of a network device.
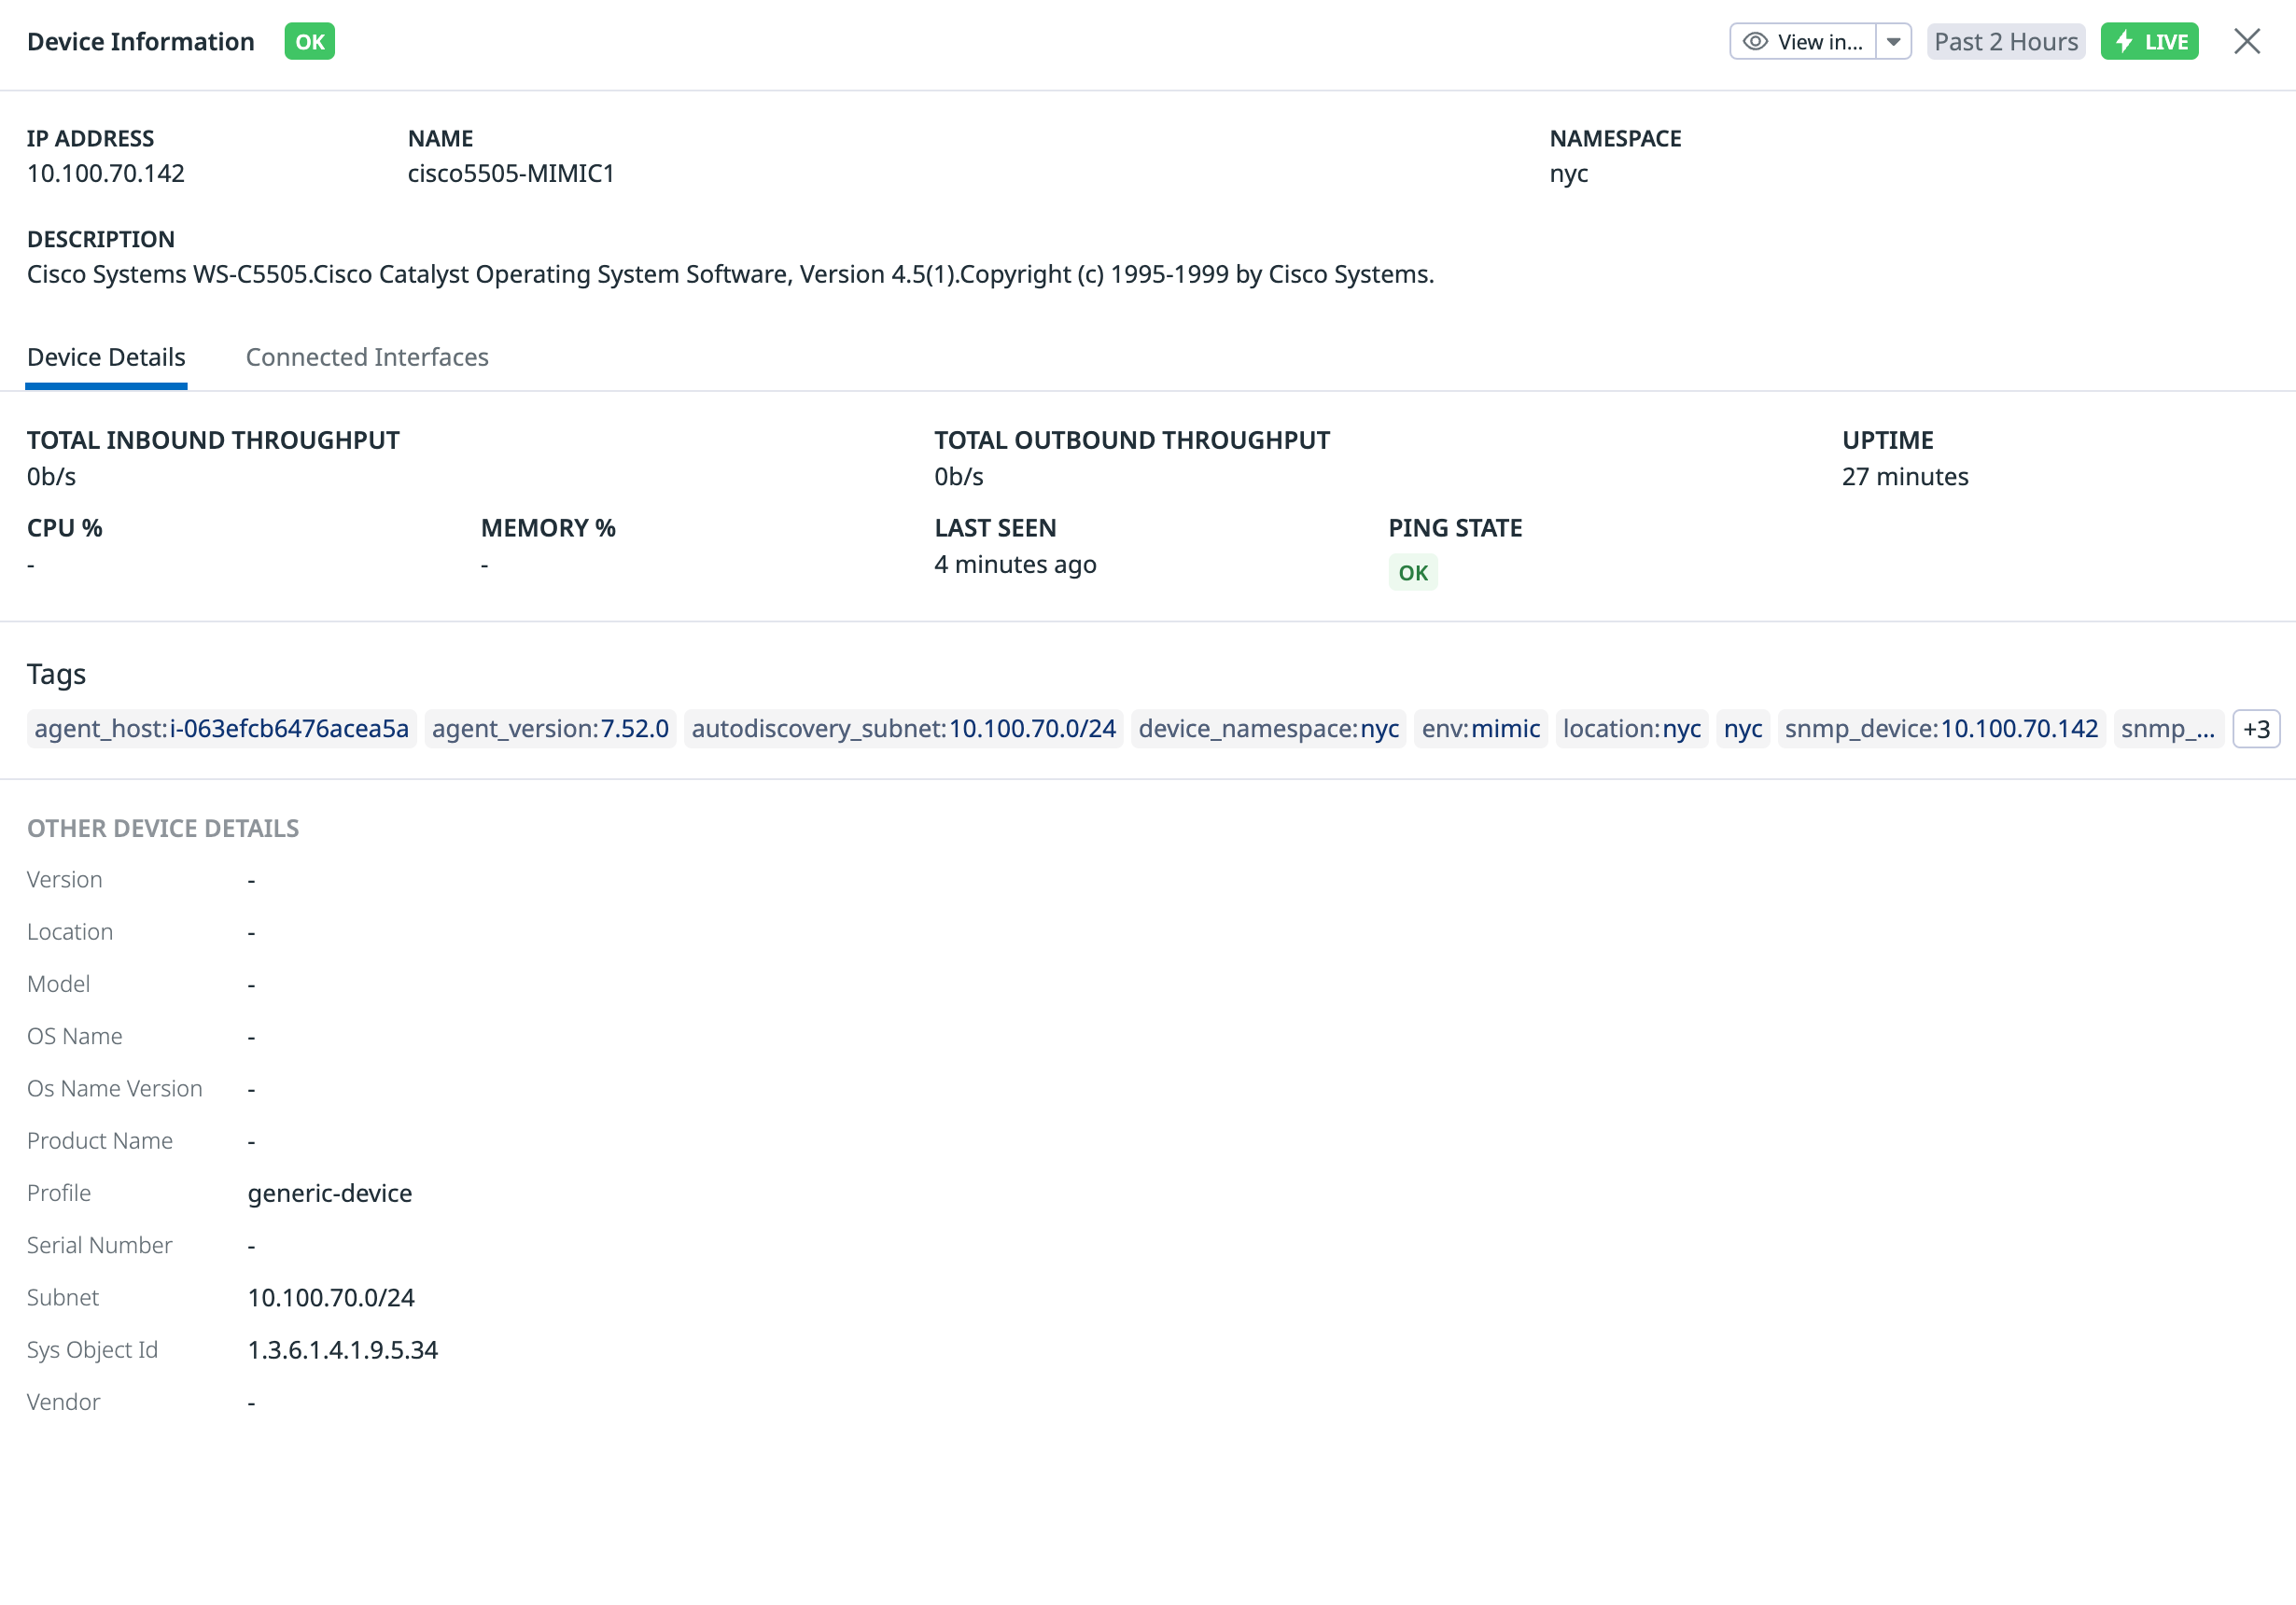
View device details
Choose View device details to see information such as the device’s IP address and tags, as well as data related to throughput, CPU, and memory.
From this view, you can also view the device’s connected interfaces in the Connected Interfaces tab.
View flow details
Choose View flow details to open the NetFlow tab filtered by the device’s @device.ip for a detailed exploration of the device’s sources, destinations, and volume. See the NetFlow Monitoring page for more information.
Troubleshooting
If you experience issues using the Network Topology Map, use the following troubleshooting guidelines. If you need further assistance, contact Datadog support.
Missing topology data message box
This message is displayed when the rendered map has no links.
Note: Since the “Hide N Unconnected Devices” toggle is enabled by default, this message displays with an empty map.
Empty map message
There are no devices because NDM is not configured.
No connections found / No connected devices to show
- Turn the “Hide N Unconnected Devices” toggle off to show the isolated devices.
- Use categorization tag to help understand your map view with information hierarchy.
Empty map/ no monitored devices
- Ensure the “Hide N Unconnected Devices” toggle is off.
Missing devices/connections
The Device Topology Map data is based on LLDP (Link Layer Discovery Protocol) and CDP (Cisco Discovery Protocol) information collected with SNMP. If your map is missing devices and/or connections, ensure the following:
- Datadog Agent version 7.52 or later is installed.
- Devices have LLDP and/or CDP enabled with SNMP.
Verify that your devices are exposing LLDP and CDP data with the following commands:
For LLDP data:
sudo -u dd-agent datadog-agent snmp walk <DEVICE_IP> 1.0.8802
For CDP data
sudo -u dd-agent datadog-agent snmp walk <DEVICE_IP> 1.3.6.1.4.1.9.9.23
Missing connections or links
If your device is exposing topology data with LLDP or CDP but some of the connections are missing, ensure that the “Hide N Unmonitored Devices” toggle is off. If you are using tags to filter nodes on the map, ensure the “Show one hop away on filter” toggle is on to see the connected nodes.
Un-monitored devices showing on map
The Device Topology Map shows all devices discovered with LLDP or CDP. These can be new devices that are not already monitored with SNMP or existing devices that were not resolved to the equivalent monitored device. You can use the “Hide N Unmonitored Devices” toggle to hide these nodes.
Device duplicated on map
The Device Topology Map shows all devices discovered with LLDP and/or CDP. In some cases, these devices are already monitored with SNMP but can not be resolved to the equivalent monitored device. In this case, the device is shown twice: one node representing the monitored device and one node representing the LLDP/CDP discovered device. Use the “Hide N Unmonitored Devices” toggle to hide the unmonitored nodes.
Borderless or black nodes on the map
The borderless or black nodes on the Device Topology Map can represent devices discovered with LLDP or CDP that are not configured to be monitored with NDM, or devices discovered with LLDP or CDP that can not be resolved to the equivalent monitored device.
Device resolution
The Device Topology Map provides an overview of the devices monitored with NDM and their physical connections. The topology links data is based on LLDP (Link Layer Discovery Protocol) or CDP (Cisco Discovery Protocol) information collected with SNMP. The connections discovered with LLDP or CDP can correspond to devices already monitored with SNMP. The device resolution consists in matching the discovered device to the monitored device.
Device resolution failures
The device resolution can fail if the device is not monitored with NDM, or the LLDP or CDP data is insufficient to match the discovered device to the monitored device.
Further Reading
Additional helpful documentation, links, and articles:


