- Essentials
- Getting Started
- Datadog
- Datadog Site
- DevSecOps
- Serverless for AWS Lambda
- Agent
- Integrations
- Containers
- Dashboards
- Monitors
- Logs
- APM Tracing
- Profiler
- Tags
- API
- Service Catalog
- Session Replay
- Continuous Testing
- Synthetic Monitoring
- Incident Management
- Database Monitoring
- Cloud Security Management
- Cloud SIEM
- Application Security Management
- Workflow Automation
- CI Visibility
- Test Visibility
- Test Impact Analysis
- Code Analysis
- Learning Center
- Support
- Glossary
- Standard Attributes
- Guides
- Agent
- Integrations
- OpenTelemetry
- Developers
- Authorization
- DogStatsD
- Custom Checks
- Integrations
- Create an Agent-based Integration
- Create an API Integration
- Create a Log Pipeline
- Integration Assets Reference
- Build a Marketplace Offering
- Create a Tile
- Create an Integration Dashboard
- Create a Recommended Monitor
- Create a Cloud SIEM Detection Rule
- OAuth for Integrations
- Install Agent Integration Developer Tool
- Service Checks
- IDE Plugins
- Community
- Guides
- API
- Datadog Mobile App
- CoScreen
- Cloudcraft
- In The App
- Dashboards
- Notebooks
- DDSQL Editor
- Sheets
- Monitors and Alerting
- Infrastructure
- Metrics
- Watchdog
- Bits AI
- Service Catalog
- API Catalog
- Error Tracking
- Service Management
- Infrastructure
- Application Performance
- APM
- Continuous Profiler
- Database Monitoring
- Data Streams Monitoring
- Data Jobs Monitoring
- Digital Experience
- Real User Monitoring
- Product Analytics
- Synthetic Testing and Monitoring
- Continuous Testing
- Software Delivery
- CI Visibility
- CD Visibility
- Test Optimization
- Code Analysis
- Quality Gates
- DORA Metrics
- Security
- Security Overview
- Cloud SIEM
- Cloud Security Management
- Application Security Management
- AI Observability
- Log Management
- Observability Pipelines
- Log Management
- Administration
Session Replay Browser Developer Tools
Overview
Session Replay’s Browser Dev Tools are built-in debugging tools that can help you troubleshoot issues in your applications. You do not need to configure anything to use Browser Dev Tools.
Browser Dev Tools
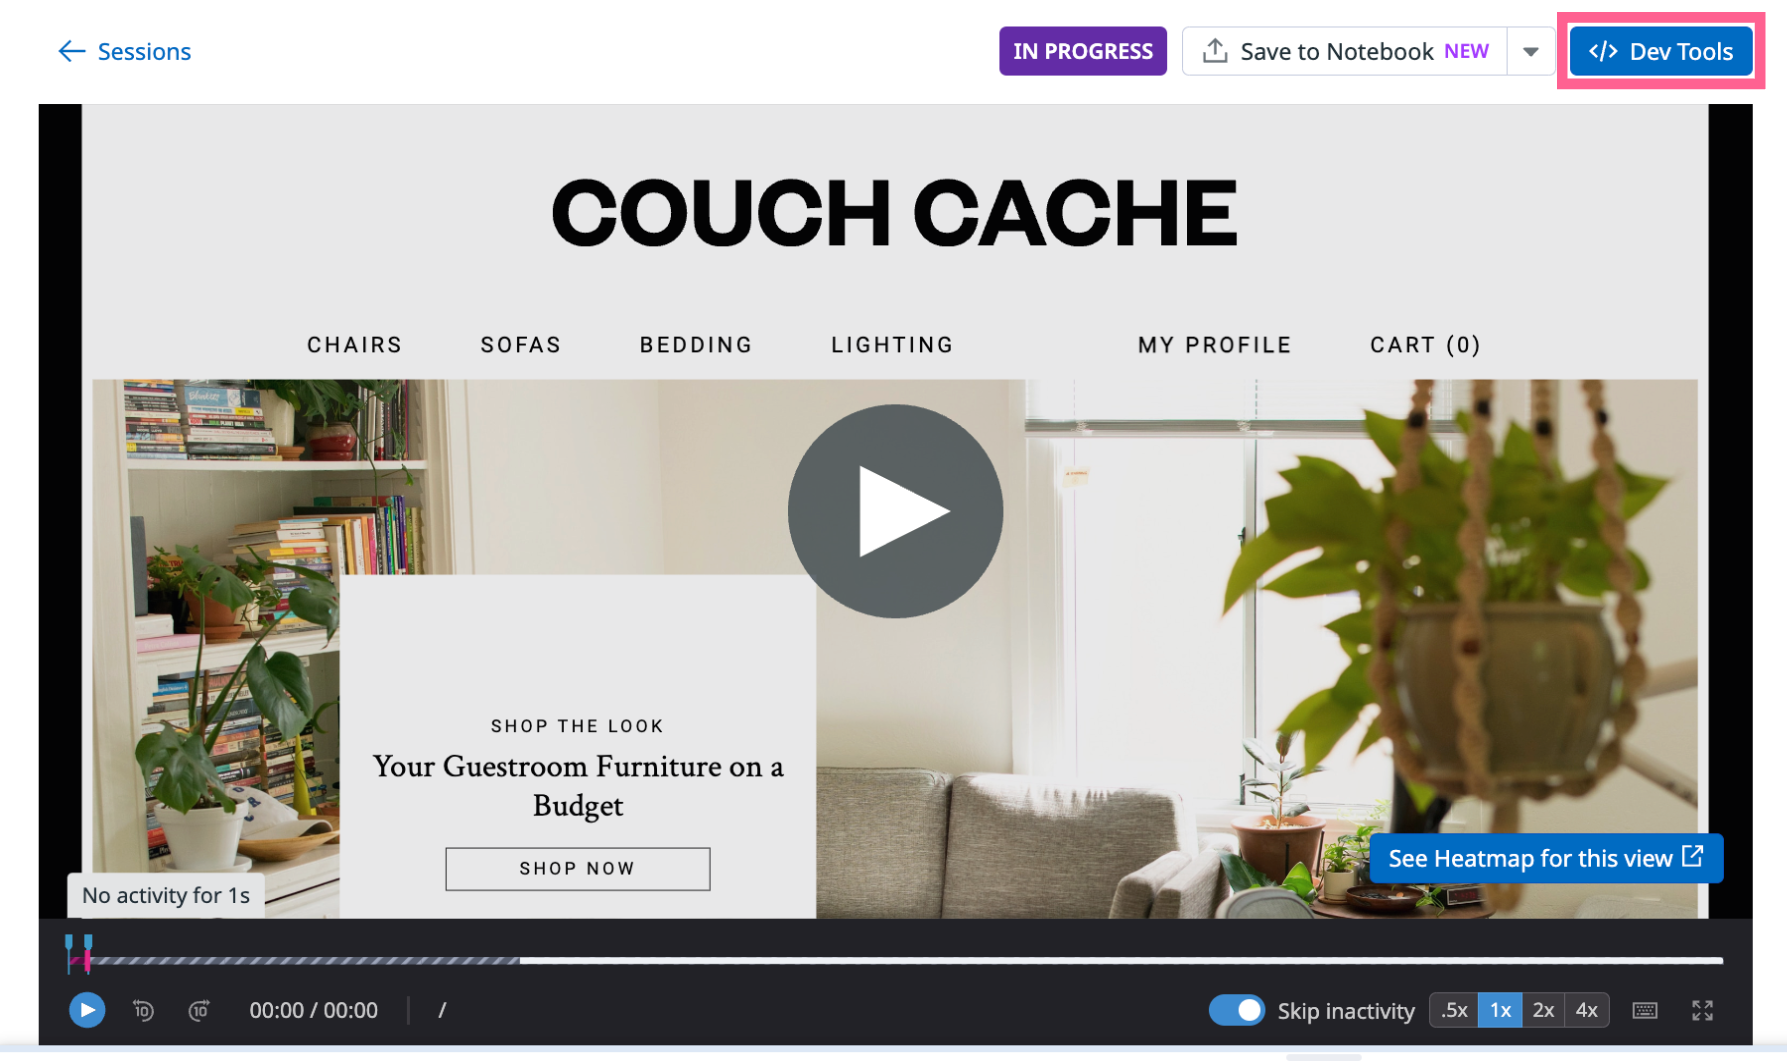
To access Browser Dev Tools, either click the Jump to Replay button to the left of a session in the Sessions tab or click on a session and click Replay Session on the top right corner in the RUM Explorer.
The </> Dev Tools button appears to the right of the Share button. You can view performance data, console logs, errors, and attributes about your replays.
Performance
The Performance tab displays a waterfall of events (such as actions, errors, resources, and long tasks) and timestamps in a session.
Select and apply filters such as Action Name and resource Type to change the scope of resources and event types displayed. You can also drag and drop the sliders in the waterfall to expand the time range.
Console
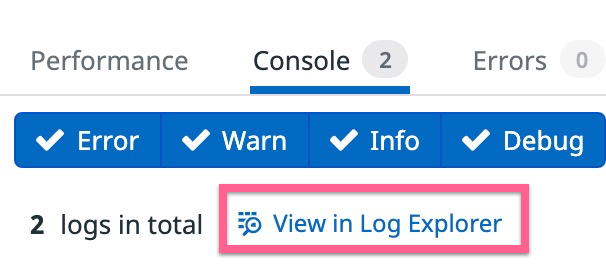
The Console tab displays all logs collected from the web browser and errors for each view.
Click Error, Warn, Info, and Debug to filter your logs based on severity. To search for these logs in the Log Explorer, click View in Log Explorer.
The Log Explorer opens in a separate tab with a pre-filled search query.
Errors
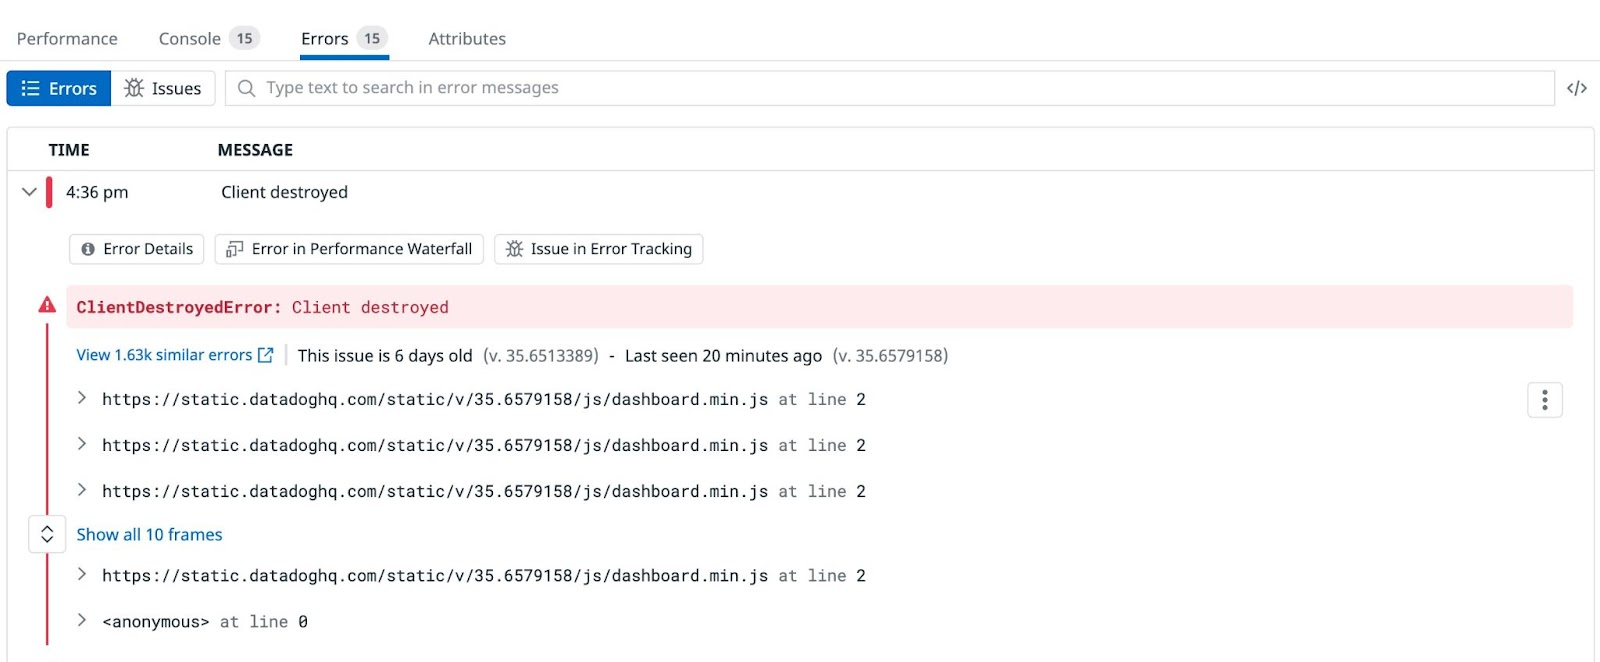
The Errors tab displays RUM errors and Error Tracking issues that correlate to the session.
Attributes
The Attributes tab displays all attributes related to the session. For more information, see Default attributes.
Further Reading
Additional helpful documentation, links, and articles:


