- Essentials
- Getting Started
- Datadog
- Datadog Site
- DevSecOps
- Serverless for AWS Lambda
- Agent
- Integrations
- Containers
- Dashboards
- Monitors
- Logs
- APM Tracing
- Profiler
- Tags
- API
- Service Catalog
- Session Replay
- Continuous Testing
- Synthetic Monitoring
- Incident Management
- Database Monitoring
- Cloud Security Management
- Cloud SIEM
- Application Security Management
- Workflow Automation
- CI Visibility
- Test Visibility
- Test Impact Analysis
- Code Analysis
- Learning Center
- Support
- Glossary
- Standard Attributes
- Guides
- Agent
- Integrations
- OpenTelemetry
- Developers
- Authorization
- DogStatsD
- Custom Checks
- Integrations
- Create an Agent-based Integration
- Create an API Integration
- Create a Log Pipeline
- Integration Assets Reference
- Build a Marketplace Offering
- Create a Tile
- Create an Integration Dashboard
- Create a Recommended Monitor
- Create a Cloud SIEM Detection Rule
- OAuth for Integrations
- Install Agent Integration Developer Tool
- Service Checks
- IDE Plugins
- Community
- Guides
- API
- Datadog Mobile App
- CoScreen
- Cloudcraft
- In The App
- Dashboards
- Notebooks
- DDSQL Editor
- Sheets
- Monitors and Alerting
- Infrastructure
- Metrics
- Watchdog
- Bits AI
- Service Catalog
- API Catalog
- Error Tracking
- Service Management
- Infrastructure
- Application Performance
- APM
- Continuous Profiler
- Database Monitoring
- Data Streams Monitoring
- Data Jobs Monitoring
- Digital Experience
- Real User Monitoring
- Product Analytics
- Synthetic Testing and Monitoring
- Continuous Testing
- Software Delivery
- CI Visibility
- CD Visibility
- Test Optimization
- Code Analysis
- Quality Gates
- DORA Metrics
- Security
- Security Overview
- Cloud SIEM
- Cloud Security Management
- Application Security Management
- AI Observability
- Log Management
- Observability Pipelines
- Log Management
- Administration
Frustration Signals
Overview
Frustration signals help you identify your application’s highest points of user friction by surfacing moments when users exhibit frustration.
RUM collects three types of frustration signals:
- Rage Clicks
- A user clicks on an element more than three times in a one-second sliding window.
- Dead Clicks
- A user clicks on a static element that produces no action on the page.
- Error Clicks
- A user clicks on an element right before a JavaScript error occurs.
By enabling frustration signals, Datadog collects all three signal types by default.
Requirements
First, you need the Browser RUM SDK version >= 4.14.0.
To start collecting frustration signals, add the following to your SDK configuration:
Latest version
window.DD_RUM.init({
  trackUserInteractions: true,
})
Before v5.0.0
window.DD_RUM.init({
  trackUserInteractions: true,
  trackFrustrations: true
})
Frustration signals require actions. Enabling trackFrustrations automatically enables trackUserInteractions.
Usage
Frustration signals appear as high-level data points representing sources of user frustration on the RUM Applications page. To display a list of frustration counts in the RUM Explorer, click the Options button and add a column for @session.frustration.count.
Application list
Hover over the list of browser sessions and click on a session to observe a user’s frustrated click behavior. Or, click Frustrated Sessions to access sessions with a frustration signal.
Explore the frustration signals dashboard
The Frustration Signals dashboard provides an overview of frustration levels across your application, showing you topics like the most frustrated users and pages with the highest number of frustration signals.
You can clone this dashboard and customize it to fit your needs. For more information, see Frustration Signals Dashboard.
Search for frustration signals
Search through all the data collected by RUM in the RUM Explorer to surface trends on frustration signals, analyze patterns with greater context, or export them into dashboards and monitors.
Enter a facet in the search query to start your search. Available search fields include:
- Frustration Type
- Find actions with frustration signals. For example, if you want to see any actions that had a rage click, add
action.frustration.type:rage_clickto the search query. - Frustration Count
- Find sessions and views where any frustration signal occurred. For example, if you want to find any user sessions or views with at least one frustration signal, add
session.frustration.count:>1orview.frustration.count:>1to the search query.
Sessions
Click on a session with a value in the Frustration Count column to examine the user frustration detected. You can see the type of signal (rage click, dead click, or error click) and the event timeline, which shows what occurred during the session.
Views
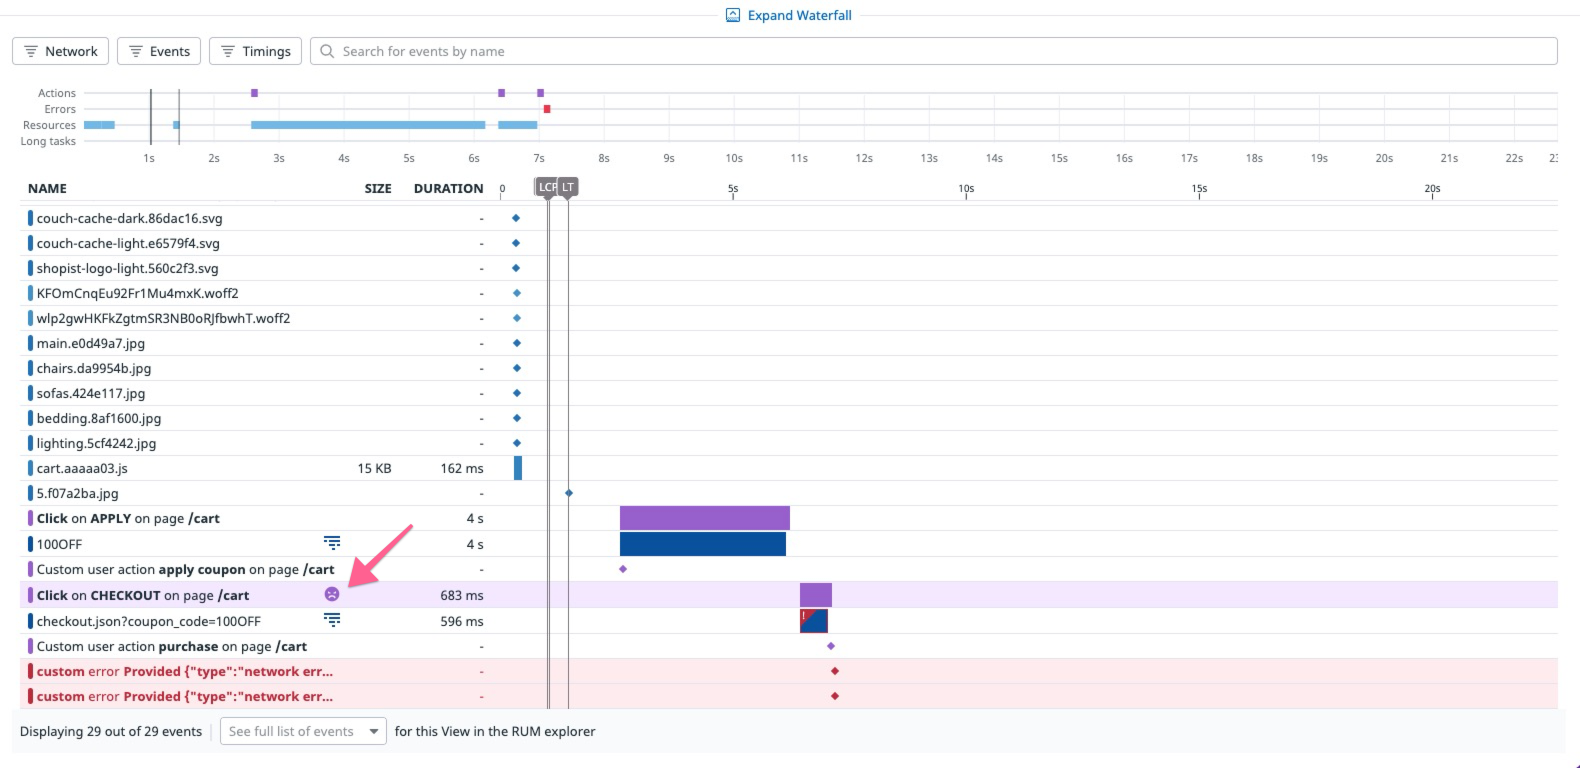
Click on a view to identify if a user was frustrated on a specific page with the frustration detected tag.
The performance waterfall displays actions containing frustration signals.
Actions
The Actions tab displays the frustration detected tag if the selected action contains a frustration signal.
If multiple frustration signals occur in an action, they are displayed under What Happened in the action panel.
Errors
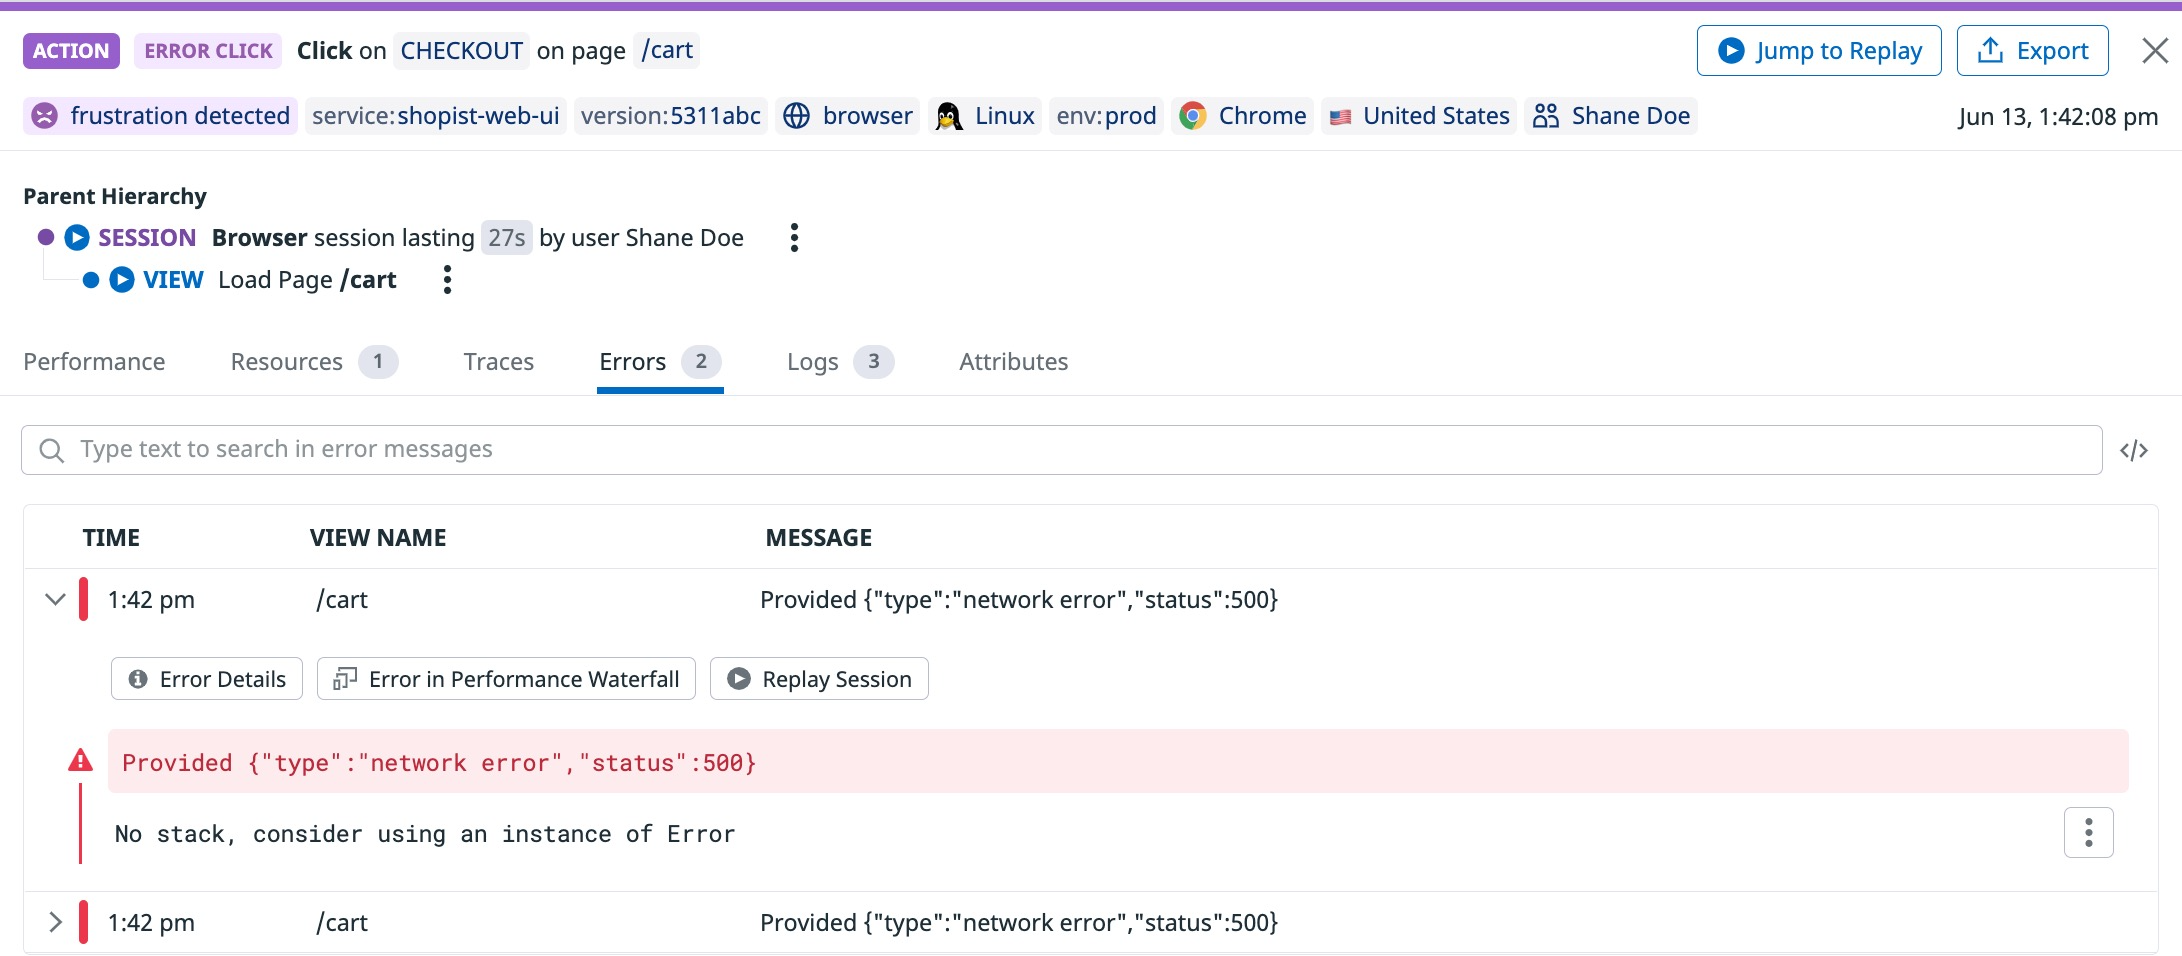
Click on an error in the Errors tab to open a side panel with error details. You can see if a frustration signal occurred.
Watch frustration signals in Session Replay
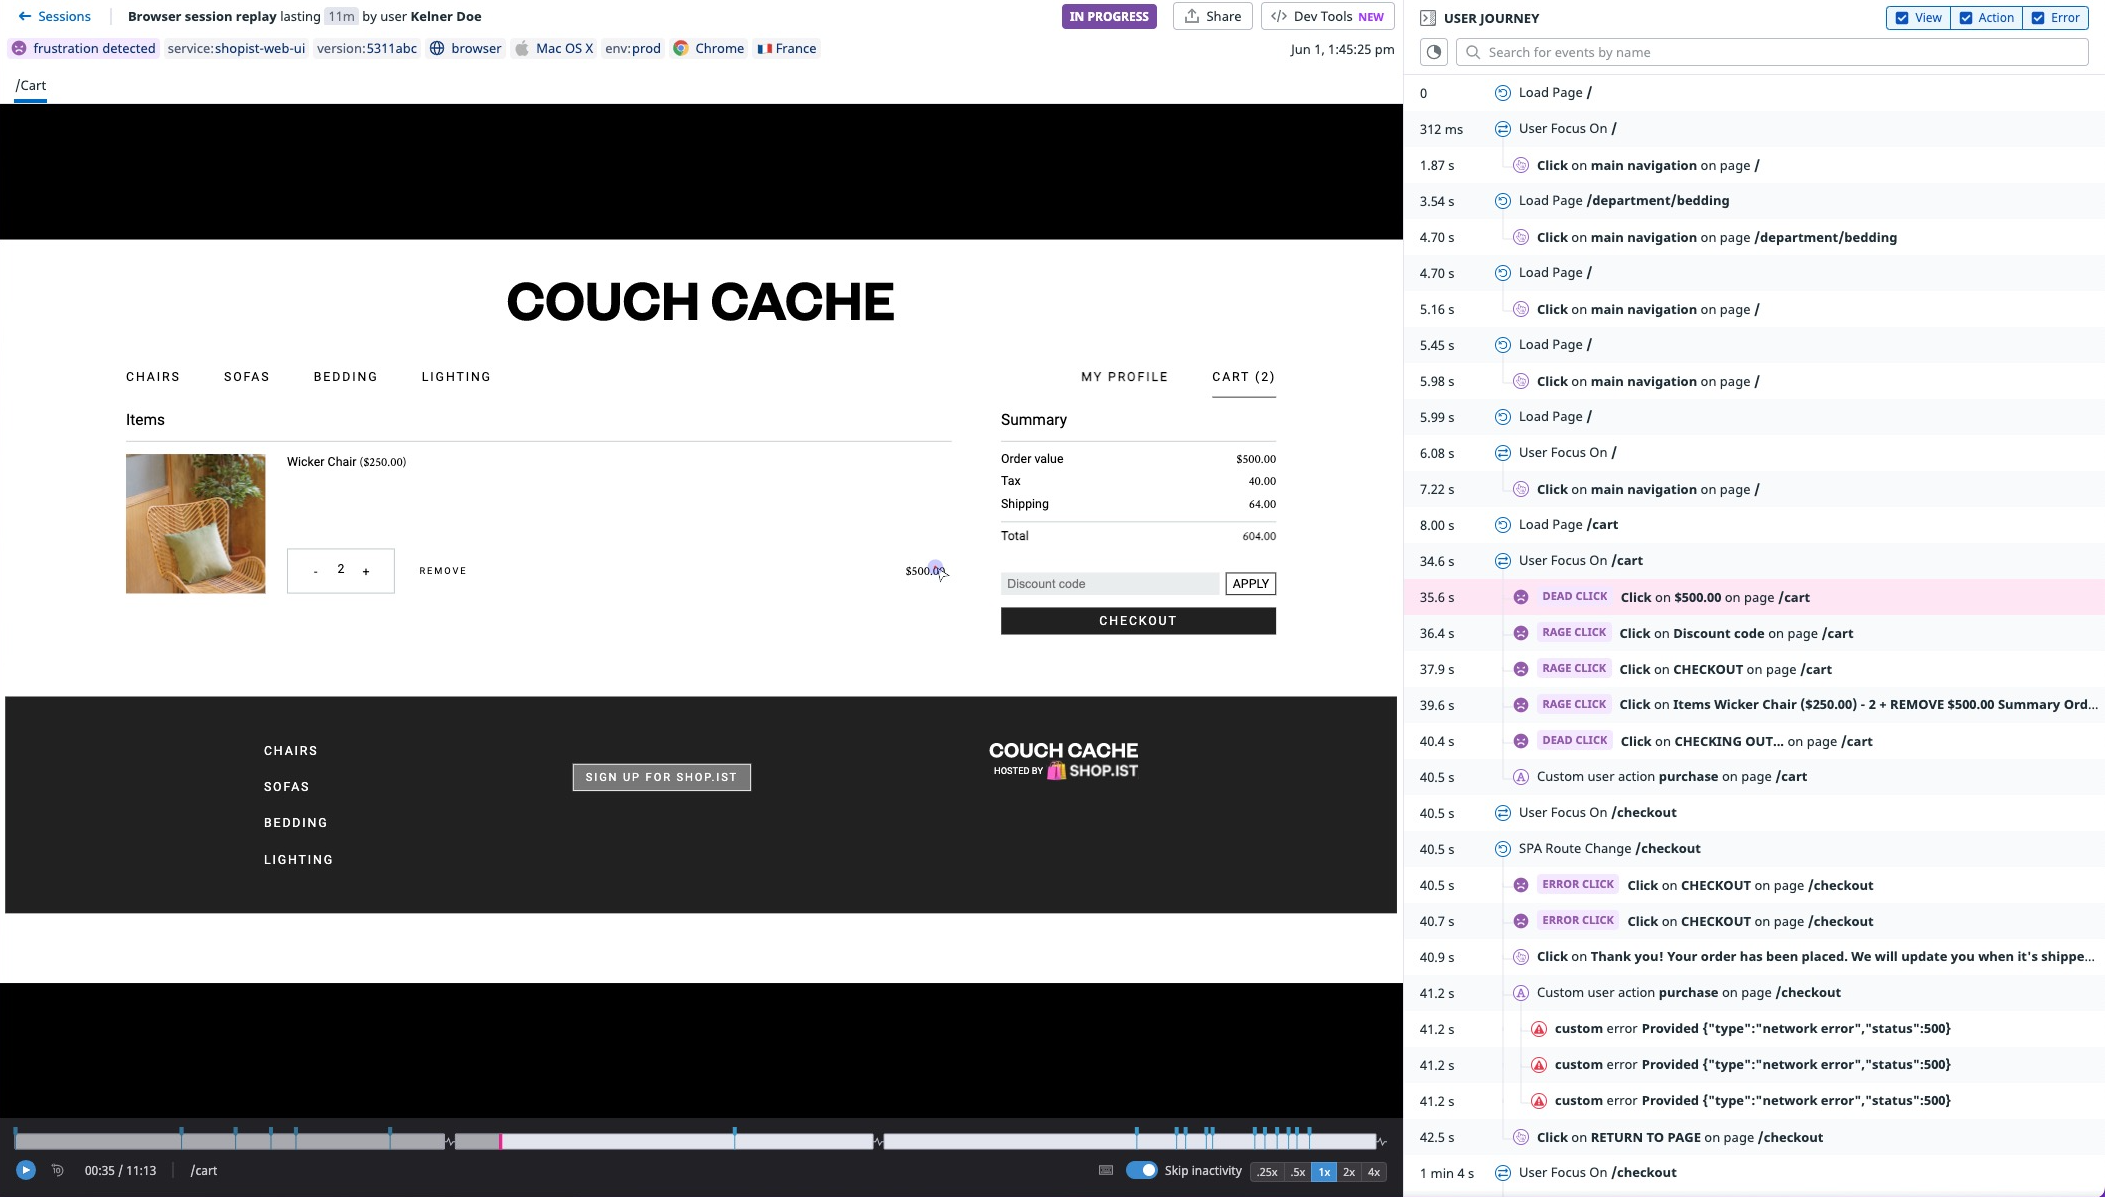
In Session Replay, you can observe a video-like replication of real user activity. Replays provide video evidence of the actions users take when they exhibit signs of frustration.
A session replay’s user journey details the events that occur in chronological order. Hover over an event to move to that point in time in the replay: for example, when a dead click occurred.
For more information, see the Session Replay documentation.
Create alerts for frustration signals
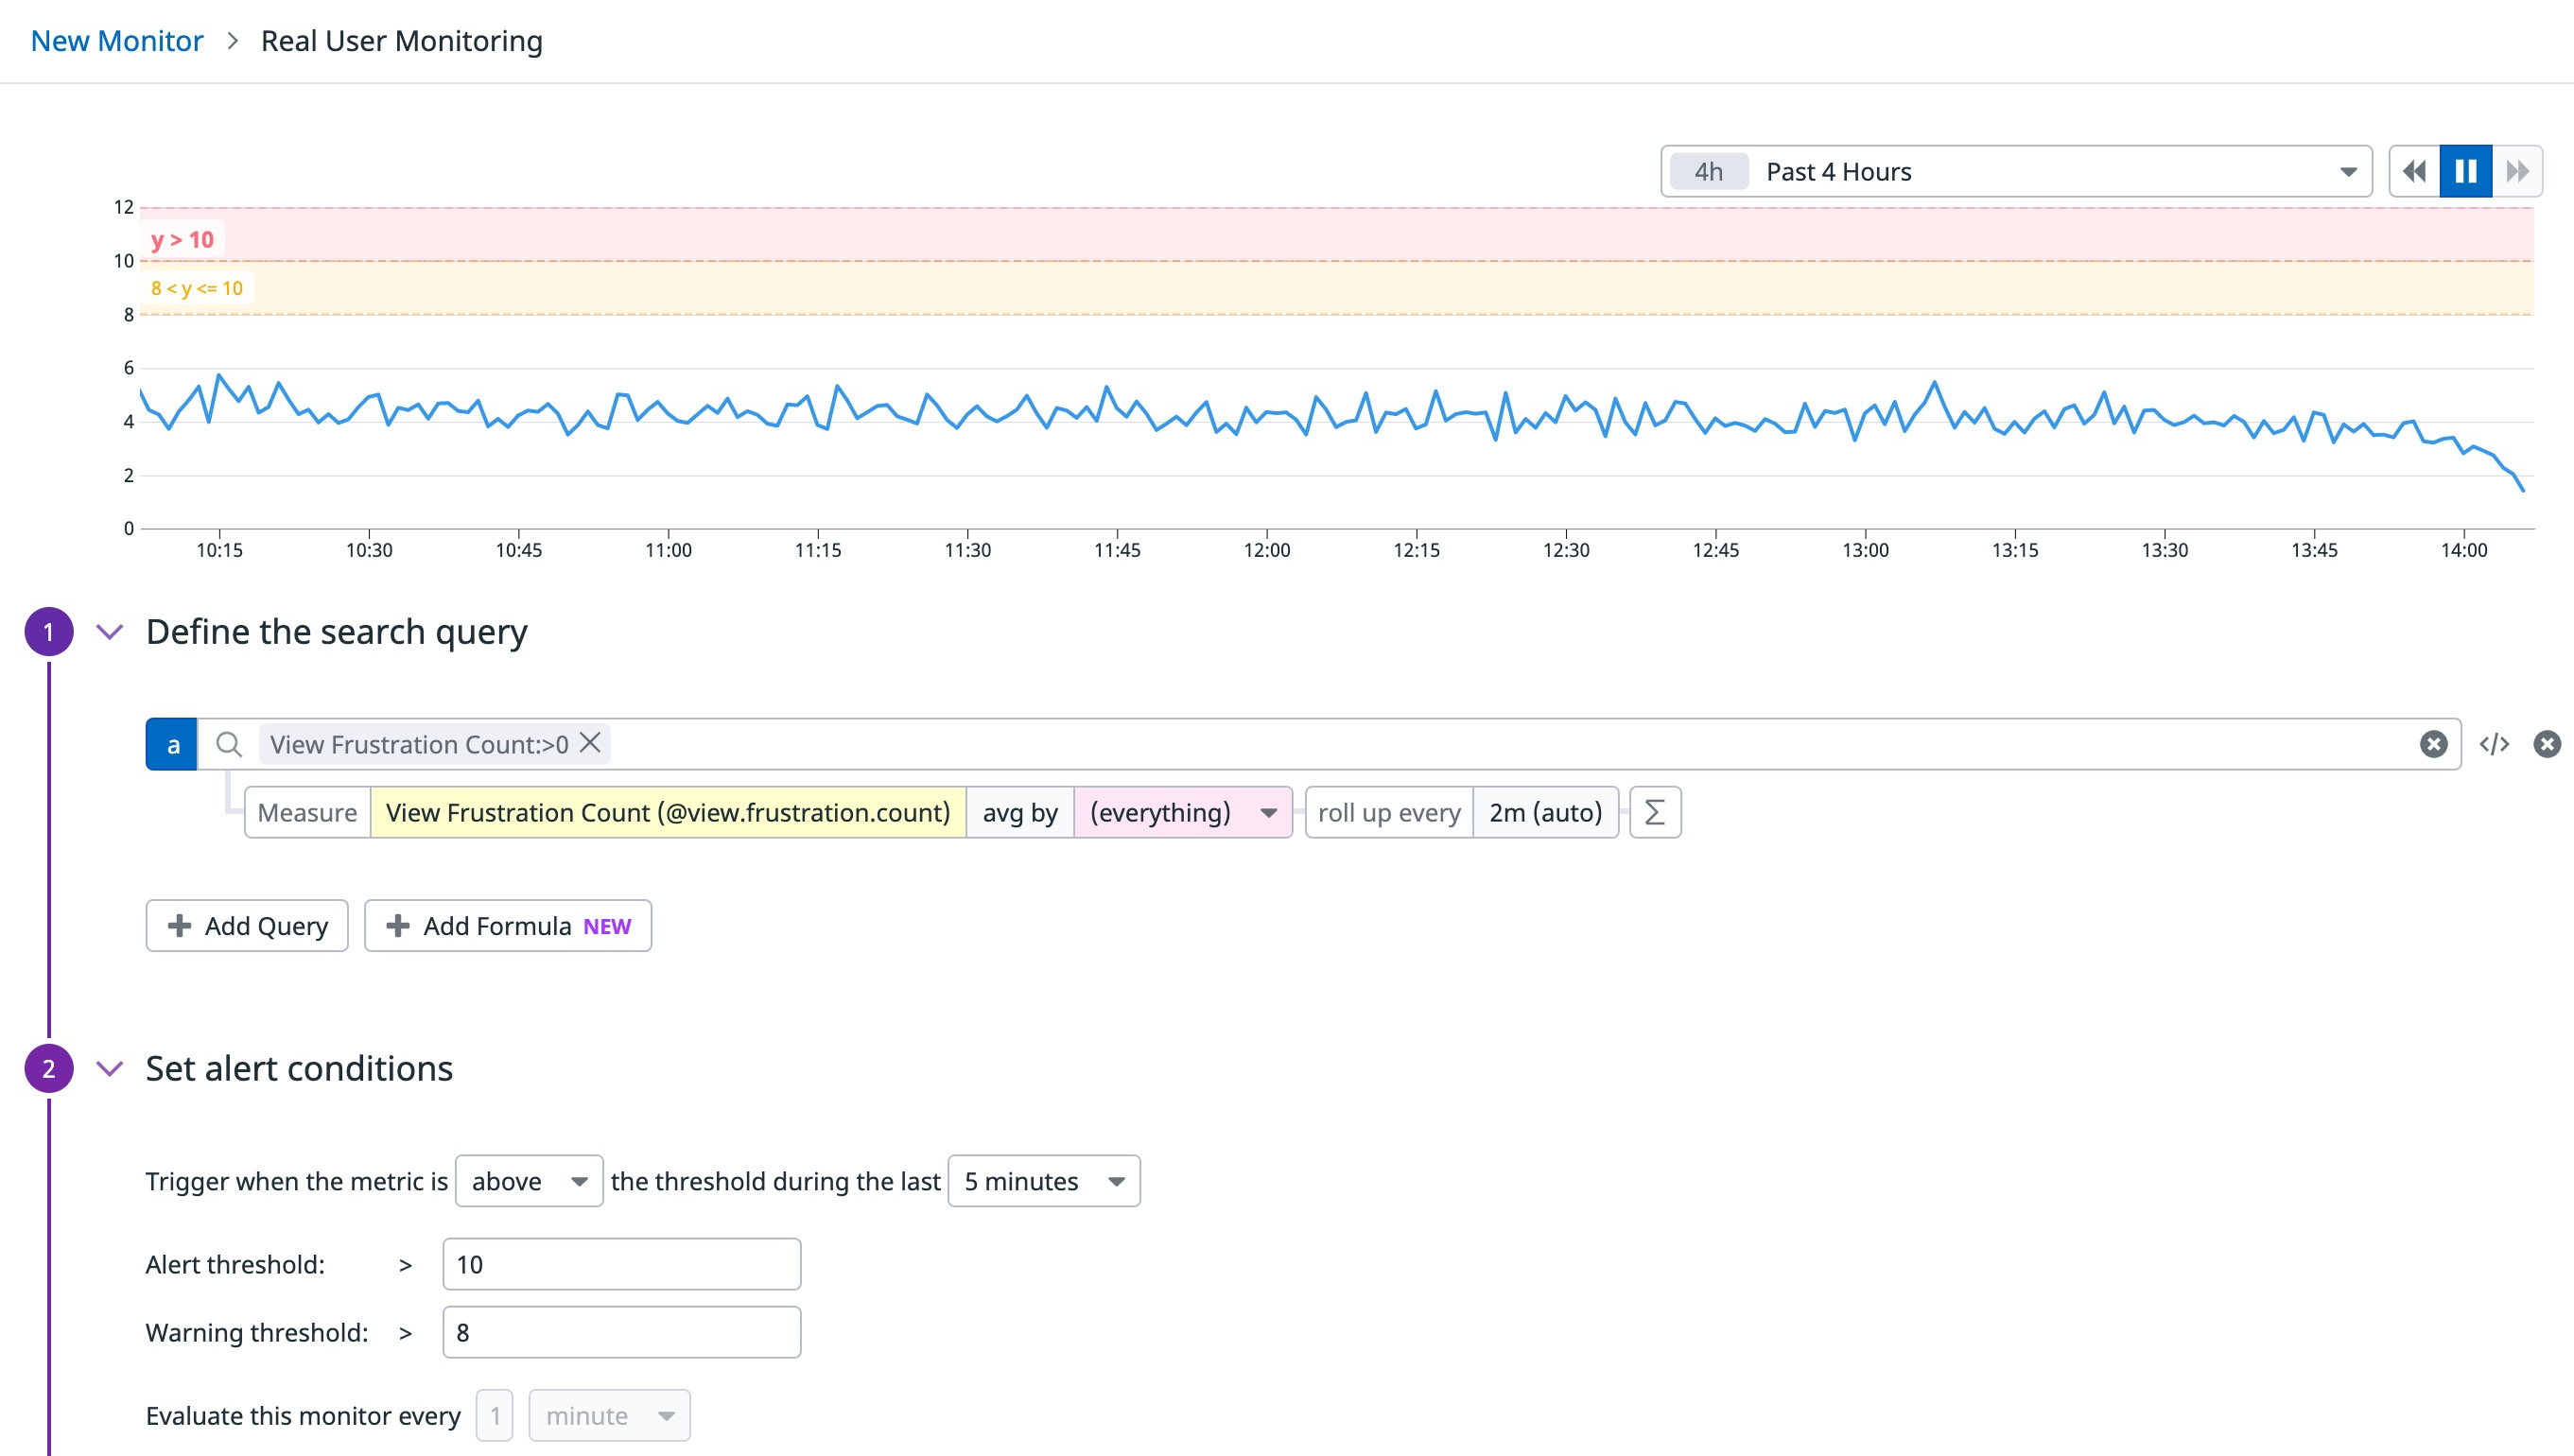
You can create monitors and set alerts on frustration signals to notify you or your team if any frustration signals occur on an important page in your application.
For example, to set an alert that notifies you if any frustration signals occur on a specific page:
For more information, see the Real User Monitoring Monitor documentation.
Troubleshooting
Rage clicks are not being created when a user presses a key (like Delete) on the keyboard
Frustration signals are generated from mouse clicks, not keyboard strokes.
The side panel does not show that a session has a different number of frustration signals than in the event timeline
If a session is live, it is fetching information and may cause the banners to reflect a different number than those in the timeline.
To provide feedback or submit a feature request, contact Datadog Support.
Further Reading
Additional helpful documentation, links, and articles:


