- Essentials
- Getting Started
- Datadog
- Datadog Site
- DevSecOps
- Serverless for AWS Lambda
- Agent
- Integrations
- Containers
- Dashboards
- Monitors
- Logs
- APM Tracing
- Profiler
- Tags
- API
- Service Catalog
- Session Replay
- Continuous Testing
- Synthetic Monitoring
- Incident Management
- Database Monitoring
- Cloud Security Management
- Cloud SIEM
- Application Security Management
- Workflow Automation
- CI Visibility
- Test Visibility
- Test Impact Analysis
- Code Analysis
- Learning Center
- Support
- Glossary
- Standard Attributes
- Guides
- Agent
- Integrations
- OpenTelemetry
- Developers
- Authorization
- DogStatsD
- Custom Checks
- Integrations
- Create an Agent-based Integration
- Create an API Integration
- Create a Log Pipeline
- Integration Assets Reference
- Build a Marketplace Offering
- Create a Tile
- Create an Integration Dashboard
- Create a Recommended Monitor
- Create a Cloud SIEM Detection Rule
- OAuth for Integrations
- Install Agent Integration Developer Tool
- Service Checks
- IDE Plugins
- Community
- Guides
- API
- Datadog Mobile App
- CoScreen
- Cloudcraft
- In The App
- Dashboards
- Notebooks
- DDSQL Editor
- Sheets
- Monitors and Alerting
- Infrastructure
- Metrics
- Watchdog
- Bits AI
- Service Catalog
- API Catalog
- Error Tracking
- Service Management
- Infrastructure
- Application Performance
- APM
- Continuous Profiler
- Database Monitoring
- Data Streams Monitoring
- Data Jobs Monitoring
- Digital Experience
- Real User Monitoring
- Product Analytics
- Synthetic Testing and Monitoring
- Continuous Testing
- Software Delivery
- CI Visibility
- CD Visibility
- Test Optimization
- Code Analysis
- Quality Gates
- DORA Metrics
- Security
- Security Overview
- Cloud SIEM
- Cloud Security Management
- Application Security Management
- AI Observability
- Log Management
- Observability Pipelines
- Log Management
- Administration
Group RUM Events
Overview
Real User Monitoring (RUM) events are valuable both individually and collectively. The search query contains information to aggregate a subset of events.
Your selection of fields to group, aggregate, and measure your events are preserved as you switch between visualization types.
Aggregate by fields
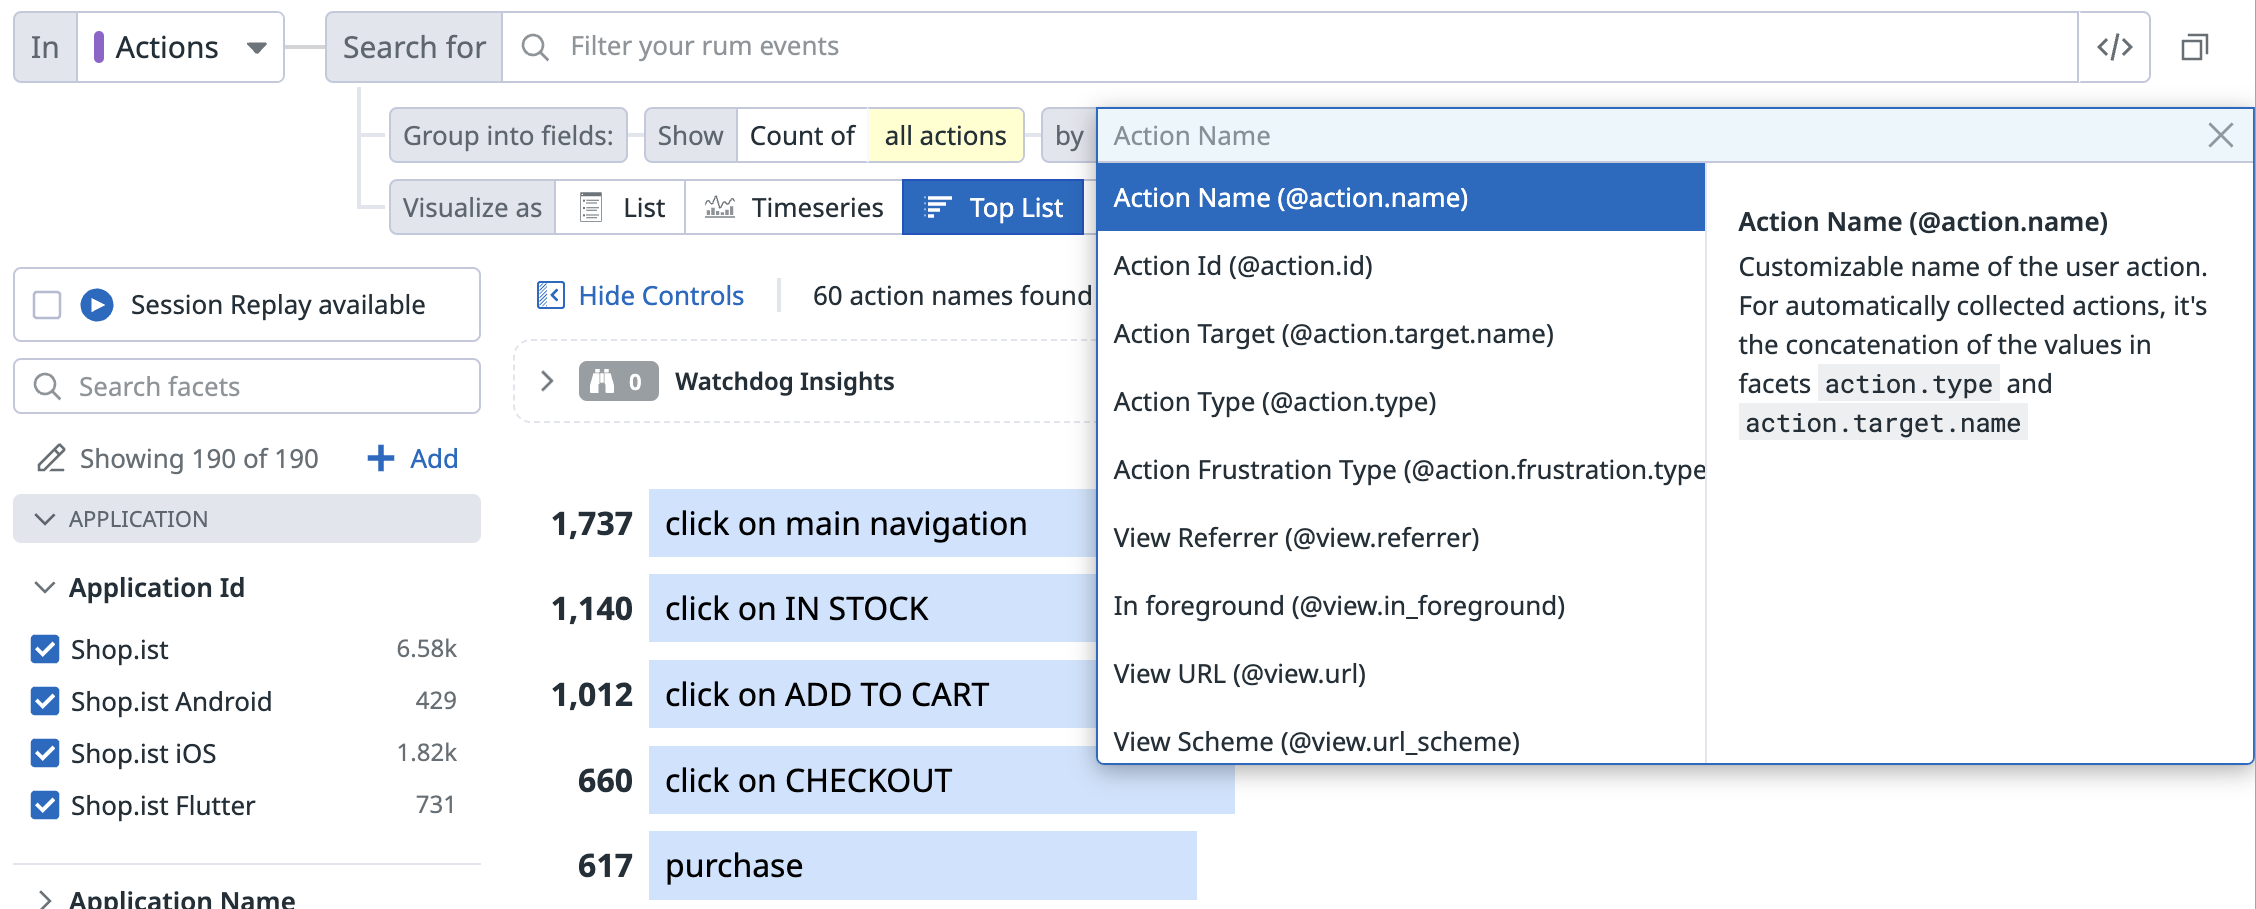
All RUM events that match your filter query are aggregated into groups based on the value of one or several event facets. You can extract the following measures in addition to the aggregates:
Count of events per group
Unique count of coded values for a facet per group
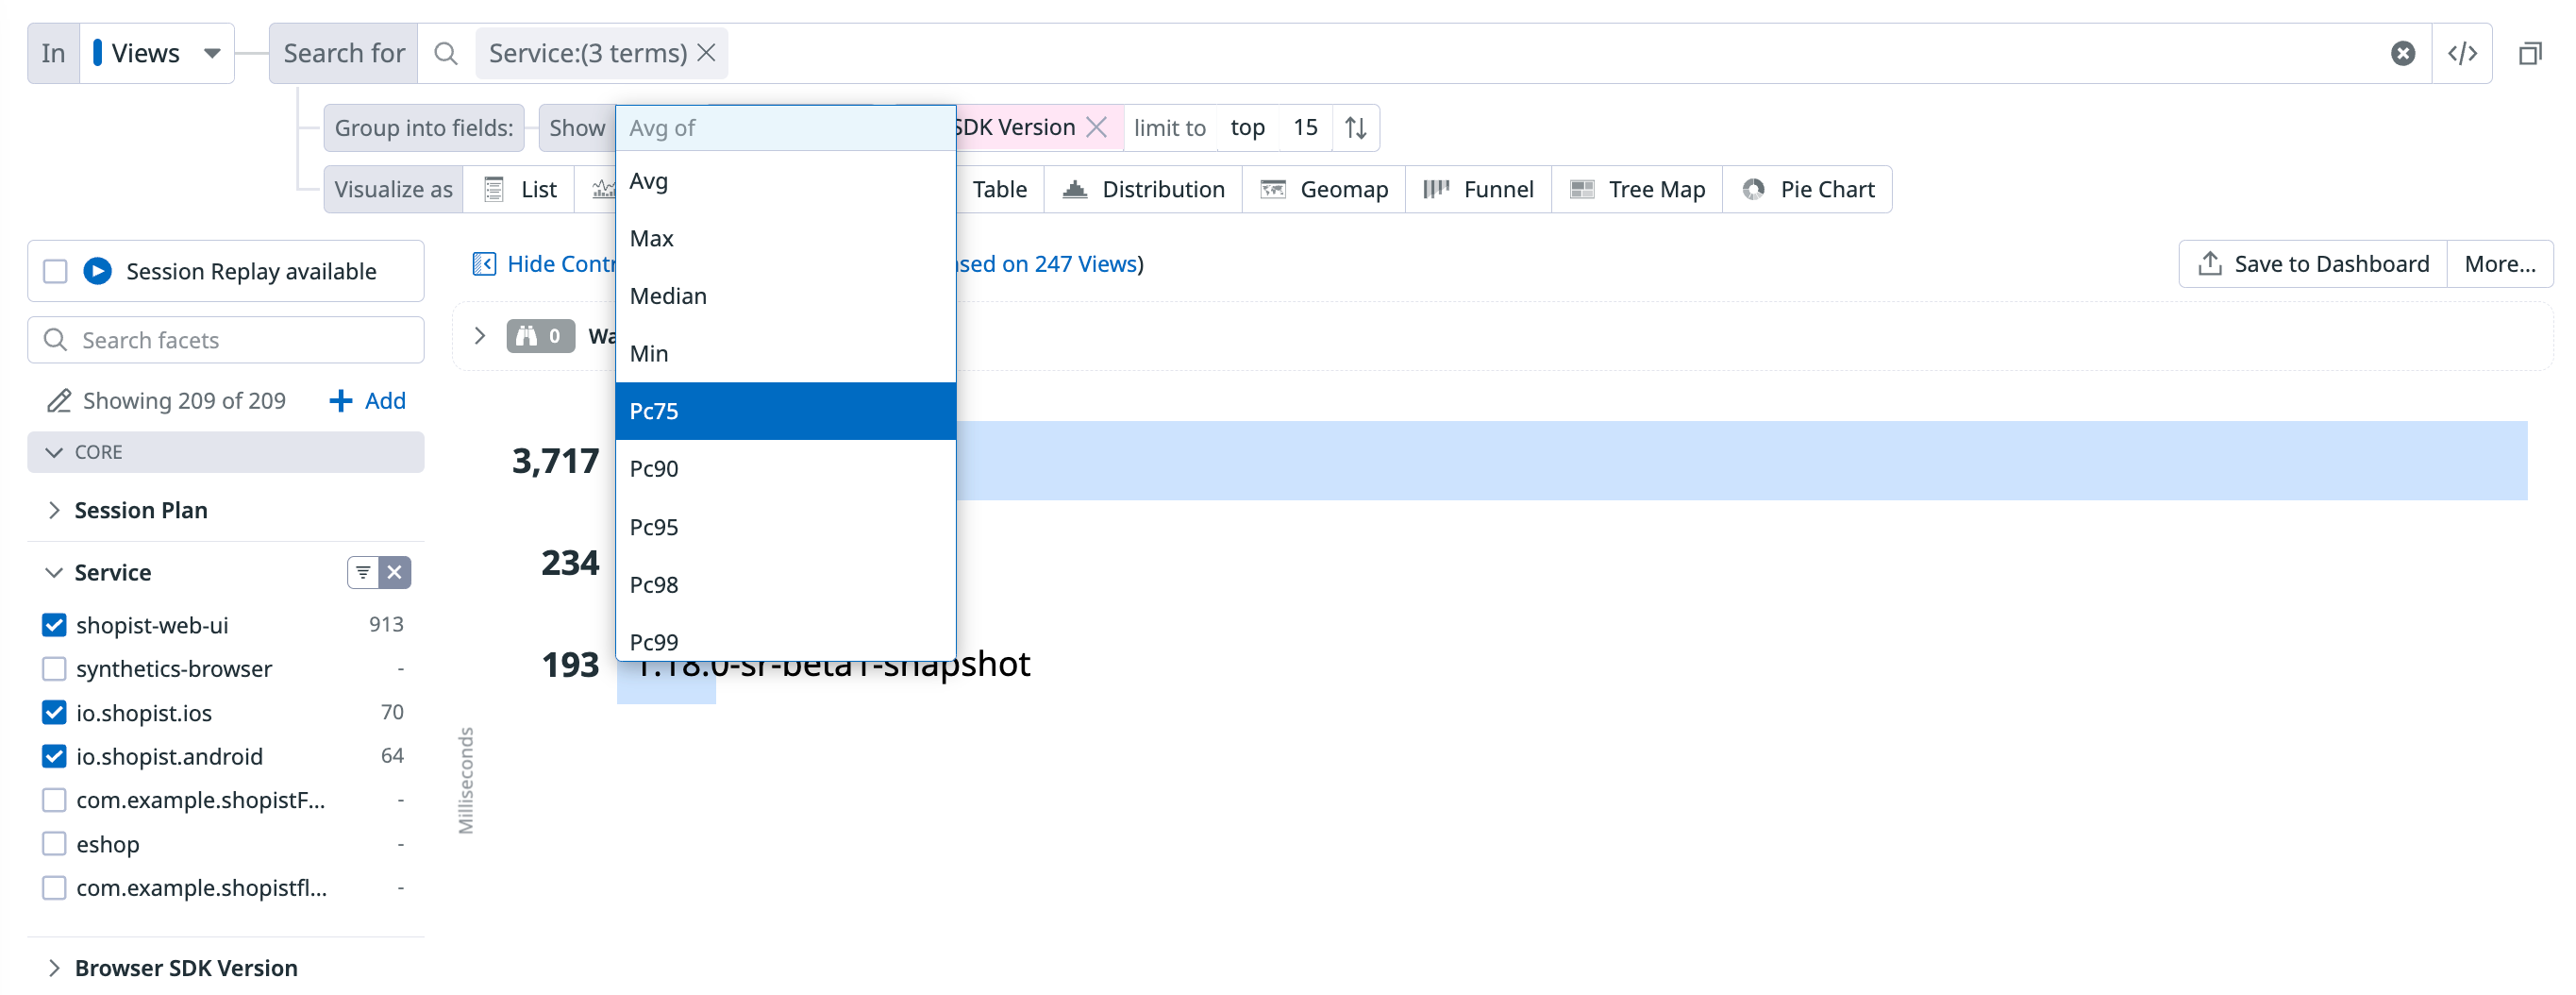
Statistical operations (such as minimum, maximum, average, and percentiles) on a facet’s numerical values per group
Individual events with multiple values for a single facet belong to that number of aggregates. For example, a RUM event with the country:france and browser:chrome attributes are counted once in the country:france aggregate and once in the browser:chrome aggregate.
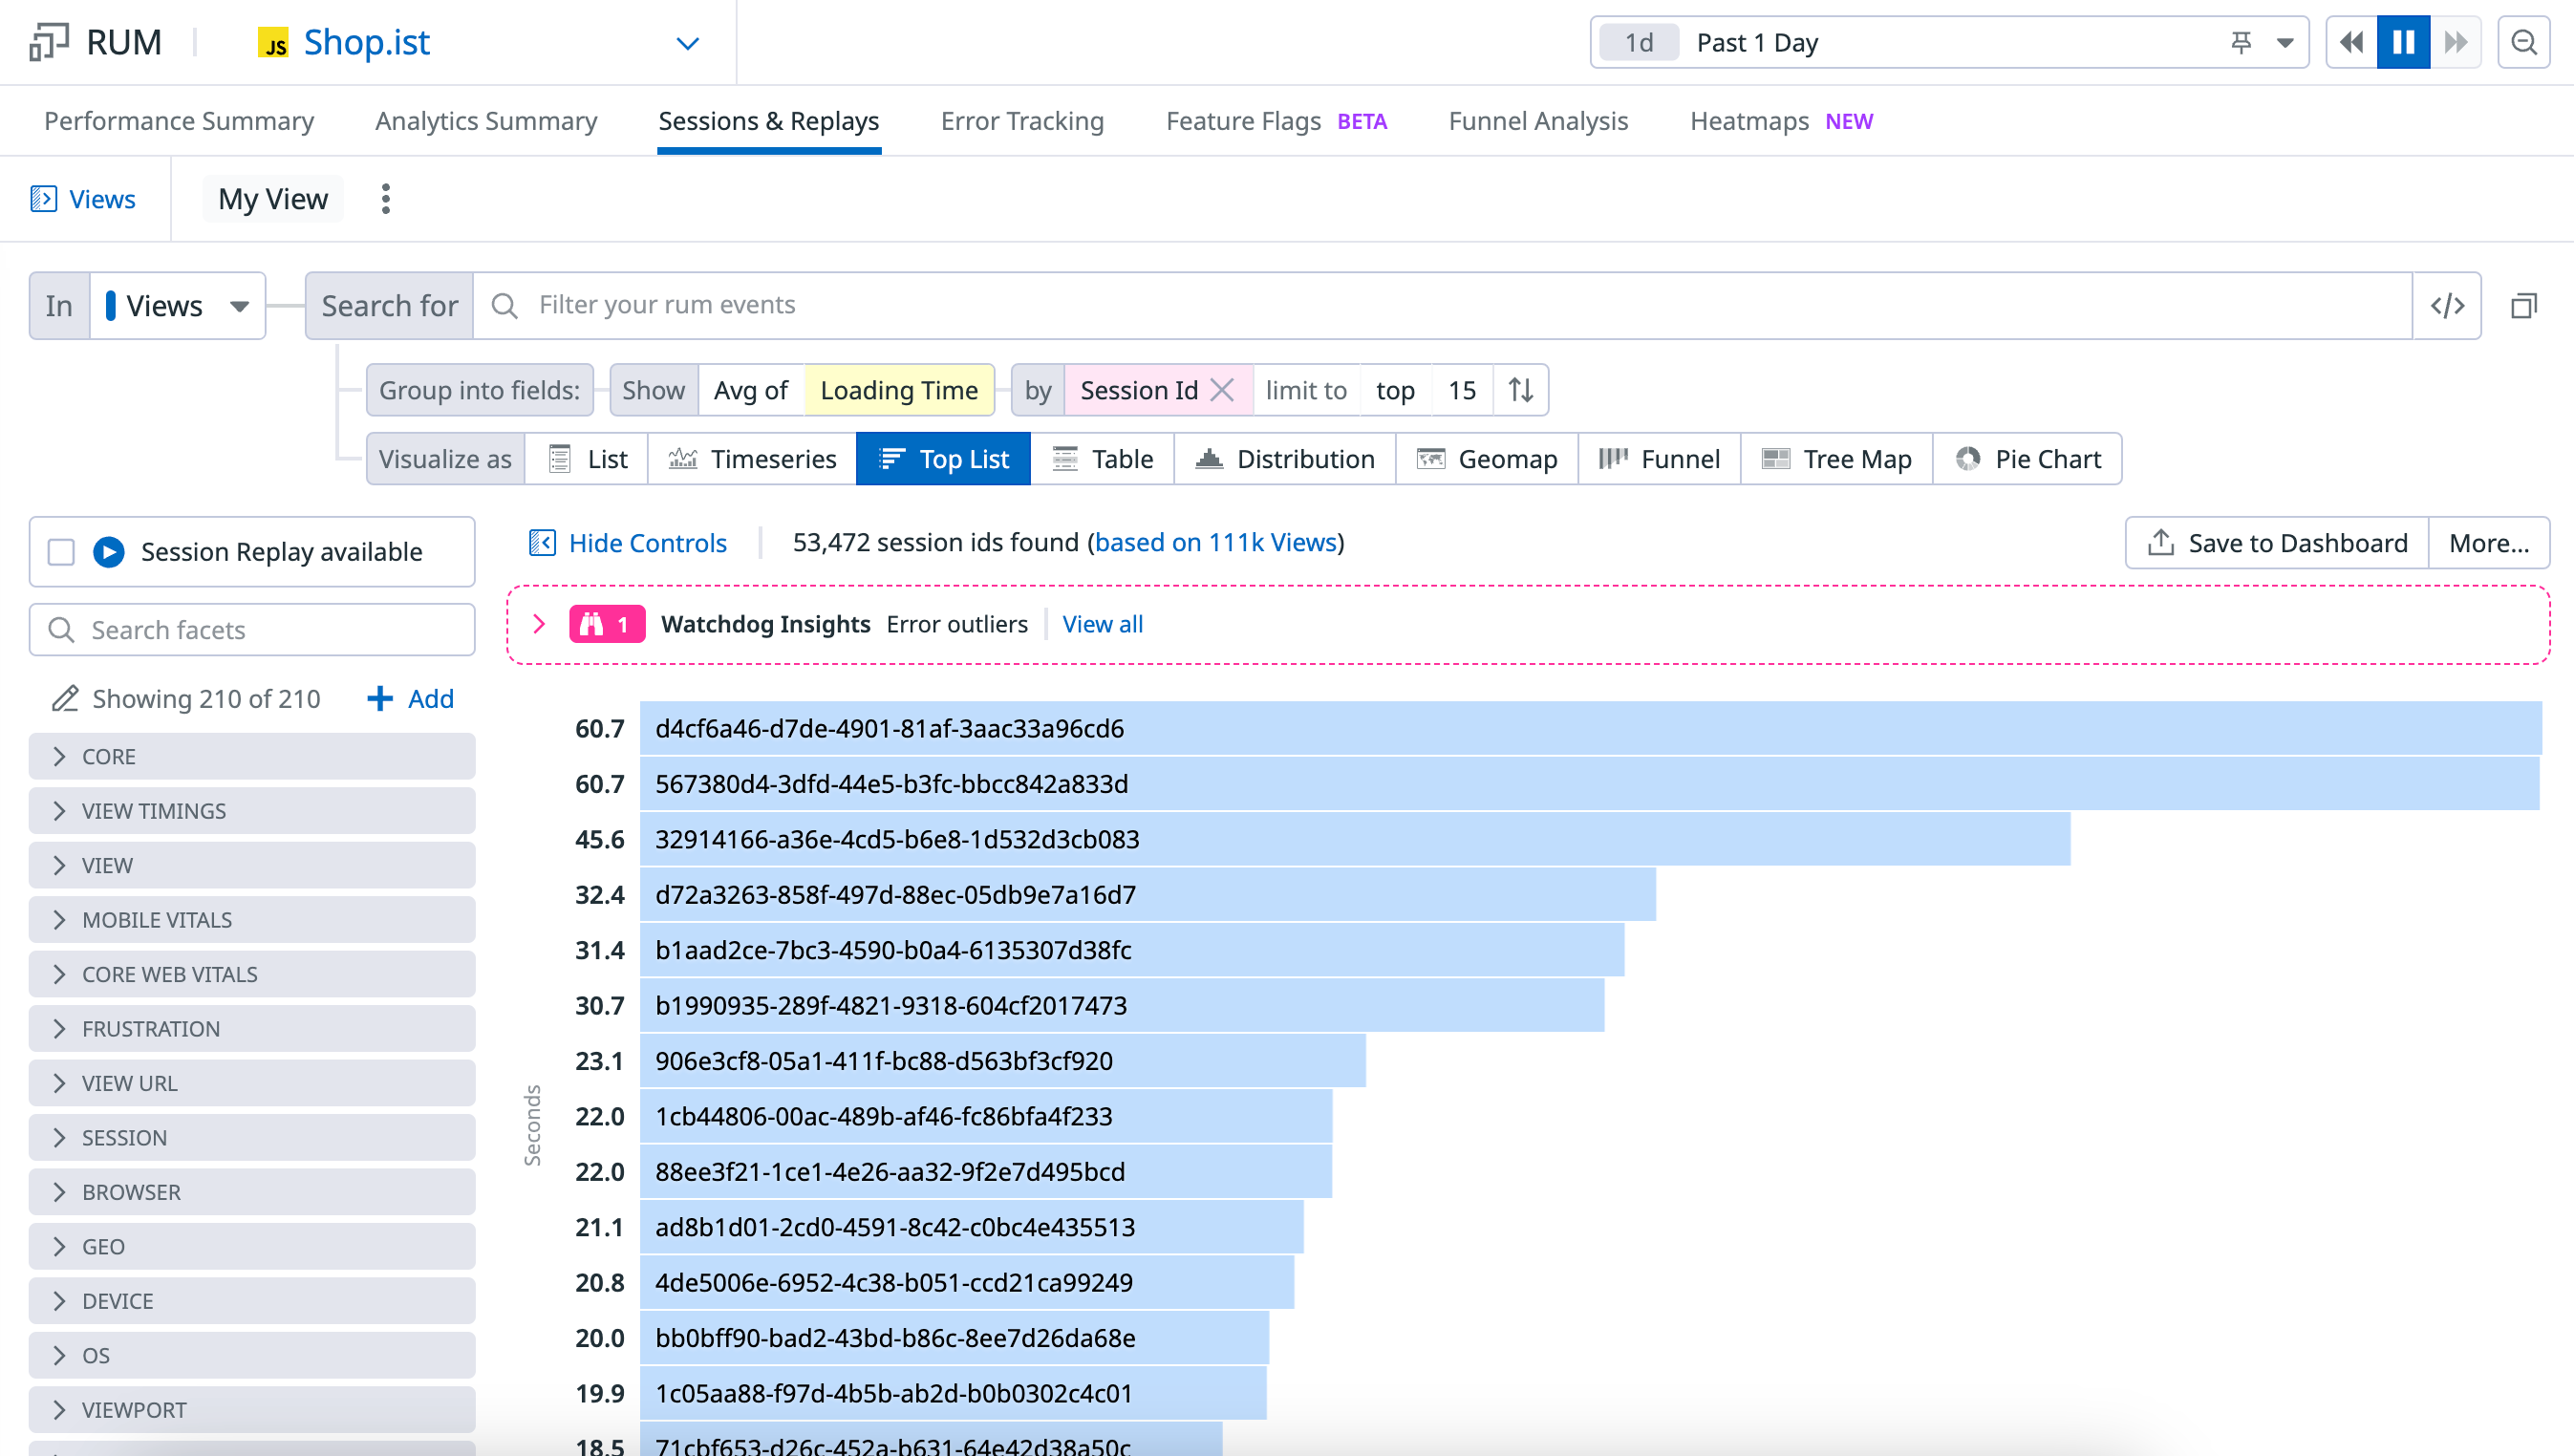
The Group into fields aggregation supports one dimension for the Top list visualization and up to three dimensions for the timeseries, list and table visualizations. When there are multiple dimensions, the top values are determined based on the first dimension, then the second dimension within the top values of the first dimension, then the third dimension within the top values of the second dimension, and so on.
Further Reading
Additional helpful documentation, links, and articles:


