- Essentials
- Getting Started
- Datadog
- Datadog Site
- DevSecOps
- Serverless for AWS Lambda
- Agent
- Integrations
- Containers
- Dashboards
- Monitors
- Logs
- APM Tracing
- Profiler
- Tags
- API
- Service Catalog
- Session Replay
- Continuous Testing
- Synthetic Monitoring
- Incident Management
- Database Monitoring
- Cloud Security Management
- Cloud SIEM
- Application Security Management
- Workflow Automation
- CI Visibility
- Test Visibility
- Test Impact Analysis
- Code Analysis
- Learning Center
- Support
- Glossary
- Standard Attributes
- Guides
- Agent
- Integrations
- OpenTelemetry
- Developers
- Authorization
- DogStatsD
- Custom Checks
- Integrations
- Create an Agent-based Integration
- Create an API Integration
- Create a Log Pipeline
- Integration Assets Reference
- Build a Marketplace Offering
- Create a Tile
- Create an Integration Dashboard
- Create a Recommended Monitor
- Create a Cloud SIEM Detection Rule
- OAuth for Integrations
- Install Agent Integration Developer Tool
- Service Checks
- IDE Plugins
- Community
- Guides
- API
- Datadog Mobile App
- CoScreen
- Cloudcraft
- In The App
- Dashboards
- Notebooks
- DDSQL Editor
- Sheets
- Monitors and Alerting
- Infrastructure
- Metrics
- Watchdog
- Bits AI
- Service Catalog
- API Catalog
- Error Tracking
- Service Management
- Infrastructure
- Application Performance
- APM
- Continuous Profiler
- Database Monitoring
- Data Streams Monitoring
- Data Jobs Monitoring
- Digital Experience
- Real User Monitoring
- Product Analytics
- Synthetic Testing and Monitoring
- Continuous Testing
- Software Delivery
- CI Visibility
- CD Visibility
- Test Optimization
- Code Analysis
- Quality Gates
- DORA Metrics
- Security
- Security Overview
- Cloud SIEM
- Cloud Security Management
- Application Security Management
- AI Observability
- Log Management
- Observability Pipelines
- Log Management
- Administration
iOS Crash Reporting and Error Tracking
Overview
Enable iOS Crash Reporting and Error Tracking to get comprehensive crash reports and error trends with Real User Monitoring. With this feature, you can access:
- Aggregated iOS crash dashboards and attributes
- Symbolicated iOS crash reports
- Trend analysis with iOS error tracking
In order to symbolicate your stack traces, find and upload your .dSYM files to Datadog. Then, verify your configuration by running a test crash and restarting your application.
Your crash reports appear in Error Tracking.
Setup
If you have not set up the iOS SDK yet, follow the in-app setup instructions or see the iOS RUM setup documentation.
Add crash reporting
To enable Crash Reporting, make sure to also enable RUM and, or Logs. Then, add the package according to your dependency manager and update your initialize snippet.
You can use CocoaPods to install dd-sdk-ios:
pod 'DatadogCrashReporting'
To integrate using Apple’s Swift Package Manager, add the following as a dependency to your Package.swift:
.package(url: "https://github.com/Datadog/dd-sdk-ios.git", .upToNextMajor(from: "2.0.0"))
In your project, link the following libraries:
DatadogCrashReporting
You can use Carthage to install dd-sdk-ios:
github "DataDog/dd-sdk-ios"
In Xcode, link the following frameworks:
DatadogCrashReporting.xcframework
CrashReporter.xcframework
Update your initialization snippet to include Crash Reporting:
import DatadogCore
import DatadogCrashReporting

Datadog.initialize(
  with: Datadog.Configuration(
    clientToken: "<client token>",
    env: "<environment>",
    service: "<service name>"
  ),
  trackingConsent: trackingConsent
)

CrashReporting.enable()
Add app hang reporting
App hangs are an iOS-specific type of error that happens when the application is unresponsive for too long.
By default, app hangs reporting is disabled, but you can enable it and set your own threshold to monitor app hangs that last more than a specified duration by using the appHangThreshold initialization parameter. A customizable threshold allows you to find the right balance between fine-grained and noisy observability. See Configure the app hang threshold for more guidance on what to set this value to.
App hangs are reported through the RUM iOS SDK (not through Logs).
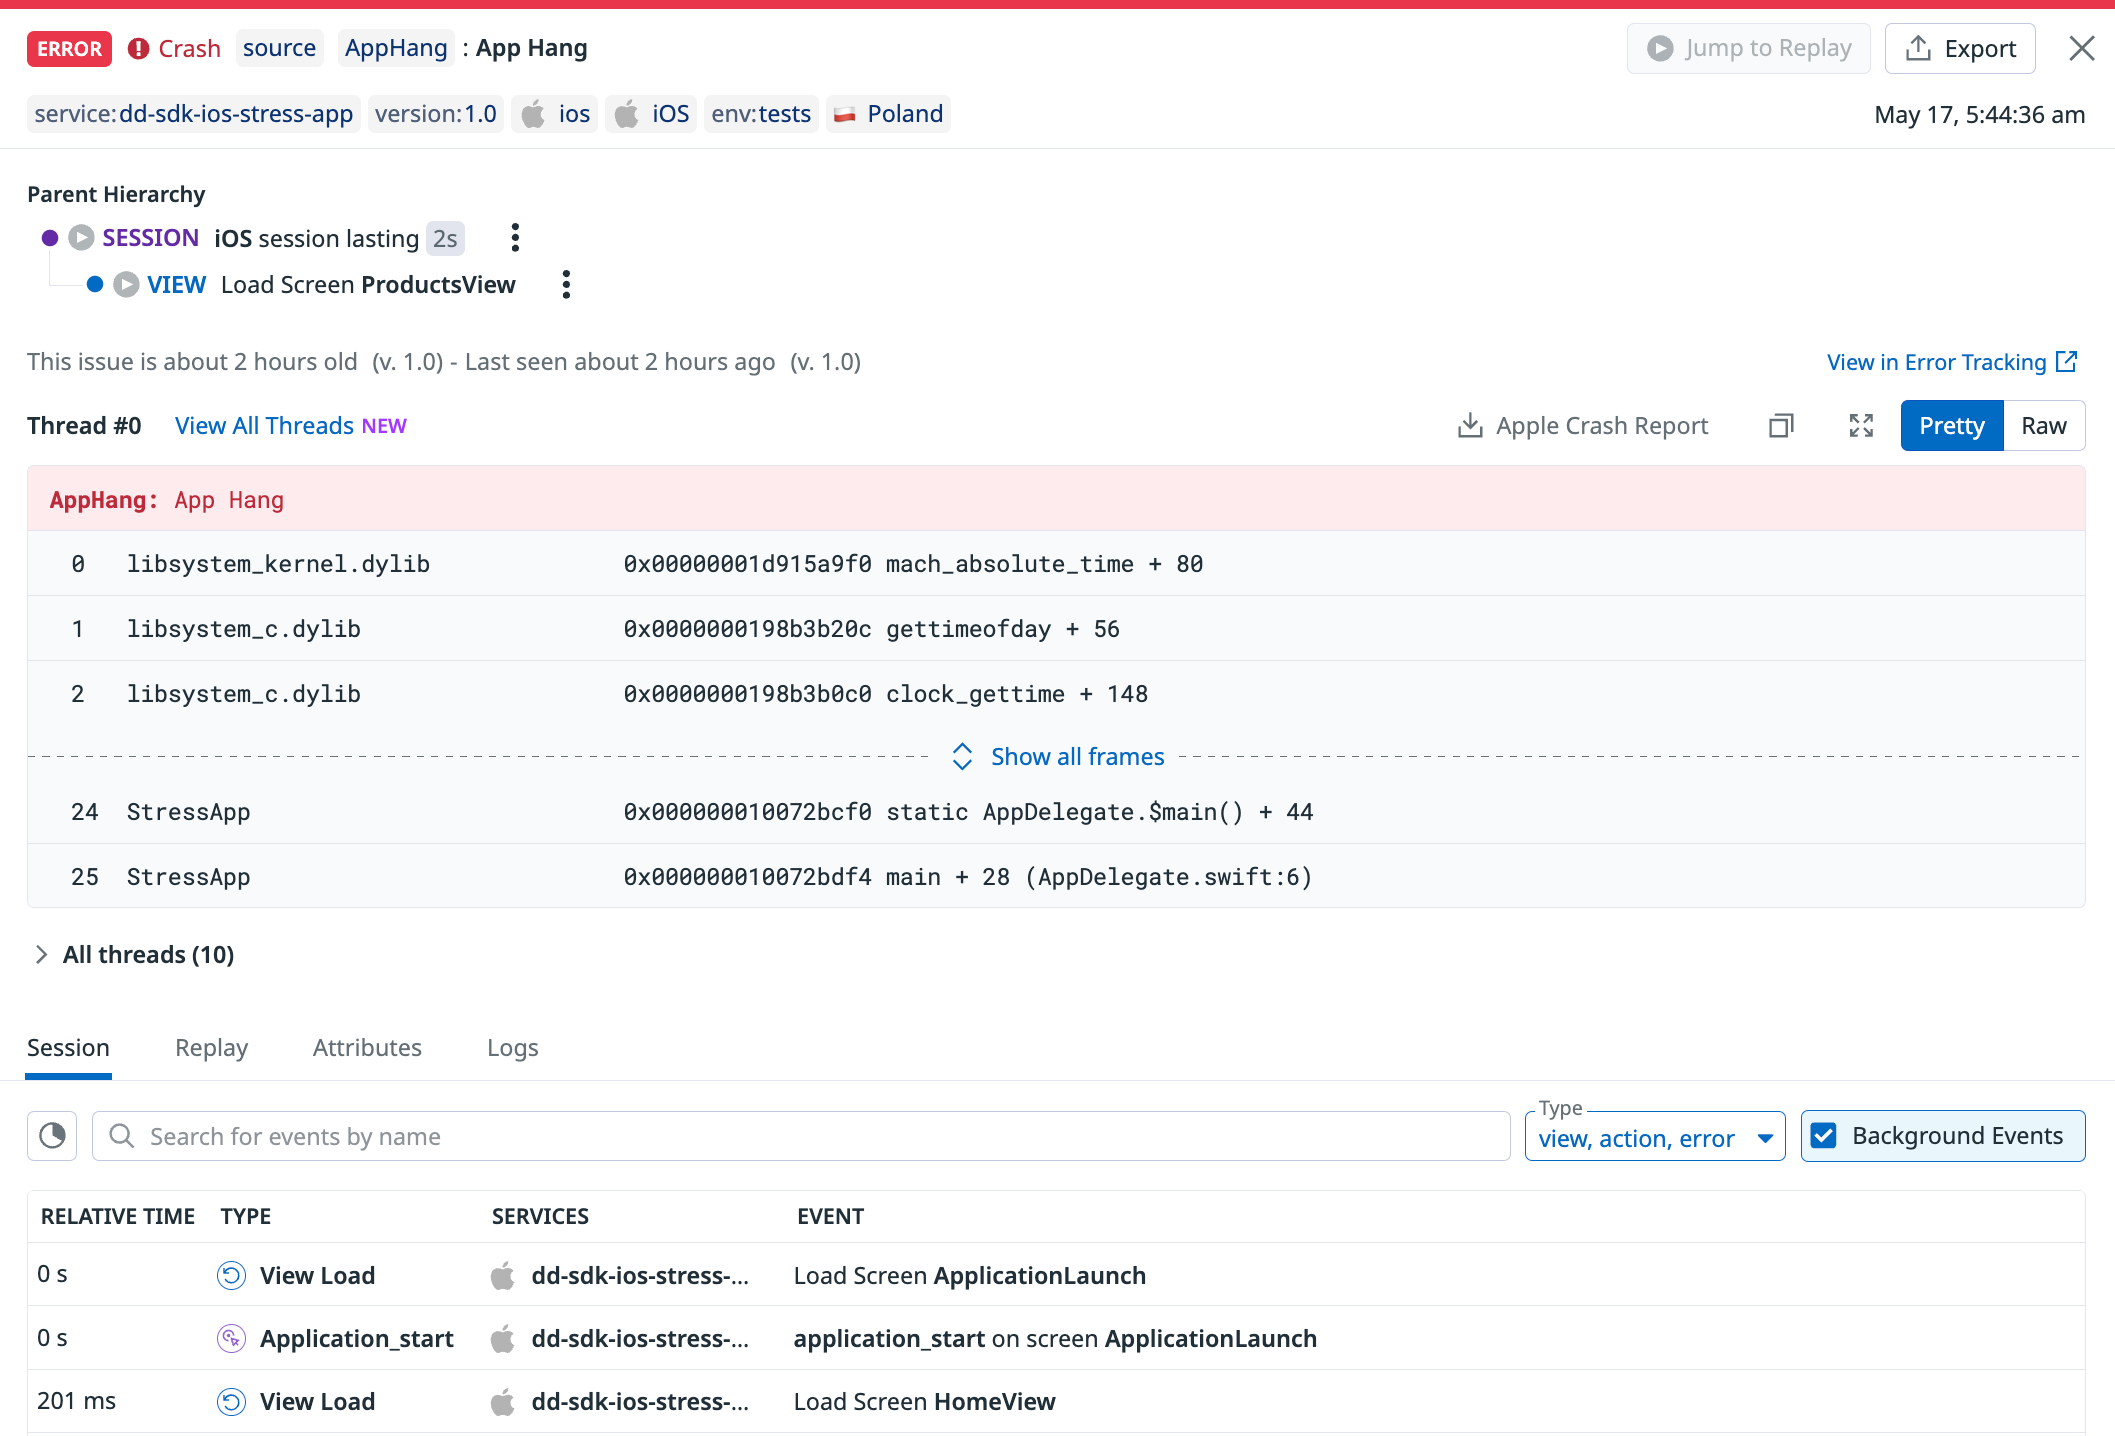
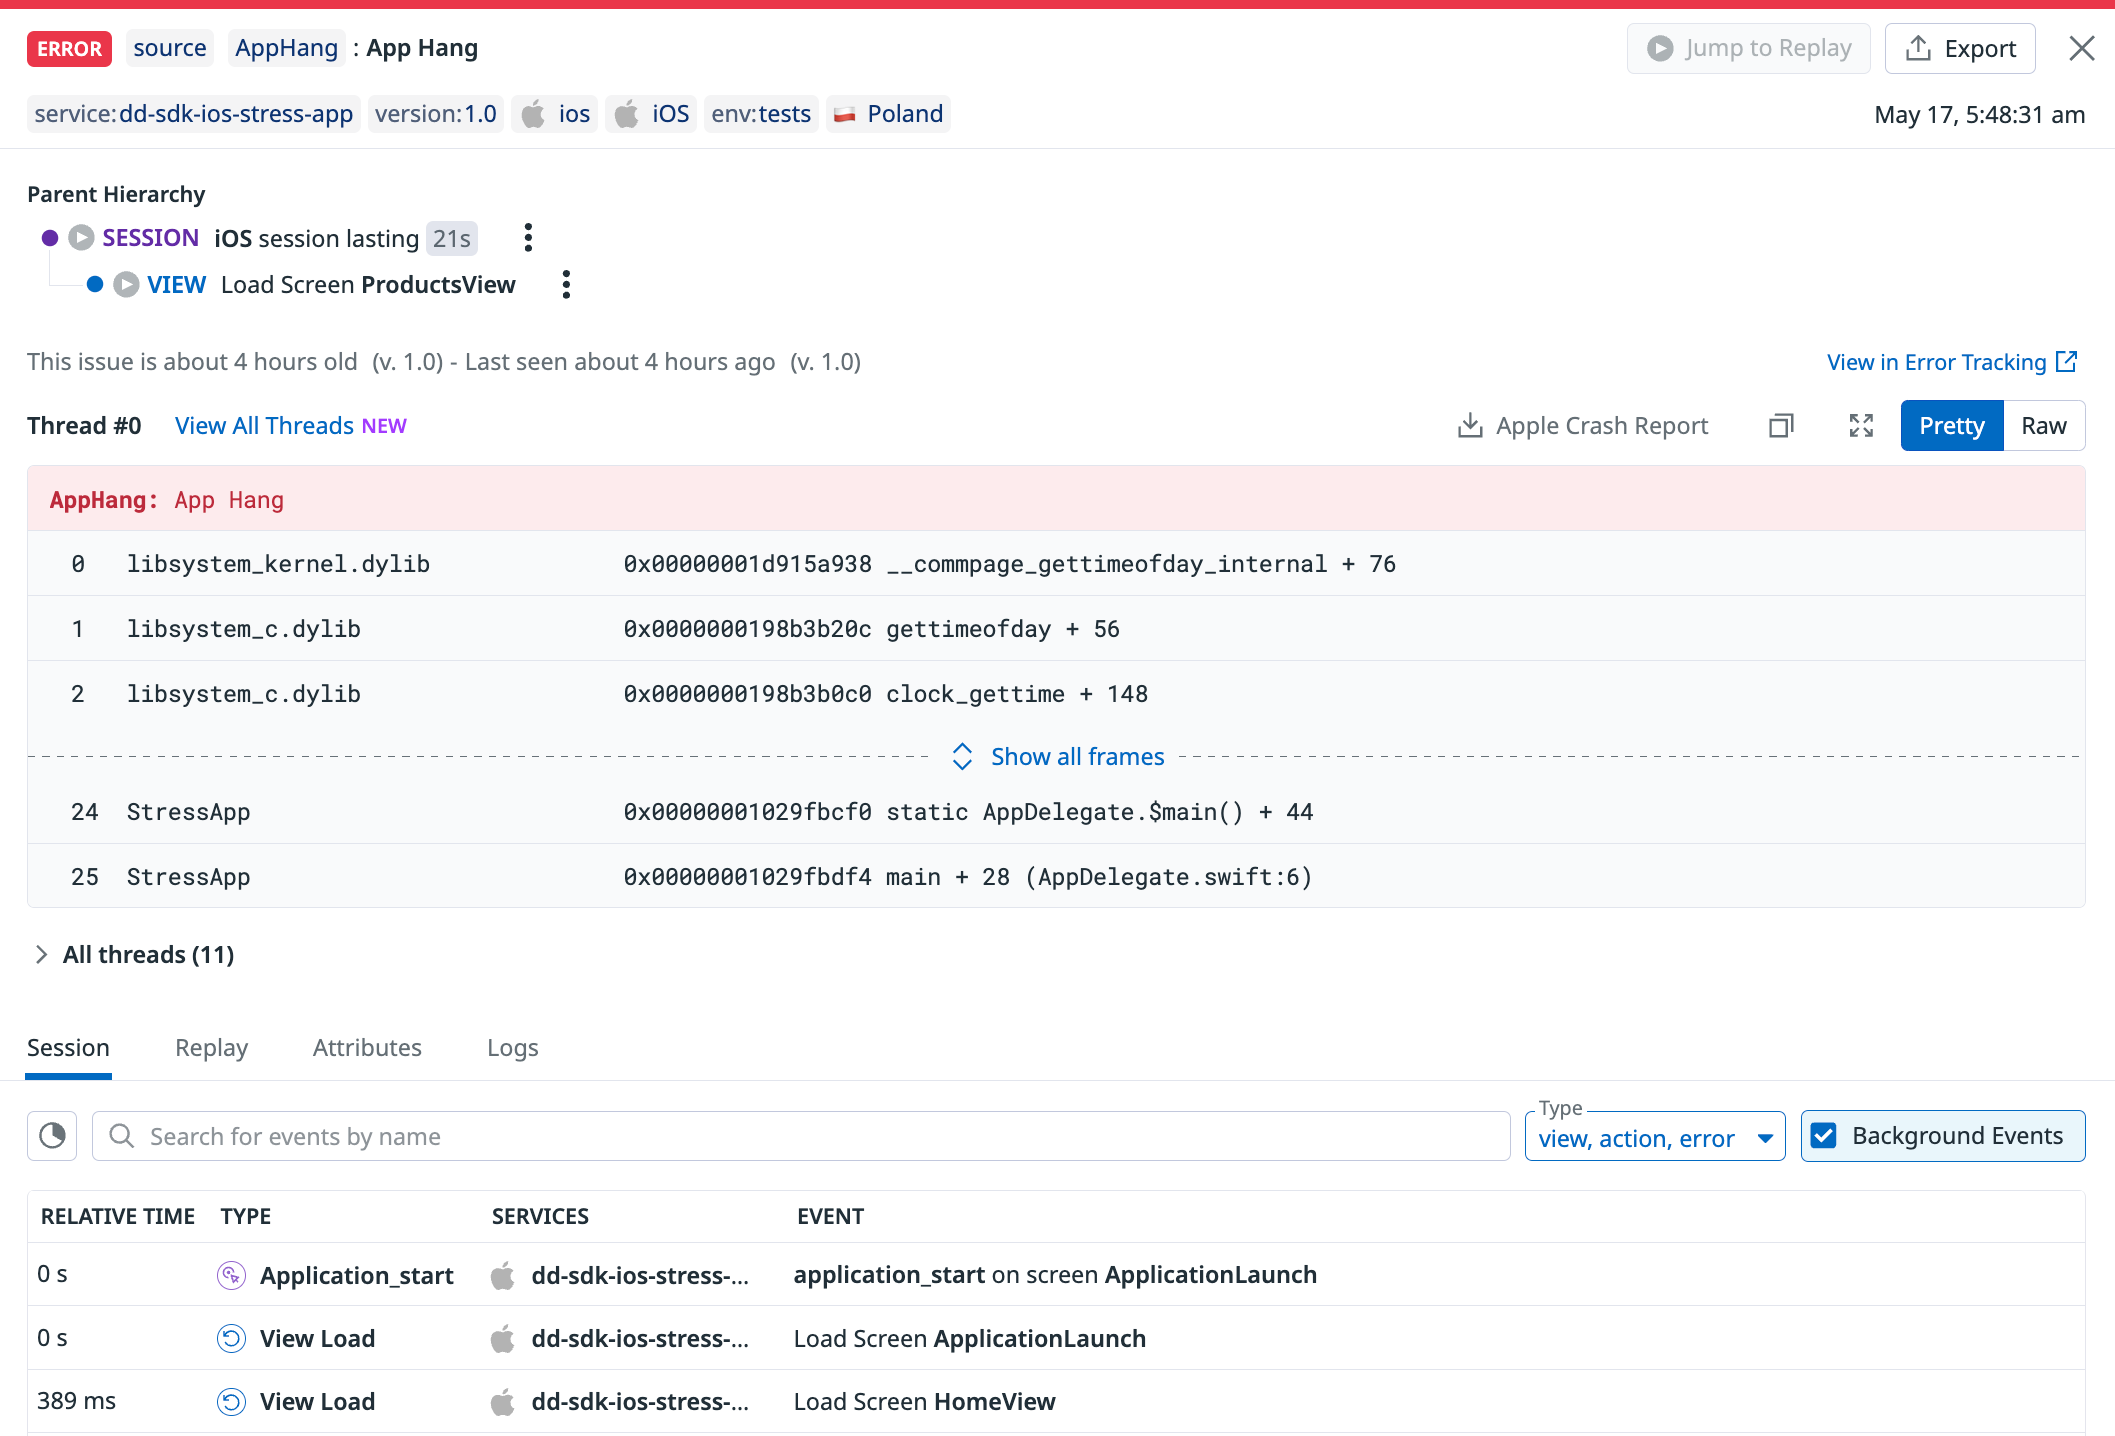
When enabled, any main thread pause that is longer than the specified appHangThreshold is considered a “hang” in Error Tracking. There are two types of hangs:
Fatal app hang: How a hang gets reported if it never gets recovered and the app is terminated. Fatal app hangs are marked as a “Crash” in Error Tracking and the RUM explorer.
Non-fatal app hang: How a hang gets reported if the app recovers from a relatively short hang and continues running. Non-fatal app hangs do not have a “Crash” mark on them in Error Tracking and the RUM explorer.
Enable app hang monitoring
To enable app hang monitoring:
Update the initialization snippet with the
appHangThresholdparameter:RUM.enable( with: RUM.Configuration( applicationID: "<rum application id>", appHangThreshold: 0.25 ) )Set the
appHangThresholdparameter to the minimal duration you want app hangs to be reported. For example, enter0.25to report hangs lasting at least 250 ms. See Configure the app hang threshold for more guidance on what to set this value to.Make sure you follow the steps below to get deobfuscated stack traces.
Configure the app hang threshold
Apple only considers hangs lasting more than 250 ms in their hang rate metrics in Xcode Organizer. Datadog recommends starting with a similar value for the
appHangThreshold(in other words, set it to0.25) and then lowering it or increasing it incrementally to find the right setup.To filter out most of the noisy hangs, we recommend settling on an
appHangThresholdbetween 2 and 3 seconds.The minimum value the
appHangThresholdoption can be set to is0.1seconds (100 ms). However, setting the threshold to such small values may lead to an excessive reporting of hangs.The SDK implements a secondary thread for monitoring app hangs. To reduce CPU utilization, it tracks hangs with a tolerance of 2.5%, which means some hangs that last close to the
appHangThresholdmay not be reported.
Compute the hang rate of your application
Xcode Organizer and MetricKit both provide a hang rate metric defined as “the number of seconds per hour that the app is unresponsive, while only counting periods of unresponsiveness of more than 250 ms.”
To compute a similar hang rate on Datadog, make sure:
- That app hang reporting is enabled.
- That the app hang threshold is equal or below 250 ms.
- That the
@error.categoryand@freeze.durationattribute reported on your app hangs errors in RUM are available in your facets (this should be the case by default. If it’s not, you can manually create facets).
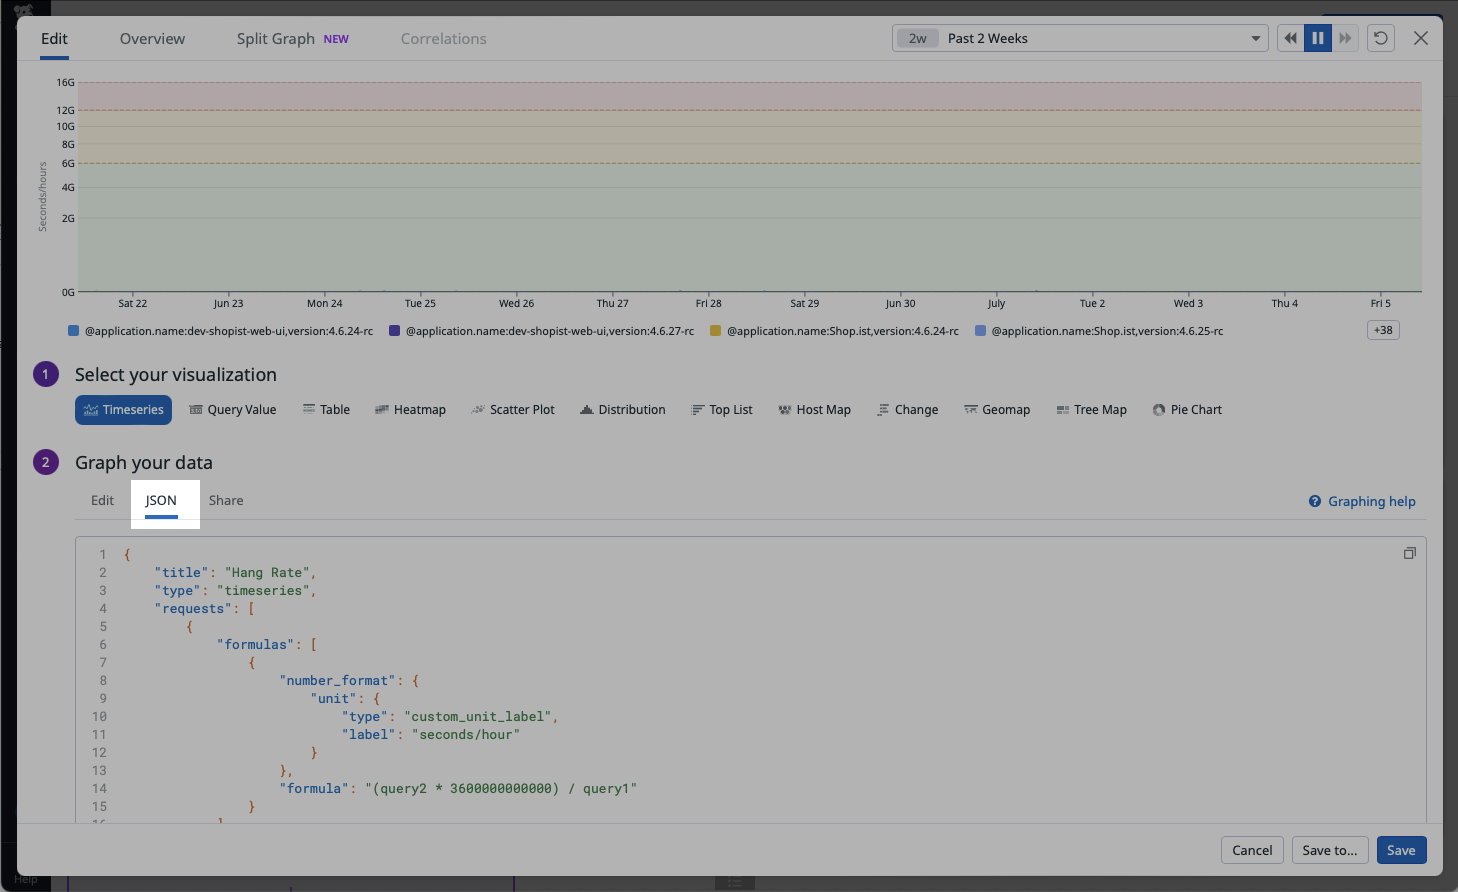
If all these prerequisites are met, then create a new Timeseries widget on a Dashboard or a Notebook, and paste the following snippet in the JSON tab of your widget, under the “Graph your data” section:
JSON snippet of the hang rate widget
JSON snippet of the hang rate widget
{
    "title": "Hang Rate",
    "type": "timeseries",
    "requests": [
        {
            "formulas": [
                {
                    "number_format": {
                        "unit": {
                            "type": "custom_unit_label",
                            "label": "seconds/hour"
                        }
                    },
                    "formula": "(query2 * 3600000000000) / query1"
                }
            ],
            "queries": [
                {
                    "name": "query2",
                    "data_source": "rum",
                    "search": {
                        "query": "@type:error @error.category:\"App Hang\" @freeze.duration:>=250000000 @session.type:user"
                    },
                    "indexes": [
                        "*"
                    ],
                    "group_by": [
                        {
                            "facet": "@application.name",
                            "limit": 10,
                            "sort": {
                                "aggregation": "sum",
                                "order": "desc",
                                "metric": "@freeze.duration"
                            },
                            "should_exclude_missing": true
                        },
                        {
                            "facet": "version",
                            "limit": 10,
                            "sort": {
                                "aggregation": "sum",
                                "order": "desc",
                                "metric": "@freeze.duration"
                            },
                            "should_exclude_missing": true
                        }
                    ],
                    "compute": {
                        "aggregation": "sum",
                        "metric": "@freeze.duration",
                        "interval": 3600000
                    },
                    "storage": "hot"
                },
                {
                    "name": "query1",
                    "data_source": "rum",
                    "search": {
                        "query": "@type:session @session.type:user"
                    },
                    "indexes": [
                        "*"
                    ],
                    "group_by": [
                        {
                            "facet": "@application.name",
                            "limit": 10,
                            "sort": {
                                "aggregation": "sum",
                                "order": "desc",
                                "metric": "@session.time_spent"
                            },
                            "should_exclude_missing": true
                        },
                        {
                            "facet": "version",
                            "limit": 10,
                            "sort": {
                                "aggregation": "sum",
                                "order": "desc",
                                "metric": "@session.time_spent"
                            },
                            "should_exclude_missing": true
                        }
                    ],
                    "compute": {
                        "aggregation": "sum",
                        "metric": "@session.time_spent",
                        "interval": 3600000
                    },
                    "storage": "hot"
                }
            ],
            "response_format": "timeseries",
            "style": {
                "palette": "dog_classic",
                "order_by": "values",
                "line_type": "solid",
                "line_width": "normal"
            },
            "display_type": "line"
        }
    ],
    "yaxis": {
        "include_zero": true,
        "scale": "sqrt"
    },
    "markers": [
        {
            "value": "y > 12000000000",
            "display_type": "error dashed"
        },
        {
            "value": "6000000000 < y < 12000000000",
            "display_type": "warning dashed"
        },
        {
            "value": "0 < y < 6000000000",
            "display_type": "ok dashed"
        }
    ]
}
Disable app hang monitoring
To disable app hang monitoring, update the initialization snippet and set the appHangThreshold parameter to nil.
Add watchdog terminations reporting
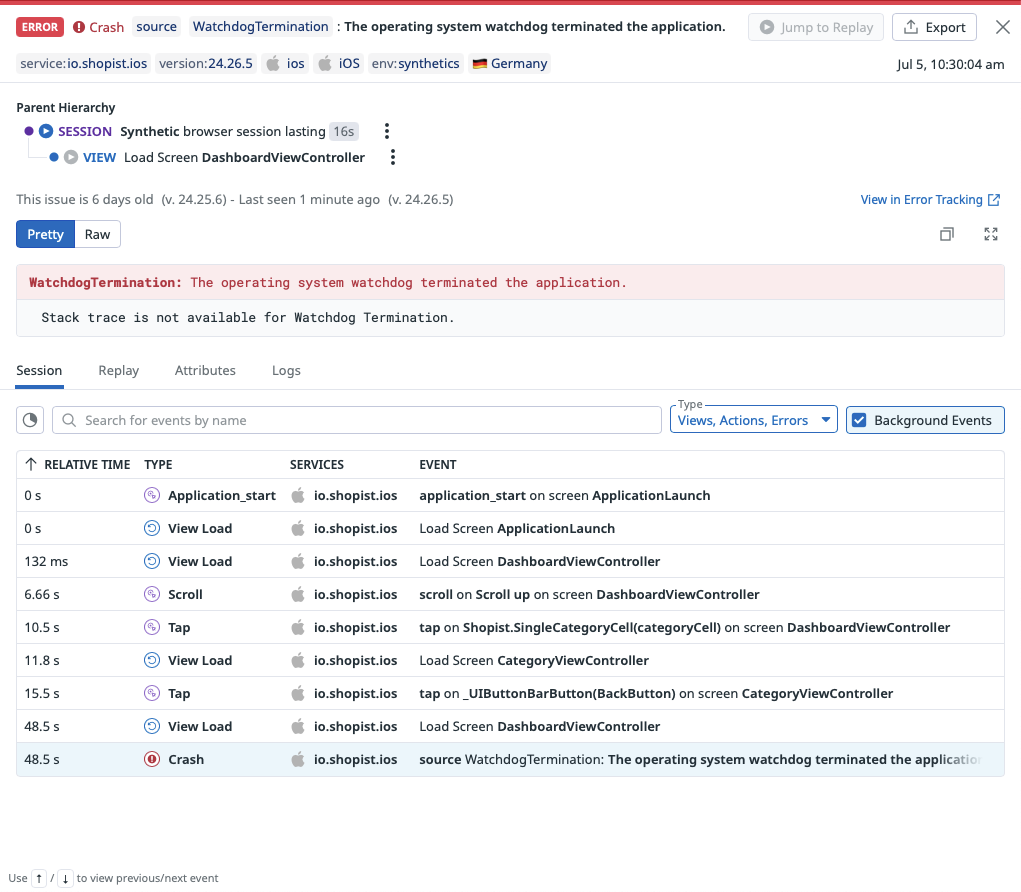
In the Apple ecosystem, the operating system employs a watchdog mechanism to monitor the health of applications, and terminates them if they become unresponsive or consume excessive resources like CPU and memory. These Watchdog Terminations are fatal and not recoverable (more details in the official Apple documentation).
By default, watchdog terminations reporting is disabled, but you can enable it by using the trackWatchdogTerminations initialization parameter.
Watchdog terminations are reported through the RUM iOS SDK only (not through Logs).
When enabled, a watchdog termination is reported and attached to the previous RUM Session on the next application launch, based on heuristics:
The application was not upgraded in the meantime,
And it did not call either
exit, orabort,And it did not crash, either because of an exception, or because of a fatal app hang,
And it was not force-quitted by the user,
And the device did not reboot (which includes upgrades of the operating system).
Enable watchdog terminations reporting
To enable watchdog terminations reporting:
Update the initialization snippet with the
trackWatchdogTerminationsflag:RUM.enable( with: RUM.Configuration( applicationID: "<rum application id>", trackWatchdogTerminations: true ) )
Troubleshoot watchdog terminations
When an application is terminated by the iOS Watchdog, it doesn’t get any termination signal. As a result of this lack of a termination signal, watchdog terminations do not contain any stack trace. To troubleshoot watchdog terminations, Datadog recommends looking at the vitals of the parent RUM View (CPU Ticks, Memory).
Disable watchdog terminations reporting
To disable watchdog terminations reporting, update the initialization snippet and set the trackWatchdogTerminations parameter to false.
Get deobfuscated stack traces
Mapping files are used to deobfuscate stack traces, which helps in debugging errors. Using a unique build ID that gets generated, Datadog automatically matches the correct stack traces with the corresponding mapping files. This ensures that regardless of when the mapping file was uploaded (either during pre-production or production builds), the correct information is available for efficient QA processes when reviewing crashes and errors reported in Datadog.
For iOS applications, the matching of stack traces and symbol files relies on their uuid field.
List uploaded .dSYMs
See the RUM Debug Symbols page to view all uploaded symbols.
Symbolicate crash reports
Crash reports are collected in a raw format and mostly contain memory addresses. To map these addresses into legible symbol information, Datadog requires .dSYM files, which are generated in your application’s build or distribution process.
Find your .dSYM file
Every iOS application produces .dSYM files for each application module. These files minimize an application’s binary size and enable faster download speed. Each application version contains a set of .dSYM files.
Depending on your setup, you may need to download .dSYM files from App Store Connect or find them on your local machine.
| Bitcode Enabled | Description |
|---|---|
| Yes | .dSYM files are available after App Store Connect completes processing your application’s build. |
| No | Xcode exports .dSYM files to $DWARF_DSYM_FOLDER_PATH at the end of your application’s build. Ensure that the DEBUG_INFORMATION_FORMAT build setting is set to DWARF with dSYM File. By default, Xcode projects only set DEBUG_INFORMATION_FORMAT to DWARF with dSYM File for the Release project configuration. |
Upload your .dSYM file
By uploading your .dSYM file to Datadog, you gain access to the file path and line number of each frame in an error’s related stack trace.
Once your application crashes and you restart the application, the iOS SDK uploads a crash report to Datadog.
Note: Re-uploading a source map does not override the existing one if the version has not changed.
Use Datadog CI to upload your .dSYM file
You can use the command line tool @datadog/datadog-ci to upload your .dSYM file:
export DATADOG_API_KEY="<API KEY>"

// if you have a zip file containing dSYM files
npx @datadog/datadog-ci dsyms upload appDsyms.zip

// if you have a folder containing dSYM files
npx @datadog/datadog-ci dsyms upload /path/to/appDsyms/
Note: To configure the tool using the EU endpoint, set the DATADOG_SITE environment variable to datadoghq.eu. To override the full URL for the intake endpoint, define the DATADOG_DSYM_INTAKE_URL environment variable.
Alternatively, if you use Fastlane or GitHub Actions in your workflows, you can leverage these integrations instead of datadog-ci:
Use Fastlane plugin to upload your .dSYM file
The Fastlane plugin helps you upload .dSYM files to Datadog from your Fastlane configuration.
Add
fastlane-plugin-datadogto your project.fastlane add_plugin datadogConfigure Fastlane to upload your symbols.
# download_dsyms action feeds dsym_paths automatically
lane :upload_dsym_with_download_dsyms do
  download_dsyms
  upload_symbols_to_datadog(api_key: "datadog-api-key")
end
For more information, see fastlane-plugin-datadog.
Use GitHub Actions to upload your .dSYM file
The Datadog Upload dSYMs GitHub Action allows you to upload your symbols in your GitHub Action jobs:
name: Upload dSYM Files

jobs:
  build:
    runs-on: macos-latest

    steps:
      - name: Checkout
        uses: actions/checkout@v2

      - name: Generate/Download dSYM Files
        uses: ./release.sh

      - name: Upload dSYMs to Datadog
        uses: DataDog/upload-dsyms-github-action@v1
        with:
          api_key: ${{ secrets.DATADOG_API_KEY }}
          site: datadoghq.com
          dsym_paths: |
            path/to/dsyms/folder
            path/to/zip/dsyms.zip
For more information, see dSYMs commands.
Limitations
dSYM files are limited to 500 MB.
dSYM files are limited to 500 MB.
Test your implementation
To verify your iOS Crash Reporting and Error Tracking configuration, issue a crash in your RUM application and confirm that the error appears in Datadog.
Run your application on an iOS simulator or a real device. Ensure that the debugger is not attached. Otherwise, Xcode captures the crash before the iOS SDK does.
Execute the code containing the crash:
func didTapButton() {
  fatalError("Crash the app")
}
After the crash happens, restart your application and wait for the iOS SDK to upload the crash report in Error Tracking.
Note: RUM supports symbolication of system symbol files for iOS v14+ arm64 and arm64e architecture.
Further Reading
Additional helpful documentation, links, and articles:


