- Essentials
- Getting Started
- Datadog
- Datadog Site
- DevSecOps
- Serverless for AWS Lambda
- Agent
- Integrations
- Containers
- Dashboards
- Monitors
- Logs
- APM Tracing
- Profiler
- Tags
- API
- Service Catalog
- Session Replay
- Continuous Testing
- Synthetic Monitoring
- Incident Management
- Database Monitoring
- Cloud Security Management
- Cloud SIEM
- Application Security Management
- Workflow Automation
- CI Visibility
- Test Visibility
- Test Impact Analysis
- Code Analysis
- Learning Center
- Support
- Glossary
- Standard Attributes
- Guides
- Agent
- Integrations
- OpenTelemetry
- Developers
- Authorization
- DogStatsD
- Custom Checks
- Integrations
- Create an Agent-based Integration
- Create an API Integration
- Create a Log Pipeline
- Integration Assets Reference
- Build a Marketplace Offering
- Create a Tile
- Create an Integration Dashboard
- Create a Recommended Monitor
- Create a Cloud SIEM Detection Rule
- OAuth for Integrations
- Install Agent Integration Developer Tool
- Service Checks
- IDE Plugins
- Community
- Guides
- API
- Datadog Mobile App
- CoScreen
- Cloudcraft
- In The App
- Dashboards
- Notebooks
- DDSQL Editor
- Sheets
- Monitors and Alerting
- Infrastructure
- Metrics
- Watchdog
- Bits AI
- Service Catalog
- API Catalog
- Error Tracking
- Service Management
- Infrastructure
- Application Performance
- APM
- Continuous Profiler
- Database Monitoring
- Data Streams Monitoring
- Data Jobs Monitoring
- Digital Experience
- Real User Monitoring
- Product Analytics
- Synthetic Testing and Monitoring
- Continuous Testing
- Software Delivery
- CI Visibility
- CD Visibility
- Test Optimization
- Code Analysis
- Quality Gates
- DORA Metrics
- Security
- Security Overview
- Cloud SIEM
- Cloud Security Management
- Application Security Management
- AI Observability
- Log Management
- Observability Pipelines
- Log Management
- Administration
Metric-based SLOs
Overview
Metric-based SLOs are useful for a count-based stream of data where you are differentiating good and bad events. A metric query uses the sum of the good events divided by the sum of total events over time to calculate a Service Level Indicator (or SLI). You can use any metric to create SLOs, including custom metrics generated from APM spans, RUM events, and logs. For an overview on how SLOs are configured and calculated, see the Service Level Objective page.
Setup
On the SLO status page, click + New SLO. Then select, By Count.
Define queries
- There are two queries to define. The numerator query defines the sum of the good events, while the denominator query defines the sum of the total events. Your queries must use COUNT, RATE, or percentile-enabled DISTRIBUTION metrics to ensure the SLO calculation behaves correctly. For more information, see Querying documentation.
- Use the
FROMfield to include or exclude specific groups using tags. - For percentile-enabled DISTRIBUTION metrics, you must use the
count values...aggregator to specify a numerical threshold for the metric to count. This feature is called Threshold Queries and allows you to count the number of raw values that match a numerical threshold to produce counts for your numerator and denominator. For more information, see Threshold Queries. - Optionally, for percentile-enabled DISTRIBUTION metrics, use the dropdown immediately to the right of the
count values..aggregator to break your SLI out by specific groups. - Optionally, for COUNT or RATE metrics, use the
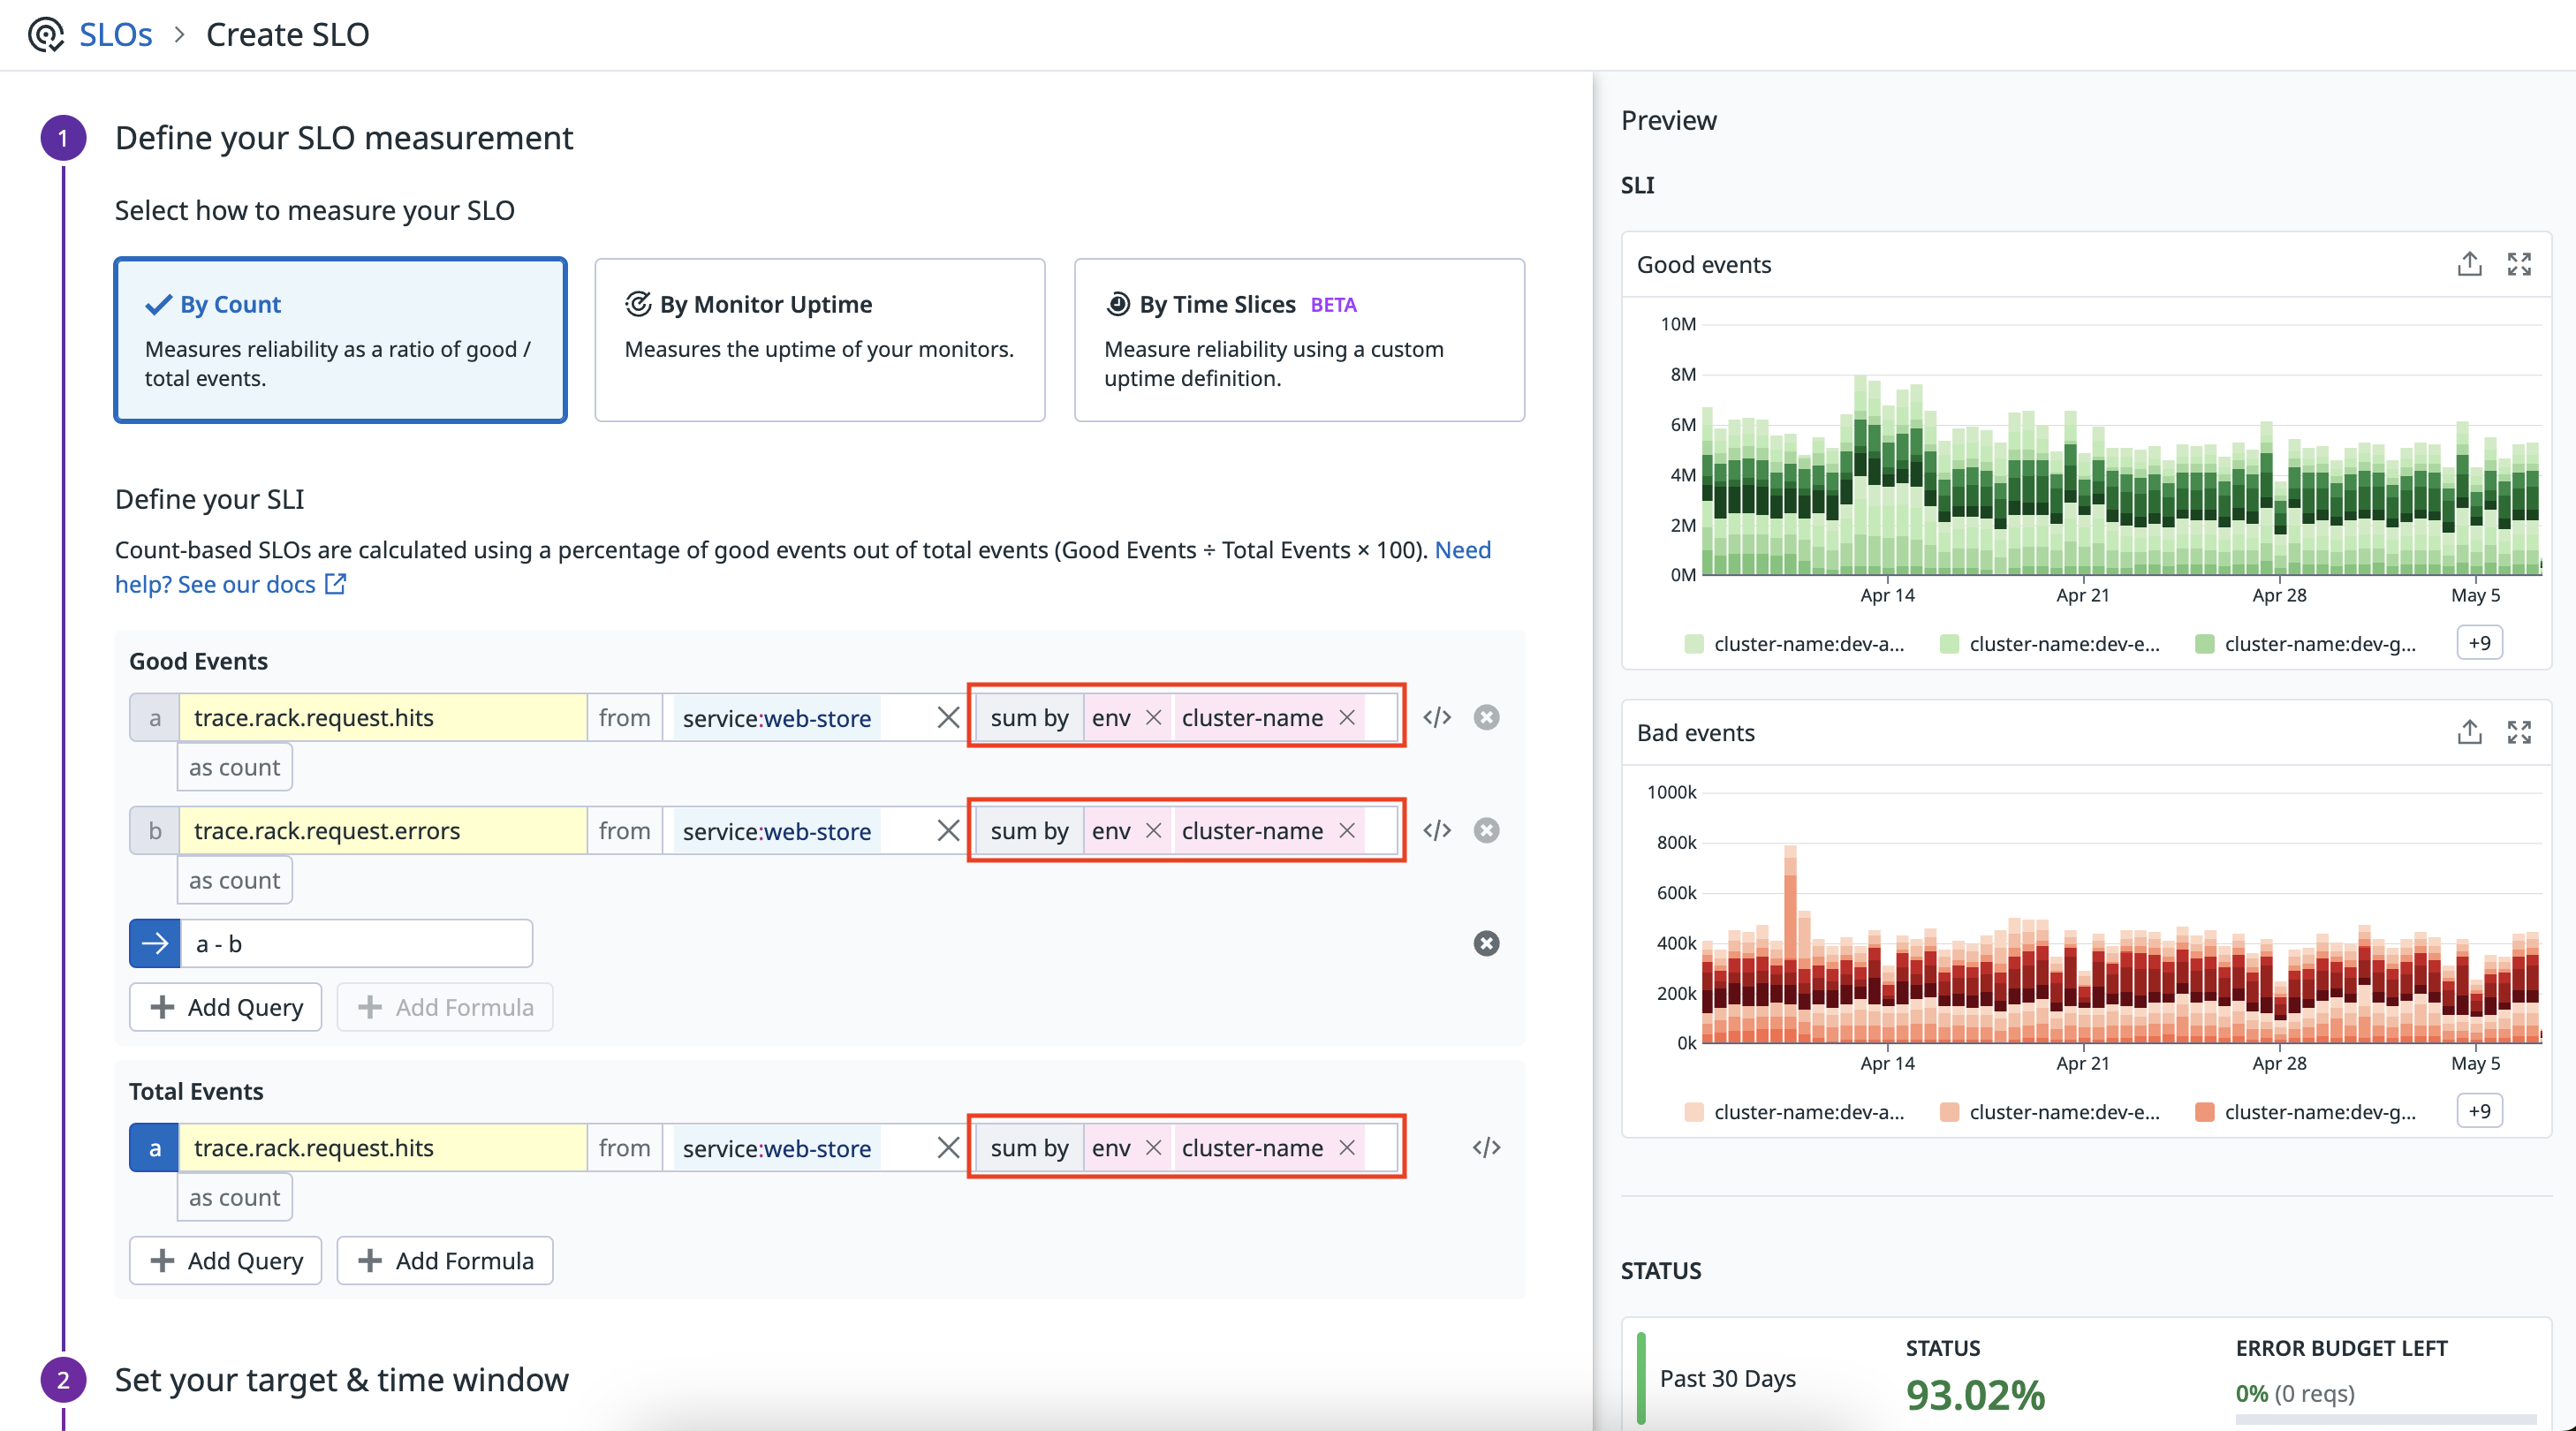
sum byaggregator to break your SLI out by specific groups.
Example: If you are tracking HTTP return codes, and your metric includes a tag like code:2xx OR code:3xx OR code:4xx. The sum of good events would be sum:httpservice.hits{code:2xx} + sum:httpservice.hits{code:4xx}. And the total events would be sum:httpservice.hits{!code:3xx}.
Why is HTTP 3xx excluded? - These are typically redirects and should not count for or against the SLI, but other non-3xx based error codes should. In the total case, you want all types minus HTTP 3xx, in the numerator, you only want OK type status codes.
Multi-group for metric-based SLIs
Metric-based SLIs allow you to focus on the most important attributes of your SLIs. You can add groups to your metric-based SLIs in the editor by using tags like datacenter, env, availability-zone, resource, or any other relevant group:
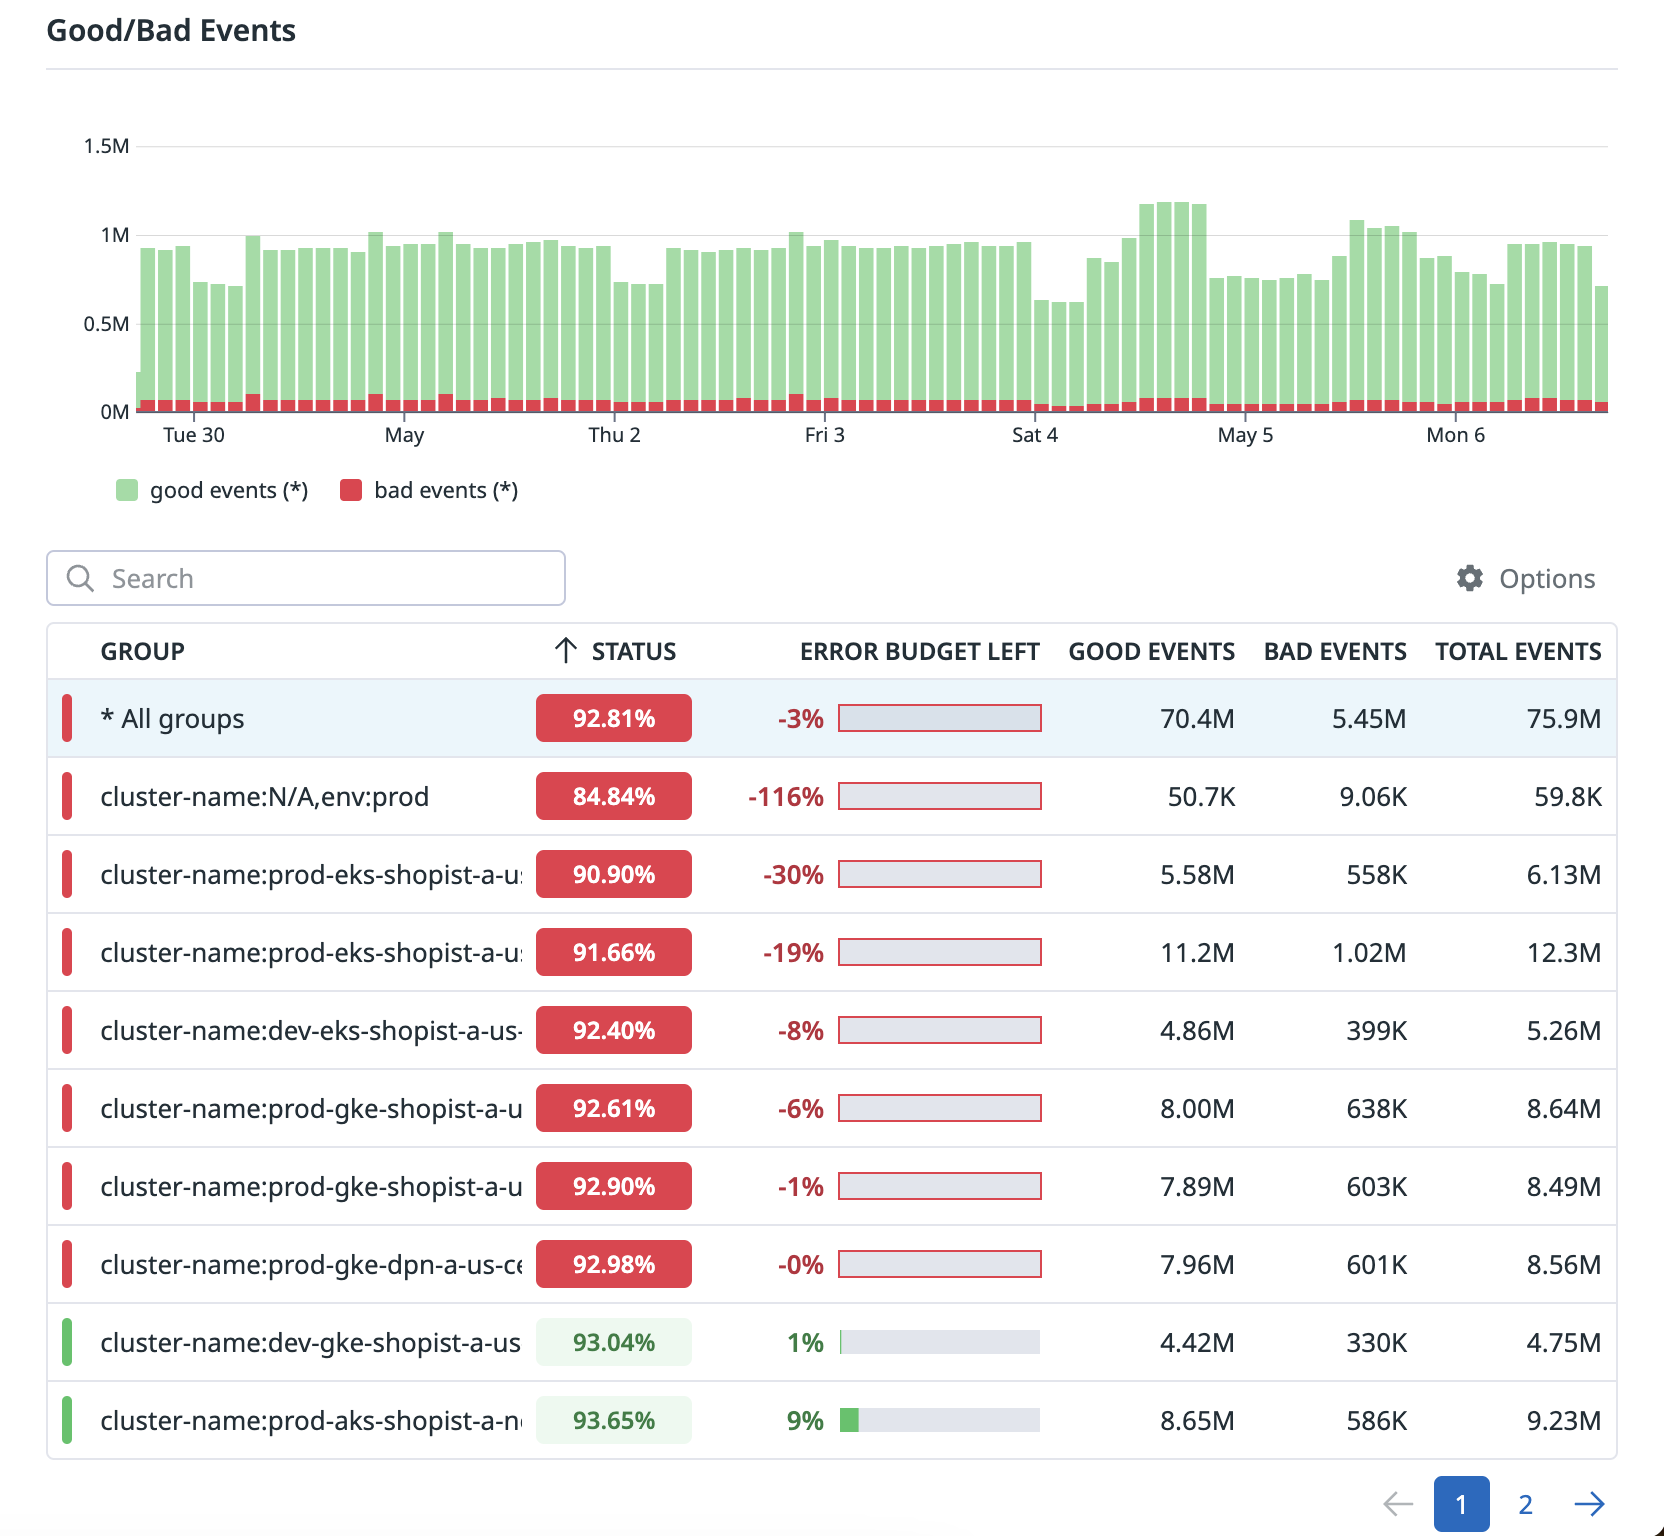
By grouping these SLIs you can visualize each individual group’s status, good request counts, and remaining error budget on the detail panel:
By default, the bar graph shows the overall counts of good and bad requests for the entire SLO. You can scope the bar graph down to an individual group’s good and bad requests counts by clicking on its corresponding row in the table. In addition, you can also choose to show or hide good request counts or bad request counts by selecting the appropriate option in the legend directly below the bar graph.
Set your SLO targets
An SLO target is comprised of the target percentage and the time window. When you set a target for a metric-based SLO the target percentage specifies what portion of the total events specified in the denominator of the SLO should be good events, while the time window specifies the rolling time period over which the target should be tracked.
Example: 99% of requests should be error-free over the past 7 days.
While the SLO remains above the target percentage, the SLO’s status will be displayed in green font. When the target percentage is violated, the SLO’s status will be displayed in red font. You can also optionally include a warning percentage that is greater than the target percentage to indicate when you are approaching an SLO breach. When the warning percentage is violated (but the target percentage is not violated), the SLO status will be displayed in yellow font.
Note: Up to three decimal places are allowed for metric-based SLO targets. The precision shown in the details UI of the SLO will be up to num_target_decimal_places + 1 = 4 decimal places. The exact precision shown will be dependent on the magnitude of the values in your denominator query. The higher the magnitude of the denominator, the higher the precision that can be shown up to the four decimal place limit.
Further Reading
Additional helpful documentation, links, and articles:


