- Essentials
- Getting Started
- Datadog
- Datadog Site
- DevSecOps
- Serverless for AWS Lambda
- Agent
- Integrations
- Containers
- Dashboards
- Monitors
- Logs
- APM Tracing
- Profiler
- Tags
- API
- Service Catalog
- Session Replay
- Continuous Testing
- Synthetic Monitoring
- Incident Management
- Database Monitoring
- Cloud Security Management
- Cloud SIEM
- Application Security Management
- Workflow Automation
- CI Visibility
- Test Visibility
- Test Impact Analysis
- Code Analysis
- Learning Center
- Support
- Glossary
- Standard Attributes
- Guides
- Agent
- Integrations
- OpenTelemetry
- Developers
- Authorization
- DogStatsD
- Custom Checks
- Integrations
- Create an Agent-based Integration
- Create an API Integration
- Create a Log Pipeline
- Integration Assets Reference
- Build a Marketplace Offering
- Create a Tile
- Create an Integration Dashboard
- Create a Recommended Monitor
- Create a Cloud SIEM Detection Rule
- OAuth for Integrations
- Install Agent Integration Developer Tool
- Service Checks
- IDE Plugins
- Community
- Guides
- API
- Datadog Mobile App
- CoScreen
- Cloudcraft
- In The App
- Dashboards
- Notebooks
- DDSQL Editor
- Sheets
- Monitors and Alerting
- Infrastructure
- Metrics
- Watchdog
- Bits AI
- Service Catalog
- API Catalog
- Error Tracking
- Service Management
- Infrastructure
- Application Performance
- APM
- Continuous Profiler
- Database Monitoring
- Data Streams Monitoring
- Data Jobs Monitoring
- Digital Experience
- Real User Monitoring
- Product Analytics
- Synthetic Testing and Monitoring
- Continuous Testing
- Software Delivery
- CI Visibility
- CD Visibility
- Test Optimization
- Code Analysis
- Quality Gates
- DORA Metrics
- Security
- Security Overview
- Cloud SIEM
- Cloud Security Management
- Application Security Management
- AI Observability
- Log Management
- Observability Pipelines
- Log Management
- Administration
Add Custom Measures To Your Tests
CI Visibility is not available in the selected site () at this time.
Overview
Before you begin, make sure that Test Optimization is already set up for your language. This guide walks you through adding and using custom measures for your tests.
Add the custom measure to your test
Add the custom measure to your test. The native instrumentation allows you to use the programmatic API:
  it('sum function can sum', () => {
    const testSpan = require('dd-trace').scope().active()
    testSpan.setTag('test.memory.rss', process.memoryUsage().rss)
    // test continues normally
    // ...
  })
To add custom metrics, include the opentracing-util library as a compile-time dependency to your project.
import io.opentracing.Span;
import io.opentracing.util.GlobalTracer;

// ...
// inside your test
final Span span = GlobalTracer.get().activeSpan();
if (span != null) {
  span.setTag("test.memory.usage", 1e8);
}
// test continues normally
// ...
from ddtrace import tracer
import os, psutil

# Declare `ddspan` as argument to your test
def test_simple_case(ddspan):
    # Set your tags
    process = psutil.Process()
    ddspan.set_tag("test.memory.rss", process.memory_info().rss)
    # test continues normally
    # ...
// inside your test
var scope = Tracer.Instance.ActiveScope; // from Datadog.Trace;
if (scope != null) {
    scope.Span.SetTag("test.memory.usage", 1e8);
}
// test continues normally
// ...
require 'datadog/ci'

# inside your test
Datadog::CI.active_test&.set_tag('test.memory.usage', 1e8)
# test continues normally
# ...
For datadog-ci, use the DD_MEASURES environment variable or --measures CLI argument:
DD_MEASURES="test.memory.usage:1000" datadog-ci junit upload --service my-service --measures test.request.rate:30 report.xml
Create a facet
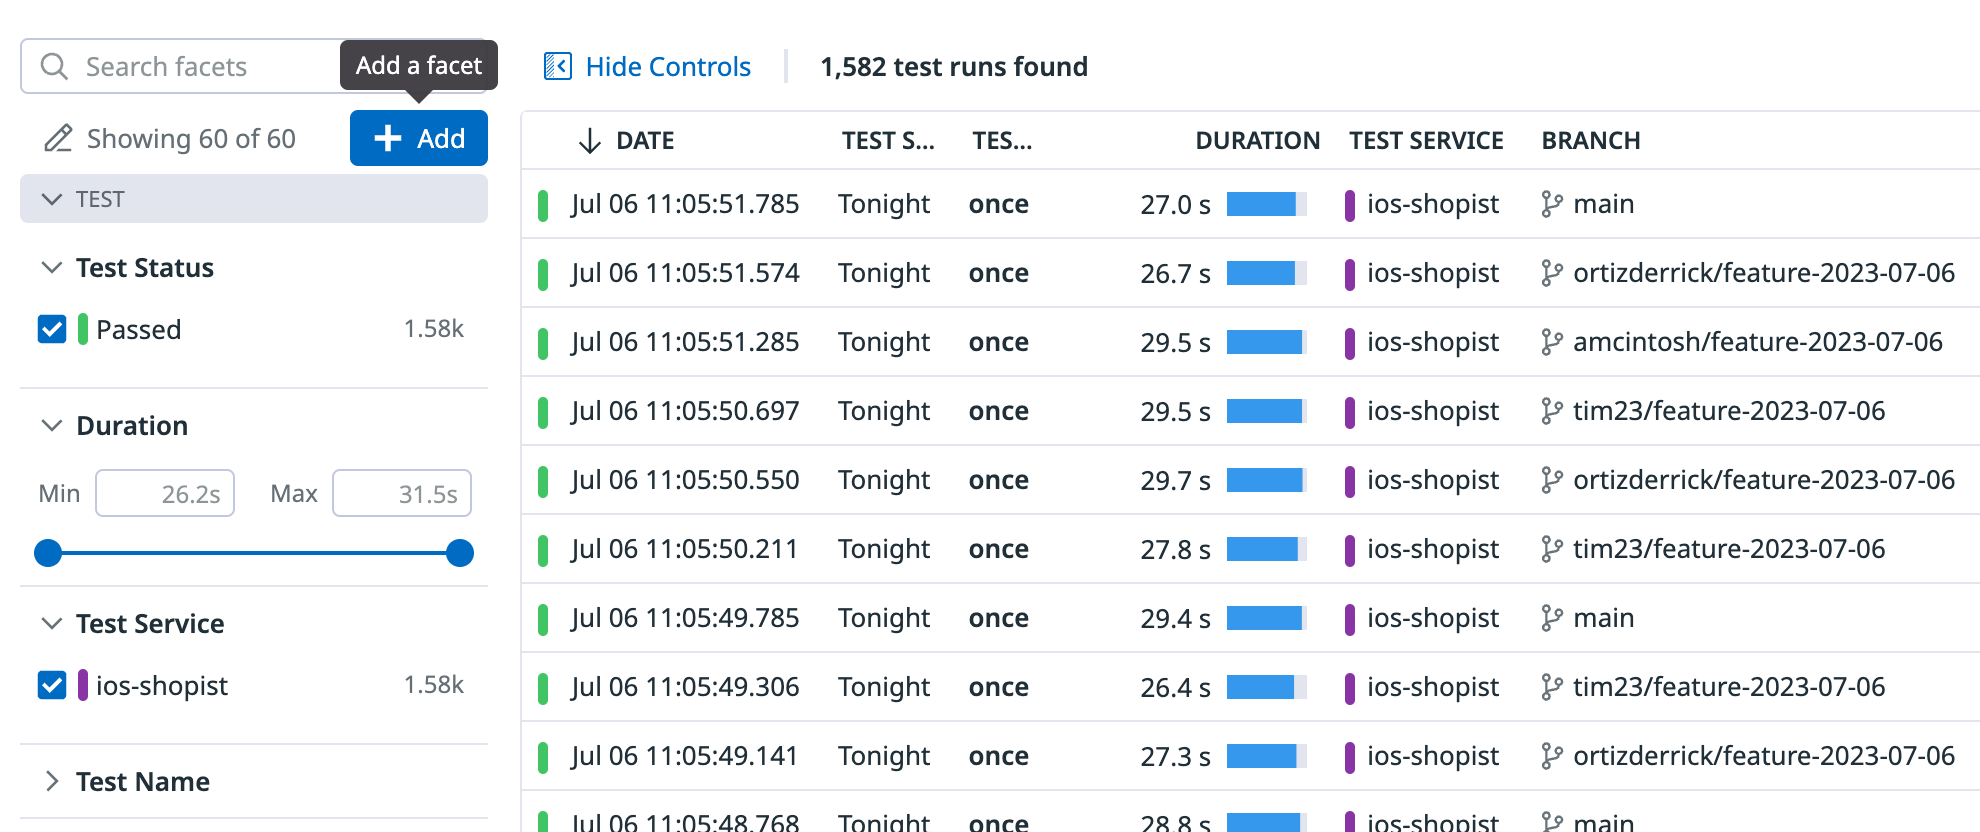
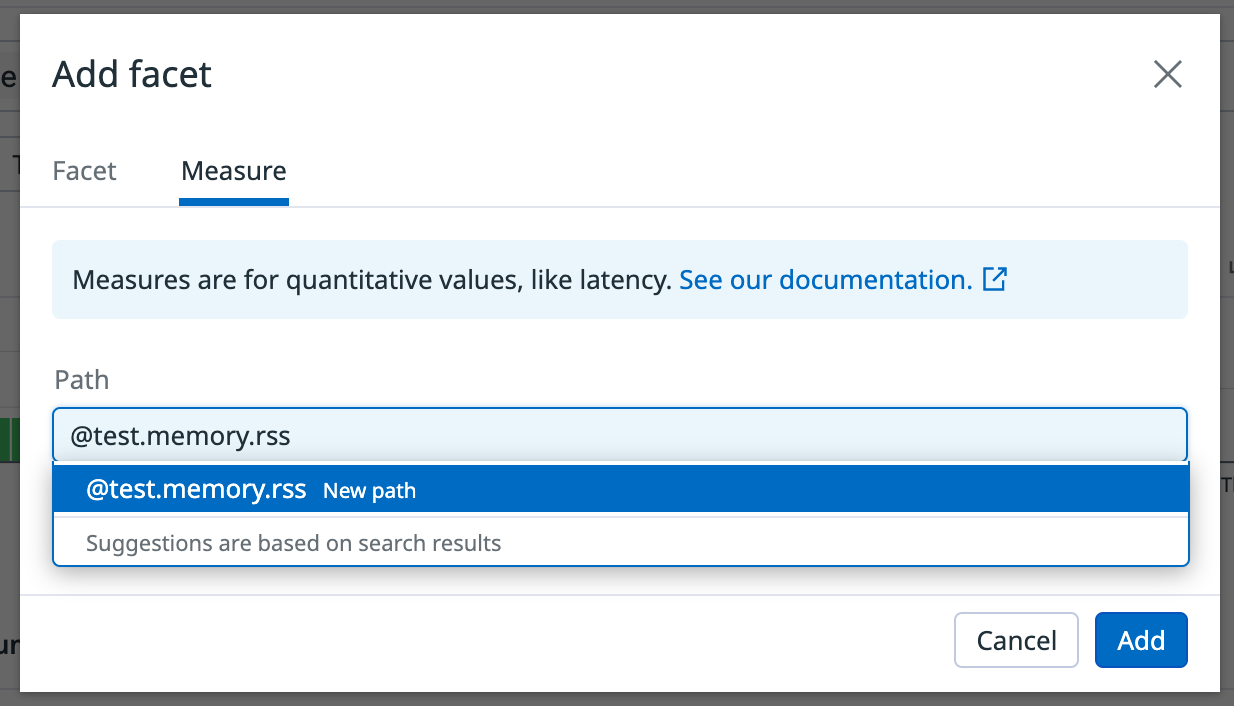
Create a facet for the custom measure you added to the test by navigating to the Test Runs page and clicking + Add on the facet list.
Make sure that the type of facet is Measure, which represents a numerical value:
Click Add to start using your custom measure.
Graph the evolution of your measure
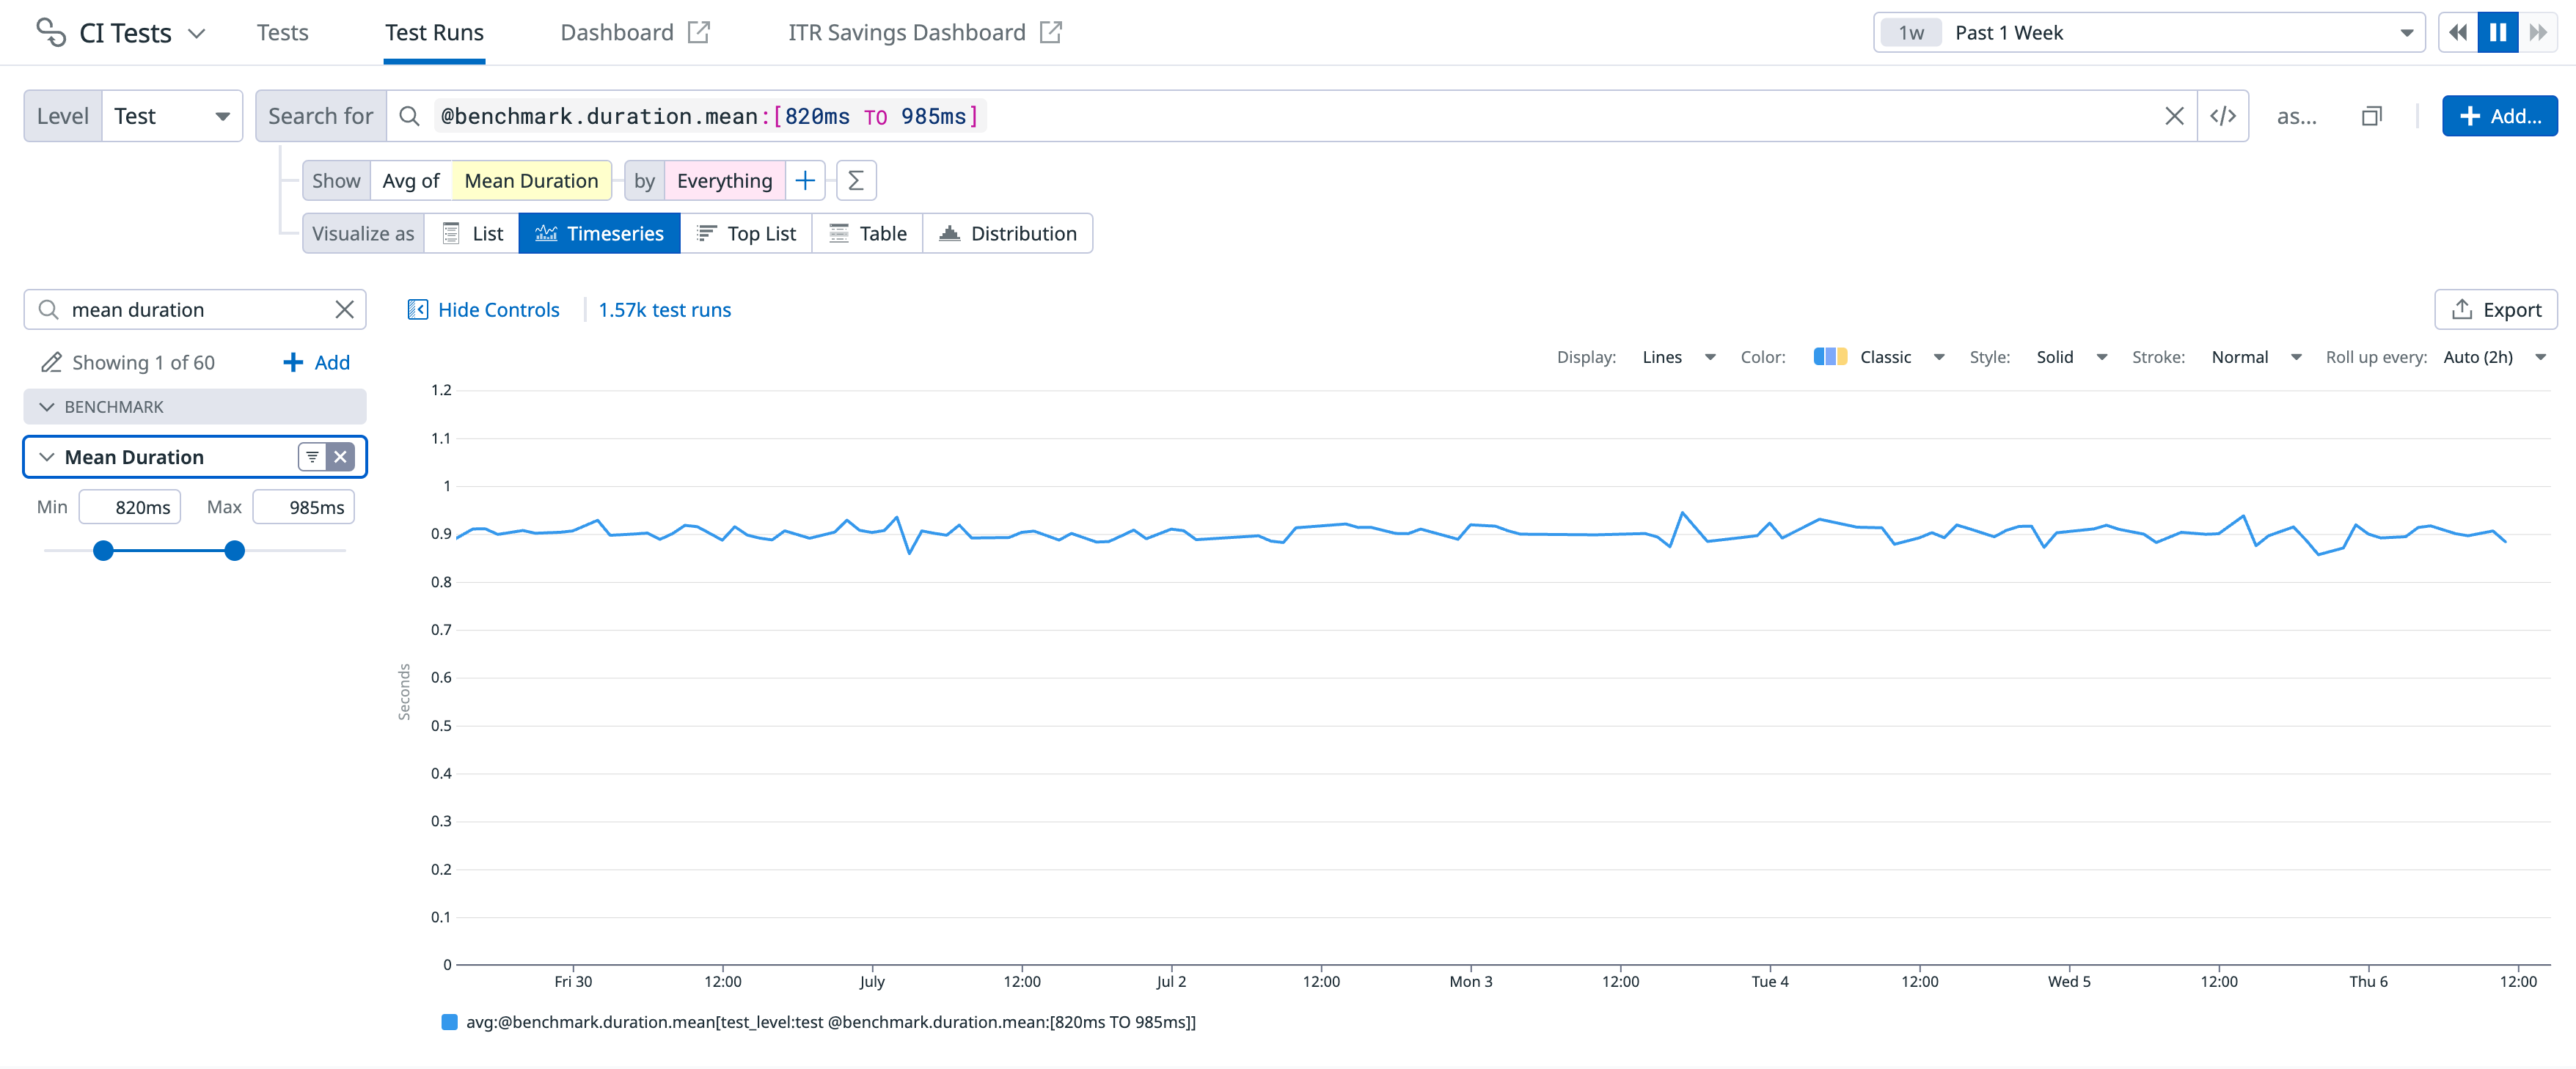
Plot the evolution of your measure across time by selecting the Timeseries visualization:
For example, you can use this visualization to track the evolution of the memory usage in your tests.
Export your graph
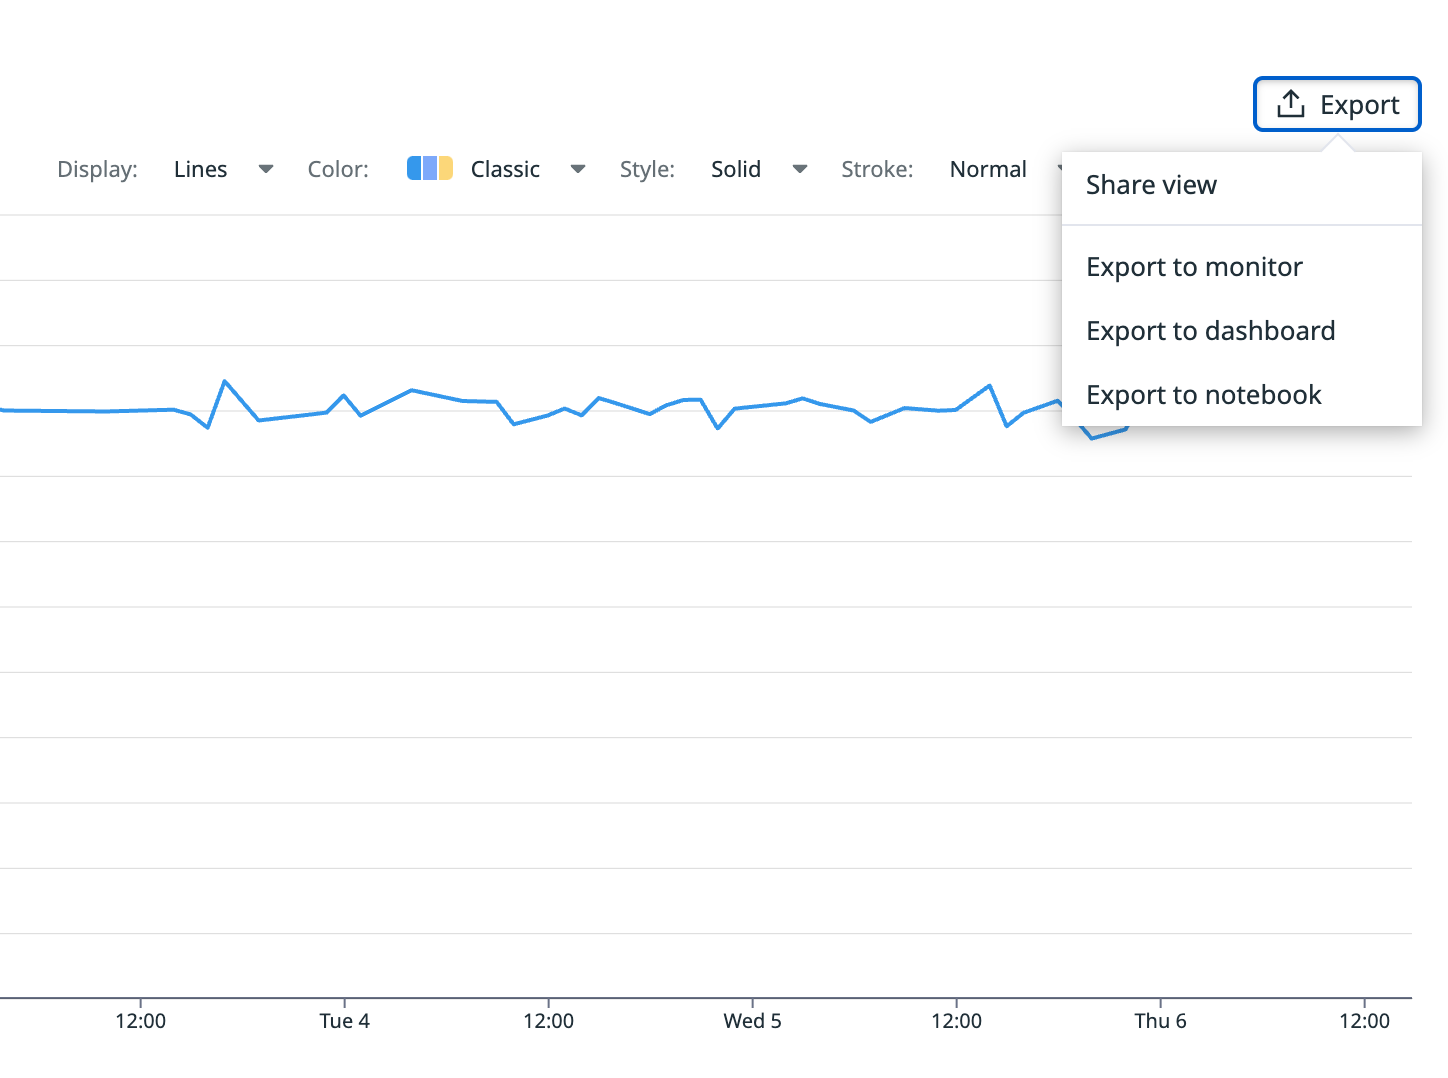
You can export your graph to a dashboard or a notebook, and create a monitor based on it by clicking the Export button.
Add a monitor
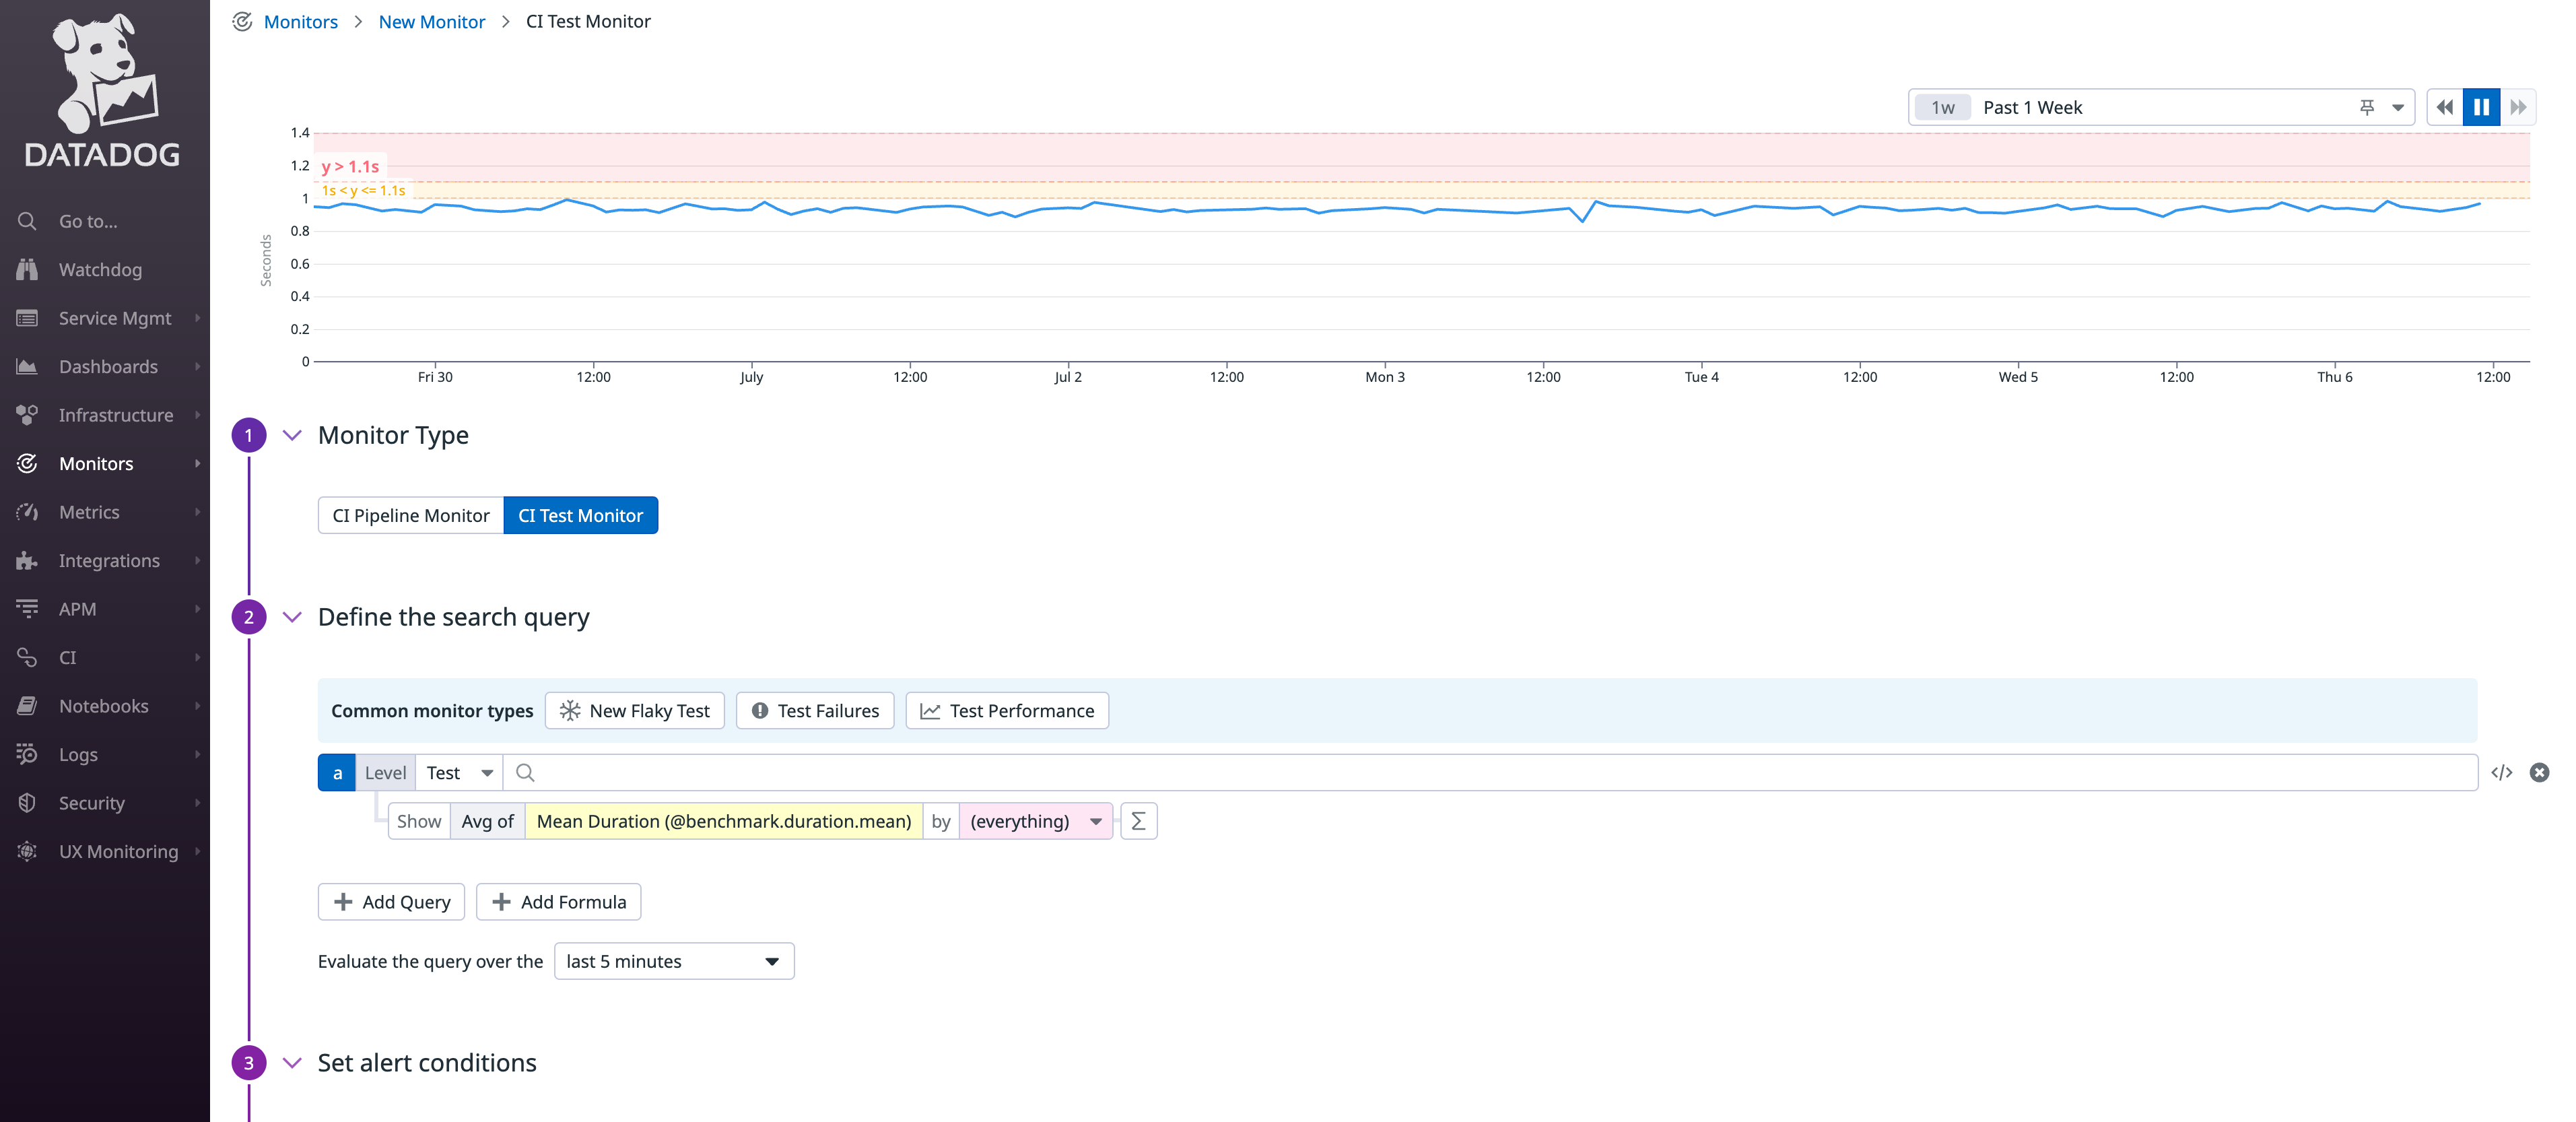
Get alerted if the value of your measure goes above or below a certain threshold by creating a CI Tests Monitor.
For example, you can use this type of alert to inform you about the memory usage reaching a certain threshold.
Further reading
Additional helpful documentation, links, and articles:
