- Essentials
- Getting Started
- Datadog
- Datadog Site
- DevSecOps
- Serverless for AWS Lambda
- Agent
- Integrations
- Containers
- Dashboards
- Monitors
- Logs
- APM Tracing
- Profiler
- Tags
- API
- Service Catalog
- Session Replay
- Continuous Testing
- Synthetic Monitoring
- Incident Management
- Database Monitoring
- Cloud Security Management
- Cloud SIEM
- Application Security Management
- Workflow Automation
- CI Visibility
- Test Visibility
- Test Impact Analysis
- Code Analysis
- Learning Center
- Support
- Glossary
- Standard Attributes
- Guides
- Agent
- Integrations
- OpenTelemetry
- Developers
- Authorization
- DogStatsD
- Custom Checks
- Integrations
- Create an Agent-based Integration
- Create an API Integration
- Create a Log Pipeline
- Integration Assets Reference
- Build a Marketplace Offering
- Create a Tile
- Create an Integration Dashboard
- Create a Recommended Monitor
- Create a Cloud SIEM Detection Rule
- OAuth for Integrations
- Install Agent Integration Developer Tool
- Service Checks
- IDE Plugins
- Community
- Guides
- API
- Datadog Mobile App
- CoScreen
- Cloudcraft
- In The App
- Dashboards
- Notebooks
- DDSQL Editor
- Sheets
- Monitors and Alerting
- Infrastructure
- Metrics
- Watchdog
- Bits AI
- Service Catalog
- API Catalog
- Error Tracking
- Service Management
- Infrastructure
- Application Performance
- APM
- Continuous Profiler
- Database Monitoring
- Data Streams Monitoring
- Data Jobs Monitoring
- Digital Experience
- Real User Monitoring
- Product Analytics
- Synthetic Testing and Monitoring
- Continuous Testing
- Software Delivery
- CI Visibility
- CD Visibility
- Test Optimization
- Code Analysis
- Quality Gates
- DORA Metrics
- Security
- Security Overview
- Cloud SIEM
- Cloud Security Management
- Application Security Management
- AI Observability
- Log Management
- Observability Pipelines
- Log Management
- Administration
Trace Sampling Use Cases
Overview
Trace data tends to be repetitive. A problem in your application is rarely identified in only one trace and no others. For high throughput services, particularly for incidents that require your attention, an issue shows symptoms repeatedly in multiple traces. Consequently, there’s usually no need for you to collect every single trace for a service or endpoint, or every span within a trace. Datadog APM ingestion control mechanisms help you keep the visibility that you need to troubleshoot problems, while cutting down the noise and managing costs.
Ingestion mechanisms are configurations within the Datadog Agent and Datadog tracing libraries. If you are using OpenTelemetry SDKs to instrument your applications, read Ingestion Sampling with OpenTelemetry.
This guide helps you understand when and how to use ingestion control configurations depending on the main use cases you might encounter. It covers:
- Determining which ingestion mechanisms are used for a given service
- Use cases that focus on keeping particular types of traces
- Use cases that focus on reducing ingested traces
Determining which ingestion mechanisms are used
To identify which ingestion mechanisms are currently used in your Datadog environment, navigate to the Ingestion Control Page.
The table gives insights on ingested volumes by service. The Configuration column provides a first indication of the current set up. It shows:
AUTOMATICif the sampling rate calculated in the Datadog Agent is applied to the traces that start from the service. Read more about the specifics of Datadog Agent ingestion logic.CONFIGUREDif a custom trace sampling rate configured in the tracing library is applied to the traces that start from the service.
Click on services to see details about what sampling decision makers (for example Agent or tracing library, rules or sample rates) are used for each service, as well as what ingestion sampling mechanisms are leveraged for ingested spans’ services.
In the Service Ingestion Summary example above, the Ingestion reasons breakdown table shows that most of the ingestion reasons for this service come from rule (user defined sampling rule).
The Top sampling decision makers for this service show that web-store service gets sampling decisions from web-store, shopist-web-ui, shipping-worker, synthetics-browser, and product-recommendation. These five services all contribute in the overall sampling decisions that affect the web-store service spans. When determining how to fine tune the ingestion for web-store, all five services need to be considered.
Keeping certain types of traces
Keeping entire transaction traces
Ingesting entire transaction traces ensures visibility over the end-to-end service request flow for specific individual requests.
Solution: Head-based sampling
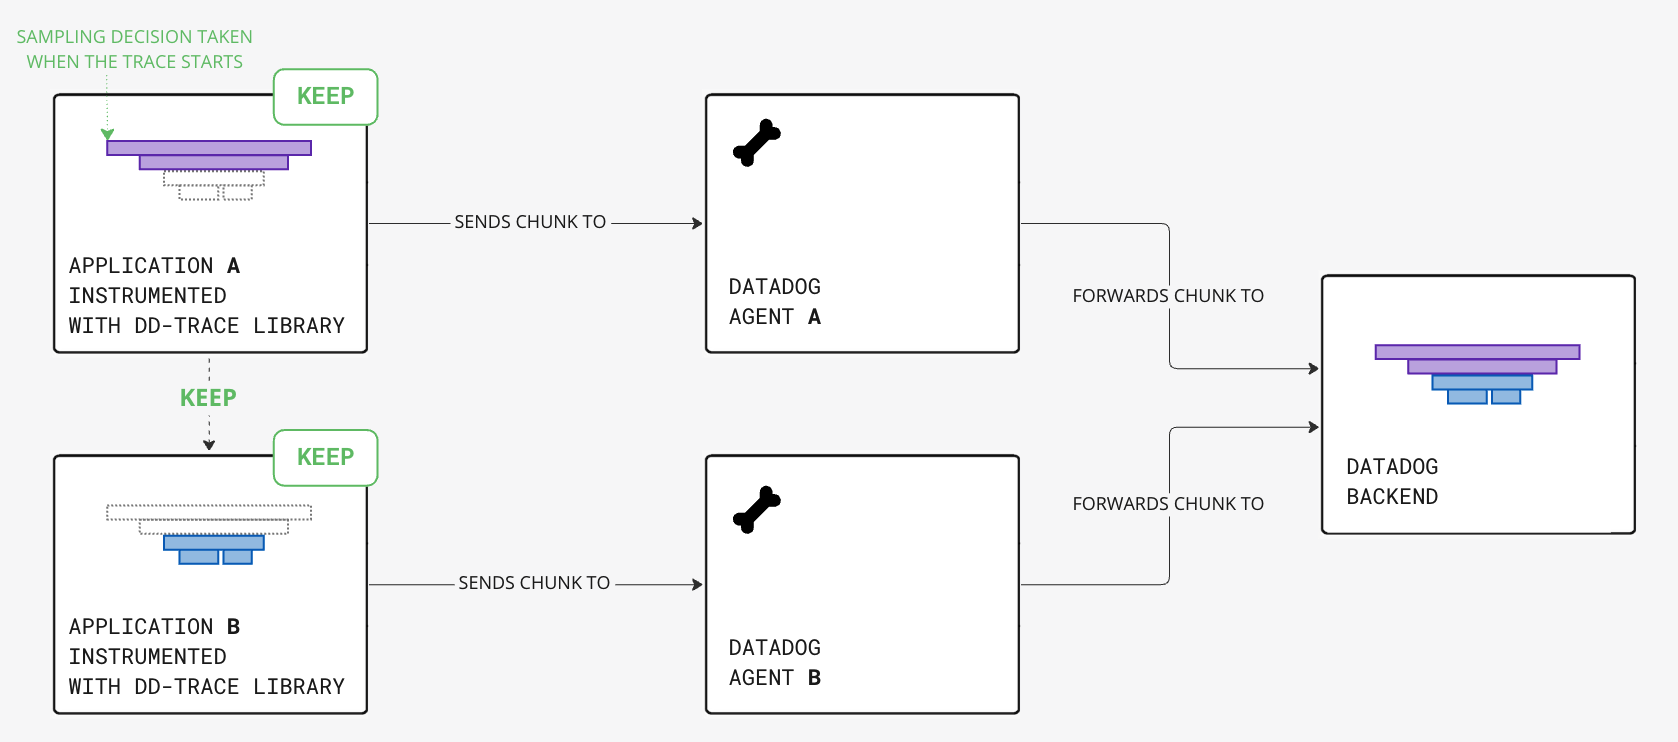
Complete traces can be ingested with head-based sampling mechanisms: the decision to keep or drop the trace is determined from the first span of the trace, the head, when the trace is created. This decision is propagated through the request context to downstream services.
To decide which traces to keep and drop, the Datadog Agent computes default sampling rates for each service to apply at trace creation, based on the application traffic:
- For low-traffic applications, a sampling rate of 100% is applied.
- For high-traffic applications, a lower sampling rate is applied with a target of 10 complete traces per second per Agent.
You can also override the default Agent sampling rate by configuring the sampling rate by service. See how to keep more traces for specific services for more information.
Configuring head-based sampling
Default sampling rates are calculated to target 10 complete traces per second, per Agent. This is a target number of traces and is the result of averaging traces over a period of time. It is not a hard limit, and traffic spikes can cause significantly more traces to be sent to Datadog for short periods of time.
You can increase or decrease this target by configuring the Datadog Agent parameter max_traces_per_second or the environment variable DD_APM_MAX_TPS. Read more about head-based sampling ingestion mechanisms.
Note: Changing an Agent configuration impacts the percentage sampling rates for all services reporting traces to this Datadog Agent.
For most scenarios, this Agent-level configuration stays within the allotted quota, provides enough visibility into your application’s performance, and helps you make appropriate decisions for your business.
Keeping more traces for specific services or resources
If some services and requests are critical to your business, you want higher visibility into them. You may want to send all related traces to Datadog so that you can look into any of the individual transactions.
Solution: Sampling rules
By default, sampling rates are calculated to target 10 traces per second per Datadog Agent. You can override the default calculated sampling rate by configuring sampling rules in the tracing library.
You can configure sampling rules by service. For traces that start from the rule’s specified service, the defined percentage sampling rate is applied instead of the Agent’s default sampling rate.
Configuring a sampling rule
You can configure sampling rules by setting the environment variable DD_TRACE_SAMPLING_RULES.
For example, to send 20 percent of the traces for the service named my-service:
DD_TRACE_SAMPLING_RULES='[{"service": "my-service", "sample_rate": 0.2}]'
Read more about sampling rules ingestion mechanisms.
Keeping more error-related traces
Traces with error spans are often symptoms of system failures. Keeping a higher proportion of transactions with errors ensures that you always have access to some relevant individual requests.
Solution: Error sampling rate
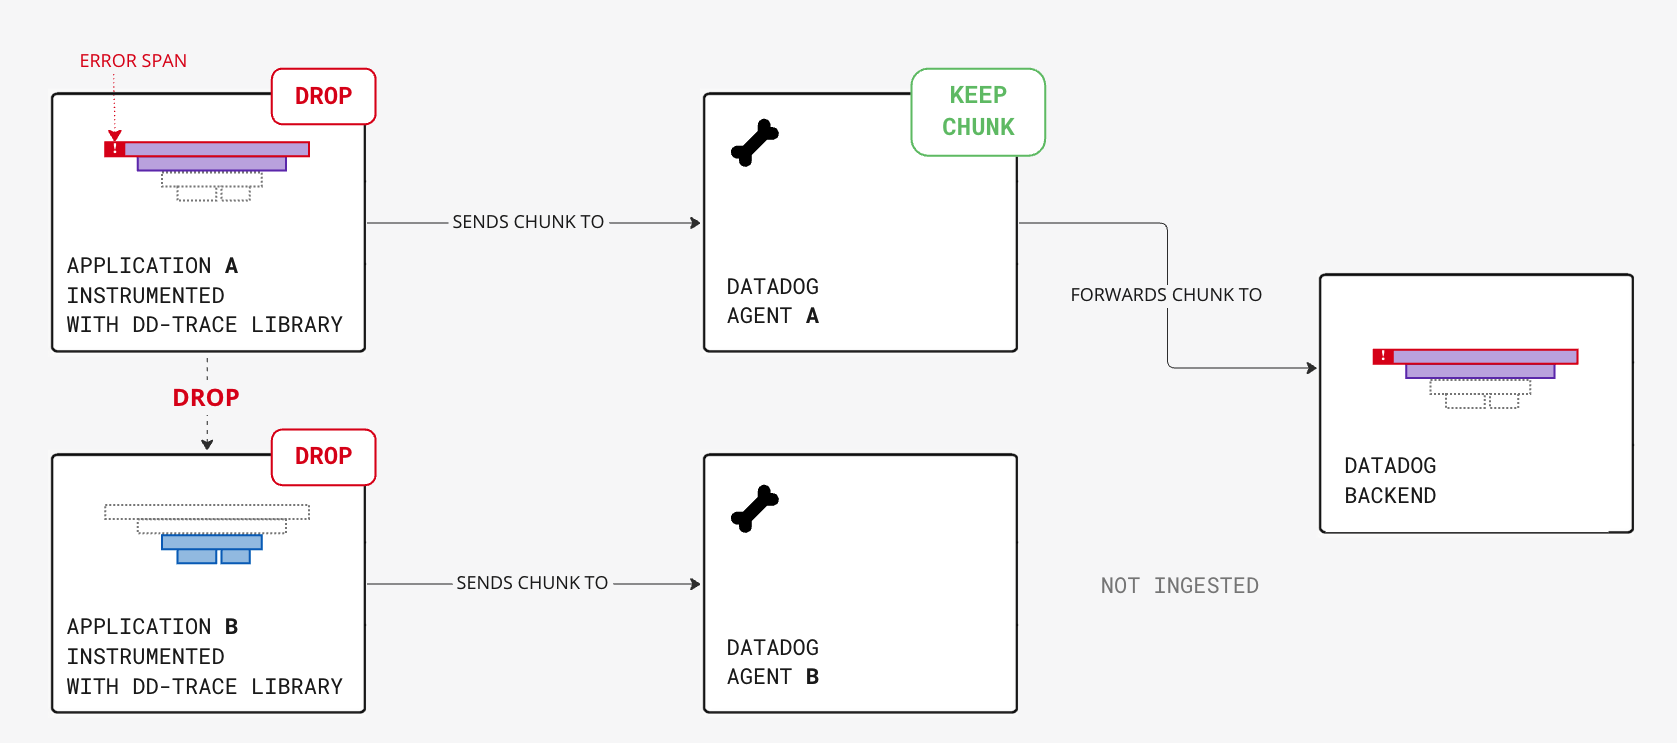
In addition to head-based sampled traces, you can increase the error sampling rate so that each Agent keeps additional error spans even if the related traces are not kept by head-based sampling.
Notes:
- Distributed pieces of the trace chunks might not be ingested as the sampling happens locally at the Datadog Agent level.
- Starting with Datadog Agent 6/7.41.0 and higher,
DD_APM_FEATURES=error_rare_sample_tracer_dropcan be set to include spans dropped by tracing library rules ormanual.drop. More details can be found in the Error traces section of the Ingestion Mechanisms doc.
Configuring error sampling
You can configure the number of error chunks per second per Agent to capture by setting the environment variable DD_APM_ERROR_TPS. The default value is 10 errors per second. To ingest all errors, set it to an arbitrary high value. To disable error sampling, set DD_APM_ERROR_TPS to 0.
Reducing ingestion for high volume services
Reducing volume from database or cache services
Traced database calls can represent a large amount of ingested data while the application performance metrics (such as error counts, request hit counts, and latency) are enough to monitor database health.
Solution: Sampling rules for traces with database calls
To reduce the span volume created by tracing database calls, configure the sampling at the head of the trace.
Database services rarely start a trace. Usually, client database spans are children of an instrumented backend service span.
To know which services start database traces, use the Top Sampling Decision Makers top list graph on the ingestion control page Service Ingestion Summary. Configuring head-based sampling for these specific services reduces the volume of ingested database spans, while making sure that no incomplete traces are ingested. The distributed traces are either kept or dropped altogether.
For instance, for the traced database calls of web-store-mongo, traces originate from services web-store and shipping-worker 99% of the time. As a result, to reduce the volume for web-store-mongo, configure sampling for web-store and shipping-worker services.
Configure sampling to drop database spans
Refer to the sampling rule configuration section for more information about sampling rules syntax.
The backend service web-store is calling a Mongo database multiple times per trace, and it’s creating a lot of unwanted span volume:
Configure a trace sampling rule for the backend service
web-store, ensuring 10 percent of entire traces are kept, including Mongo spans.DD_TRACE_SAMPLING_RULES='[{"service": "web-store", "sample_rate": 0.1}]'Optionally, if you want to keep all the
web-storespans, configure a single span sampling rule to keep 100 percent of the spans for the backend serviceweb-store. This sampling does not ingest any database call spans outside of the 10 percent identified above.DD_SPAN_SAMPLING_RULES='[{"service": "web-store", "sample_rate": 1}]'Note: Configuring a single span sampling rule is especially useful if you are using span-based metrics, which are derived from ingested spans.
Further Reading
Additional helpful documentation, links, and articles:


