- Essentials
- Getting Started
- Datadog
- Datadog Site
- DevSecOps
- Serverless for AWS Lambda
- Agent
- Integrations
- Containers
- Dashboards
- Monitors
- Logs
- APM Tracing
- Profiler
- Tags
- API
- Service Catalog
- Session Replay
- Continuous Testing
- Synthetic Monitoring
- Incident Management
- Database Monitoring
- Cloud Security Management
- Cloud SIEM
- Application Security Management
- Workflow Automation
- CI Visibility
- Test Visibility
- Test Impact Analysis
- Code Analysis
- Learning Center
- Support
- Glossary
- Standard Attributes
- Guides
- Agent
- Integrations
- OpenTelemetry
- Developers
- Authorization
- DogStatsD
- Custom Checks
- Integrations
- Create an Agent-based Integration
- Create an API Integration
- Create a Log Pipeline
- Integration Assets Reference
- Build a Marketplace Offering
- Create a Tile
- Create an Integration Dashboard
- Create a Recommended Monitor
- Create a Cloud SIEM Detection Rule
- OAuth for Integrations
- Install Agent Integration Developer Tool
- Service Checks
- IDE Plugins
- Community
- Guides
- API
- Datadog Mobile App
- CoScreen
- Cloudcraft
- In The App
- Dashboards
- Notebooks
- DDSQL Editor
- Sheets
- Monitors and Alerting
- Infrastructure
- Metrics
- Watchdog
- Bits AI
- Service Catalog
- API Catalog
- Error Tracking
- Service Management
- Infrastructure
- Application Performance
- APM
- Continuous Profiler
- Database Monitoring
- Data Streams Monitoring
- Data Jobs Monitoring
- Digital Experience
- Real User Monitoring
- Product Analytics
- Synthetic Testing and Monitoring
- Continuous Testing
- Software Delivery
- CI Visibility
- CD Visibility
- Test Optimization
- Code Analysis
- Quality Gates
- DORA Metrics
- Security
- Security Overview
- Cloud SIEM
- Cloud Security Management
- Application Security Management
- AI Observability
- Log Management
- Observability Pipelines
- Log Management
- Administration
Trace Queries
Overview
With Trace Queries, you can find entire traces based on the properties of multiple spans and the relationships between those spans within the structure of the trace. To create a trace query, you define two or more span queries and then specify the relationship within the searched-for trace structure of the spans that are returned by each span query.
You can search, filter, group, and visualize the traces from the Trace Query explorer.
With structure-based trace querying, you can answer questions such as:
- Which traces include a dependency between two services (
service Ahas a downstream call toservice B)? - What API endpoints are affected by my erroring backend service?
Use Trace Queries to accelerate your investigations and find relevant traces.
Trace query editor
A trace query is composed of two or more span queries, joined by trace query operators.
Span queries
Query for spans from a specific environment, service, or endpoint using the Span query syntax. Use autocomplete suggestions to view facets and recent queries.
Click Add another span query to add a span query and use it in the trace query statement.
Trace query operators
Combine multiple span queries, labeled a, b, c, and so on, into a trace query in the Traces matching field, using operators between the letters that represent each span query:
| Operator | Description | Example |
|---|---|---|
&& | And: Both spans are in the trace | Traces that contain spans from the service web-store and spans from the service payments-go:service:web-store && service:payments-go |
|| | Or: One or the other span are in the trace | Traces that contain spans from the service web-store or from the service mobile-store:service:web-store || service:mobile-store |
-> | Indirect relationship: Traces that contain a span matching the left query that is upstream of spans matching the right query | Traces where the service checkoutservice is upstream of the service quoteservice:service:checkoutservice -> service:quoteservice |
=> | Direct relationship: Traces that contain a span matching the left query that is the direct parent of a span matching the right query | Traces where the service checkoutservice is directly calling the service shippingservice:service:checkoutservice => service:shippingservice |
NOT | Exclusion: Traces that do not contain spans matching the query | Traces that contain spans from the service web-store, but not from the service payments-go:service:web-store && NOT(service:payments-go) |
Trace-level filters
Filter the result set of traces further by applying filters on trace-level attributes like the number of spans or the end-to-end duration of the trace in the Where statement:
| Filter | Description | Example |
|---|---|---|
span_count(a) | Number of occurrences of a span | Traces that contain more than 10 calls to a mongo database: - queryA: service:web-store-mongo @db.statement:"SELECT * FROM stores- Traces matching: a- Where: span_count(a):>10 |
total_span_count | Number of spans in the trace | Traces that contain more than 1000 spans: Where total_span_count:>1000 |
trace_duration | End to end trace duration | Traces for which the end-to-end execution time is more than 5 seconds : Where: trace_duration:>2s |
Flow Map
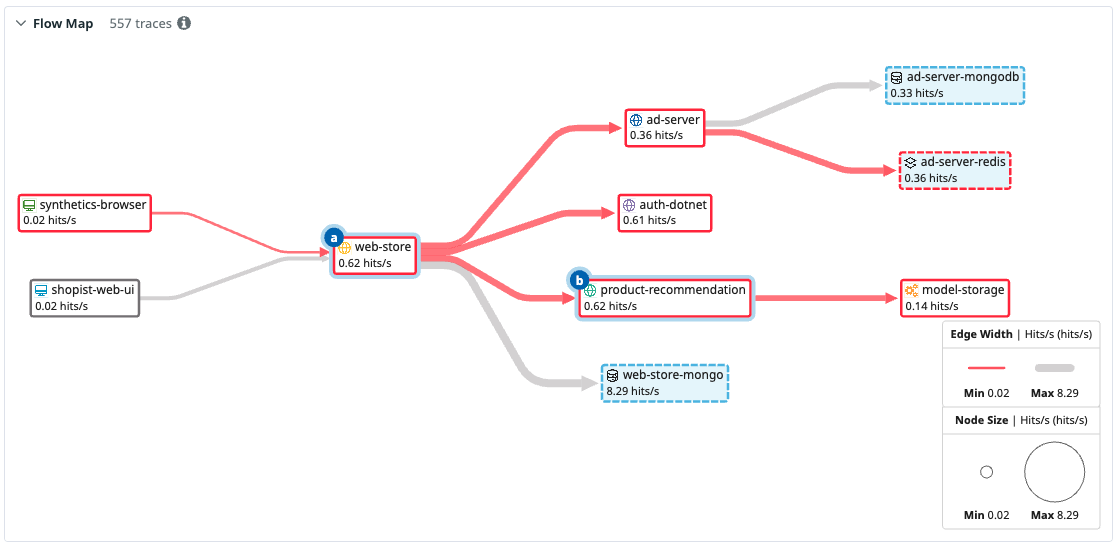
The Flow Map helps you understand the request path and service dependencies from the resulting traces that match the Trace Query. Use the map to identify error paths, unusual service dependencies, or abnormally high request rates to a database.
Note: The Flow Map is powered by a sample of the ingested traffic.
Service nodes that match span queries are highlighted to show you which parts of the trace your query conditions are targeting.
To get more information about a single service, hover on the service’s node to see its metrics for request rate and error rate. To see metrics for the request rate and the error rate between two services, hover on an edge connecting the two services.
To filter out traces that do not contain a dependency on a particular service, click on the service’s node on the map.
Trace list
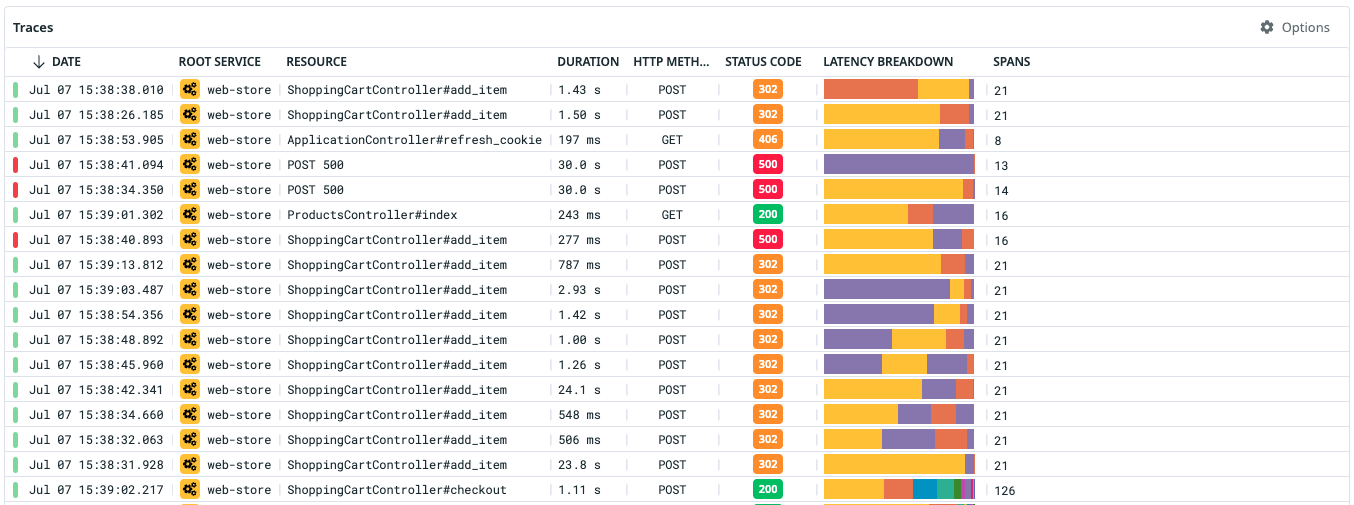
The Trace list shows up to fifty sample traces that match the query and are within the selected time range. Hover on the Latency Breakdown to get a sense of where (in which services) time is spent during the request execution.
Note: Information displayed in the table are attributes from the root span of the trace, including the duration, which does not represent the end-to-end duration of the trace.
Analytics
Select one of the other visualizations, such as Timeseries, Top List, or Table to aggregate results over time, grouped by one or multiple dimensions. Read Span Visualizations for more information on the aggregation options.
In addition to those aggregation options, you must also select which span query (a, b, c, and so on) you want to aggregate the spans from. Select the query that matches the spans from which you’re using the tags and attributes in the aggregation options.
For example, if you query for traces that contain a span from the service web-store (query a) and a span from the service payments-go with some errors (query b), and you visualize a count of spans grouped by @merchant.tier, use spans from query a, because merchant.tier is an attribute from the spans of the service web-store, not from the service payments-go.
How Trace Queries source data
Datadog uses the Intelligent Retention Filter to index data for Trace Queries. It does so by performing:
- Flat sampling: A uniform 1% sample of ingested spans.
- Diversity sampling: A representative, diverse selection of traces to keep visibility over each environment, service, operation, and resource.
These two sampling mechanisms capture complete traces, meaning that all spans of a trace are always indexed to ensure that Trace Queries return accurate results.
Note: Spans indexed by flat sampling and diversity sampling do not count towards the usage of indexed spans, and therefore, do not impact your bill.
1% flat sampling
retained_by:flat_sampled
Flat 1% sampling is applied based on the trace_id, meaning that all spans belonging to the same trace share the same sampling decision. To learn more, read the one percent flat sampling documentation.
Diversity sampling
retained_by:diversity_sampling
Every 15 minutes, diversity sampling retains at least one span and the associated trace for each combination of environment, service, operation, and resource. This occurs for the p75, p90, and p95 percentile of latencies to ensure that you can always find example traces in service and resource pages, even for low traffic endpoints. To learn more, read the diversity sampling documentation.
Further Reading
Additional helpful documentation, links, and articles:


