- Essentials
- Getting Started
- Agent
- API
- APM Tracing
- Containers
- Dashboards
- Database Monitoring
- Datadog
- Datadog Site
- DevSecOps
- Incident Management
- Integrations
- Logs
- Monitors
- OpenTelemetry
- Profiler
- Session Replay
- Security
- Serverless for AWS Lambda
- Software Catalog
- Software Delivery
- Synthetic Monitoring and Testing
- Tags
- Workflow Automation
- Learning Center
- Support
- Glossary
- Standard Attributes
- Guides
- Agent
- Integrations
- Developers
- Authorization
- DogStatsD
- Custom Checks
- Integrations
- Create an Agent-based Integration
- Create an API Integration
- Create a Log Pipeline
- Integration Assets Reference
- Build a Marketplace Offering
- Create a Tile
- Create an Integration Dashboard
- Create a Monitor Template
- Create a Cloud SIEM Detection Rule
- OAuth for Integrations
- Install Agent Integration Developer Tool
- Service Checks
- IDE Plugins
- Community
- Guides
- OpenTelemetry
- Administrator's Guide
- API
- Partners
- Datadog Mobile App
- DDSQL Reference
- CoScreen
- CoTerm
- Cloudcraft (Standalone)
- In The App
- Dashboards
- Notebooks
- DDSQL Editor
- Reference Tables
- Sheets
- Monitors and Alerting
- Metrics
- Watchdog
- Bits AI
- Internal Developer Portal
- Error Tracking
- Change Tracking
- Service Management
- Actions & Remediations
- Infrastructure
- Cloudcraft
- Resource Catalog
- Universal Service Monitoring
- Hosts
- Containers
- Processes
- Serverless
- Network Monitoring
- Cloud Cost
- Application Performance
- APM
- APM Terms and Concepts
- Application Instrumentation
- APM Metrics Collection
- Trace Pipeline Configuration
- Correlate Traces with Other Telemetry
- Trace Explorer
- Recommendations
- Code Origins for Spans
- Service Observability
- Endpoint Observability
- Dynamic Instrumentation
- Live Debugger
- Error Tracking
- Data Security
- Guides
- Troubleshooting
- Continuous Profiler
- Database Monitoring
- Agent Integration Overhead
- Setup Architectures
- Setting Up Postgres
- Setting Up MySQL
- Setting Up SQL Server
- Setting Up Oracle
- Setting Up Amazon DocumentDB
- Setting Up MongoDB
- Connecting DBM and Traces
- Data Collected
- Exploring Database Hosts
- Exploring Query Metrics
- Exploring Query Samples
- Exploring Database Schemas
- Exploring Recommendations
- Troubleshooting
- Guides
- Data Streams Monitoring
- Data Jobs Monitoring
- Digital Experience
- Real User Monitoring
- Synthetic Testing and Monitoring
- Continuous Testing
- Product Analytics
- Software Delivery
- CI Visibility
- CD Visibility
- Test Optimization
- Quality Gates
- DORA Metrics
- Security
- Security Overview
- Cloud SIEM
- Code Security
- Cloud Security
- App and API Protection
- Workload Protection
- Sensitive Data Scanner
- AI Observability
- Log Management
- Observability Pipelines
- Log Management
- Administration
Exception Replay in Error Tracking
Exception Replay for APM Error Tracking is generally available for Python, and in Preview for Java, .NET, and PHP.
Overview
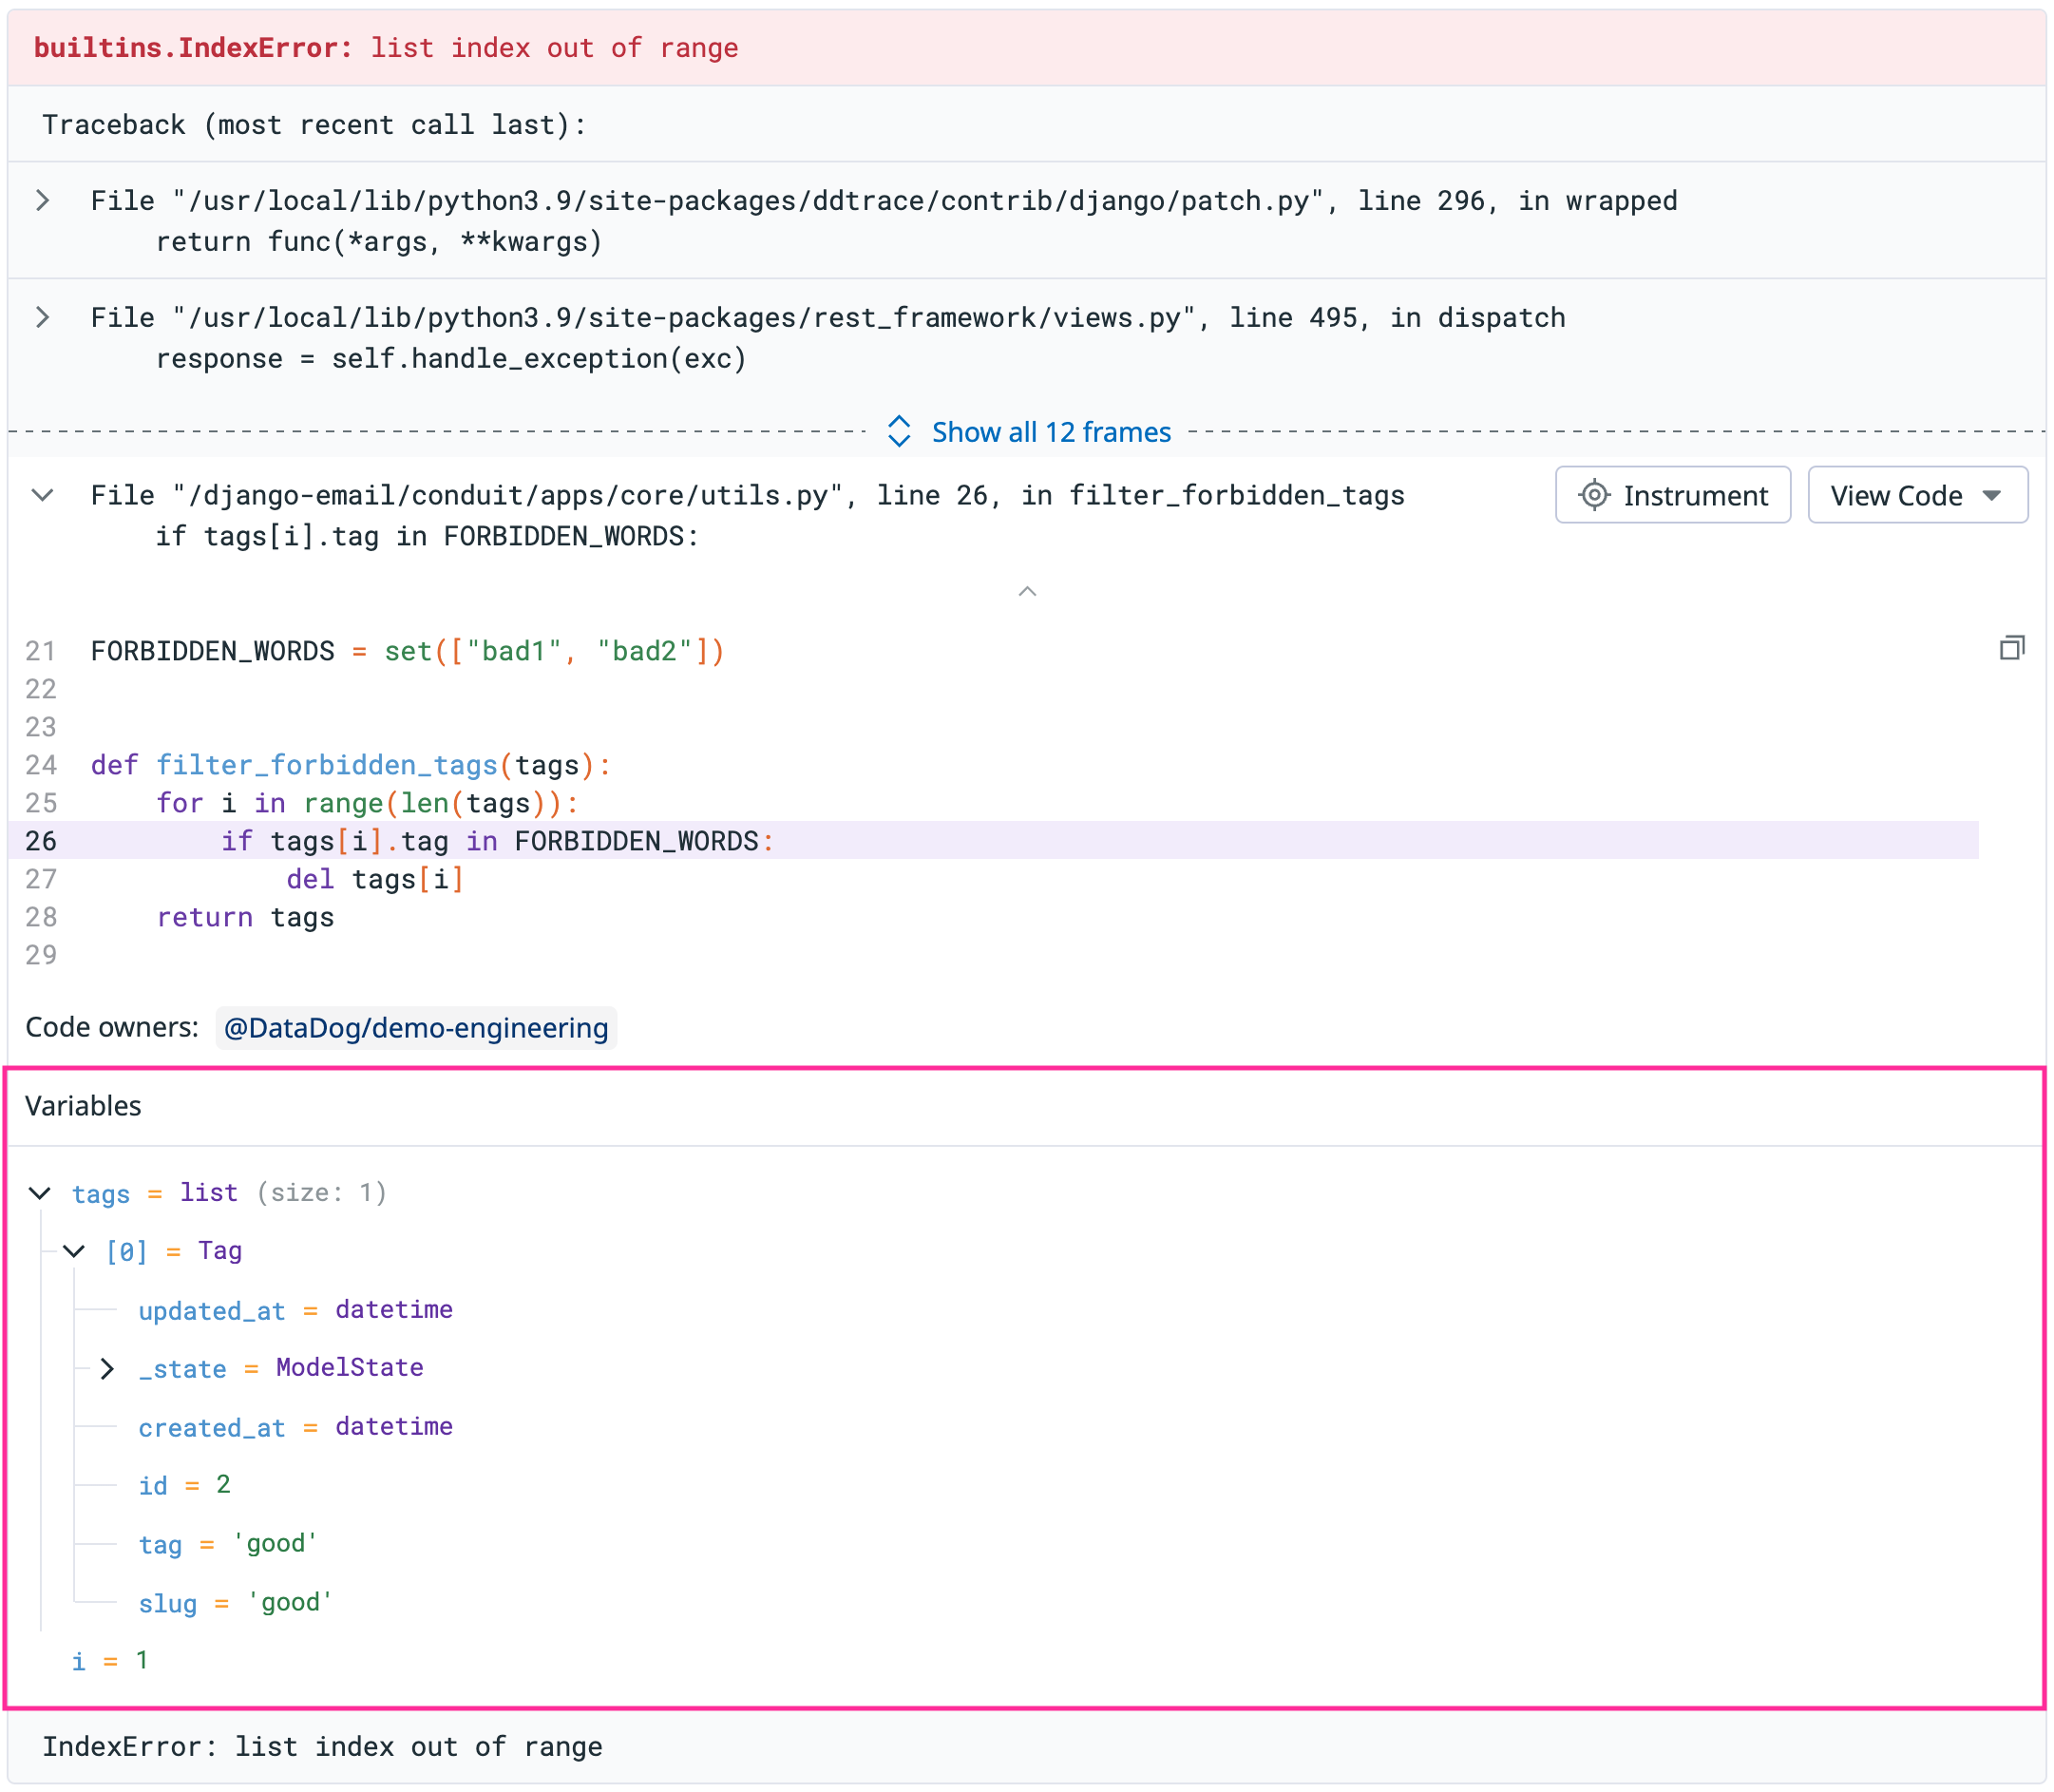
Exception Replay in APM Error Tracking automatically captures production variable values to help you reproduce exceptions from Error Tracking issues.
Requirements
- Supported languages
- Python, Java, .NET, PHP
- Your Datadog Agent must be configured for APM.
- Your application must be instrumented with:
ddtracefor Pythondd-trace-javafor Javadd-trace-dotnetfor .NETdd-trace-phpfor PHP
Exception Replay is only available in APM Error Tracking. It is not available for errors sourced from Logs and RUM.
Setup
- Upgrade the Datadog Agent to version
7.44.0or higher. - Upgrade the APM tracer library to the minimum required version or higher:
ddtraceversion1.16.0+dd-trace-javaversion1.47.0+dd-trace-dotnetversion2.53.0+dd-trace-phpversion1.5.0+
- Run your service with the
DD_EXCEPTION_REPLAY_ENABLEDenvironment variable set totrue. - Create a logs index and configure it to the desired retention with no sampling.
- Set the filter to match on the
source:dd_debuggertag. - Ensure that the new index takes precedence over any others with filters that match that tag, because the first match wins.
- Set the filter to match on the
Why create a logs index? When an error occurs and is captured in an APM span, Exception Replay variable snapshots are captured as logs with reference links to the APM span. When viewing the error in Error Tracking Explorer, variable snapshots from the log data display alongside stack trace details.
Redacting sensitive data
By default, Exception Replay automatically redacts variable data linked to sensitive identifiers like password and accessToken. See the full list of redacted identifiers.
Scrub Exception Replay variable snapshots for PII and other sensitive data by:
- Creating custom identifier redaction
- Redacting based on specific classes or types
- Creating a Sensitive Data Scanner rule and applying it to logs that match
source:dd_debugger
For more information, see Dynamic Instrumentation Sensitive Data Scrubbing.
Note: Dynamic Instrumentation is NOT a prerequisite for Sensitive Data Scrubbing. Sensitive Data Scrubbing applies to Exception Replay variable snapshots by default regardless of whether Dynamic Instrumentation is enabled on the service.
Getting started
- Navigate to APM > Error Tracking.
- Click an Error Tracking issue on a service with Exception Replay enabled.
- Scroll down to the stack trace component.
- Expand stack frames to examine captured variable values.
Troubleshooting
A specific error trace does not have variable values
Exception Replay variable snapshots are rate limited to ensure negligible impact on application performance. For a given exception or issue, a variable snapshot is captured at most once per hour (per instance or pod). If variable values are not visible on a trace, try these options:
- Confirm Exception Replay is enabled on the source service and environment.
- Click View Similar Errors.
- Expand the time range selection to find error instances with captured variable values.
- Use the search query
@error.debug_info_captured:truein Error Tracking Explorer. - Check Log Indexes to confirm logs with the tag
source:dd_debuggerhave appropriate retention and aren’t affected by Exclusion Filters in preceding indexes.
Further Reading
Additional helpful documentation, links, and articles:

