- Essentials
- Getting Started
- Datadog
- Datadog Site
- DevSecOps
- Serverless for AWS Lambda
- Agent
- Integrations
- Containers
- Dashboards
- Monitors
- Logs
- APM Tracing
- Profiler
- Tags
- API
- Service Catalog
- Session Replay
- Continuous Testing
- Synthetic Monitoring
- Incident Management
- Database Monitoring
- Cloud Security Management
- Cloud SIEM
- Application Security Management
- Workflow Automation
- CI Visibility
- Test Visibility
- Test Impact Analysis
- Code Analysis
- Learning Center
- Support
- Glossary
- Standard Attributes
- Guides
- Agent
- Integrations
- OpenTelemetry
- Developers
- Authorization
- DogStatsD
- Custom Checks
- Integrations
- Create an Agent-based Integration
- Create an API Integration
- Create a Log Pipeline
- Integration Assets Reference
- Build a Marketplace Offering
- Create a Tile
- Create an Integration Dashboard
- Create a Recommended Monitor
- Create a Cloud SIEM Detection Rule
- OAuth for Integrations
- Install Agent Integration Developer Tool
- Service Checks
- IDE Plugins
- Community
- Guides
- Administrator's Guide
- API
- Datadog Mobile App
- CoScreen
- Cloudcraft
- In The App
- Dashboards
- Notebooks
- DDSQL Editor
- Sheets
- Monitors and Alerting
- Infrastructure
- Metrics
- Watchdog
- Bits AI
- Service Catalog
- API Catalog
- Error Tracking
- Service Management
- Infrastructure
- Application Performance
- APM
- Continuous Profiler
- Database Monitoring
- Data Streams Monitoring
- Data Jobs Monitoring
- Digital Experience
- Real User Monitoring
- Product Analytics
- Synthetic Testing and Monitoring
- Continuous Testing
- Software Delivery
- CI Visibility
- CD Visibility
- Test Optimization
- Code Analysis
- Quality Gates
- DORA Metrics
- Security
- Security Overview
- Cloud SIEM
- Cloud Security Management
- Application Security Management
- AI Observability
- Log Management
- Observability Pipelines
- Log Management
- Administration
Arithmetic
Absolute
| Function | Description | Example |
|---|---|---|
abs() | Graph the absolute value of the metric. | abs(<METRIC_NAME>{*}) |
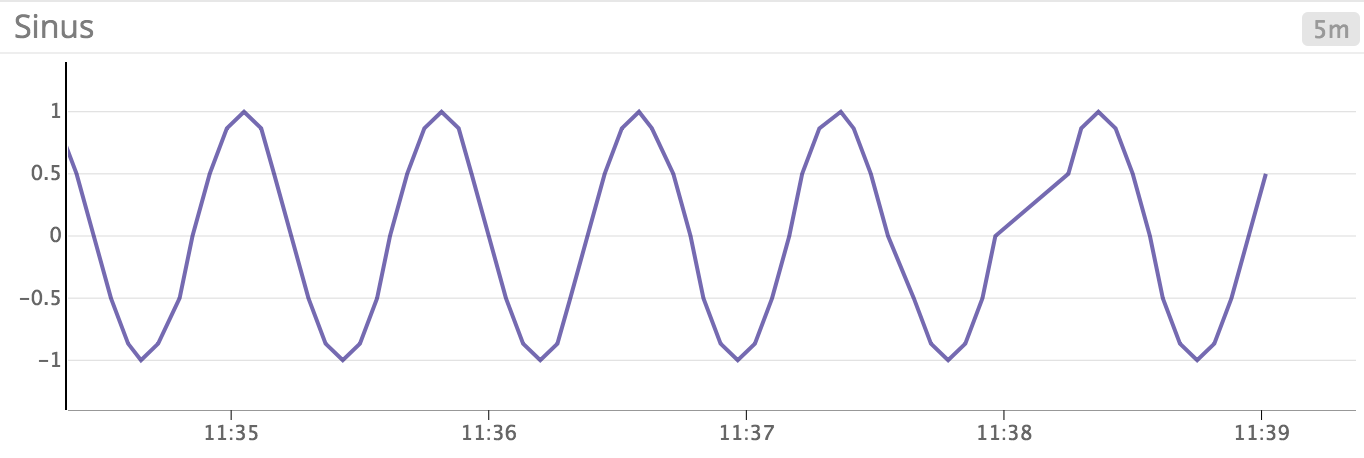
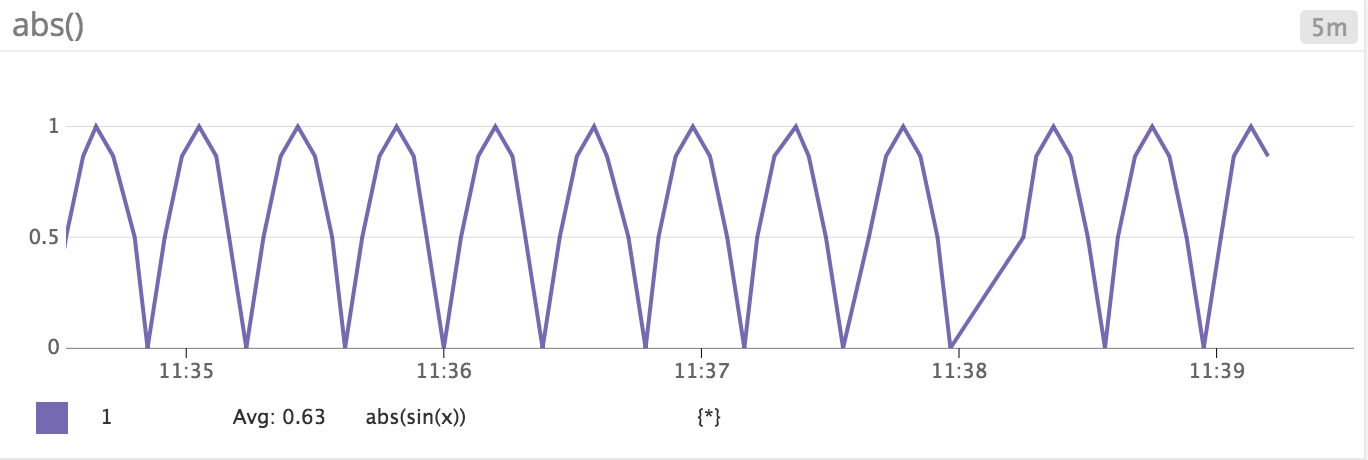
Transforms this sine timeseries sin{*}:
into this one abs(sin{*}):
Logarithm
Log base 2
| Function | Description | Example |
|---|---|---|
log2() | Graph the Base-2 logarithm of the metric. | log2(<METRIC_NAME>{*}) |
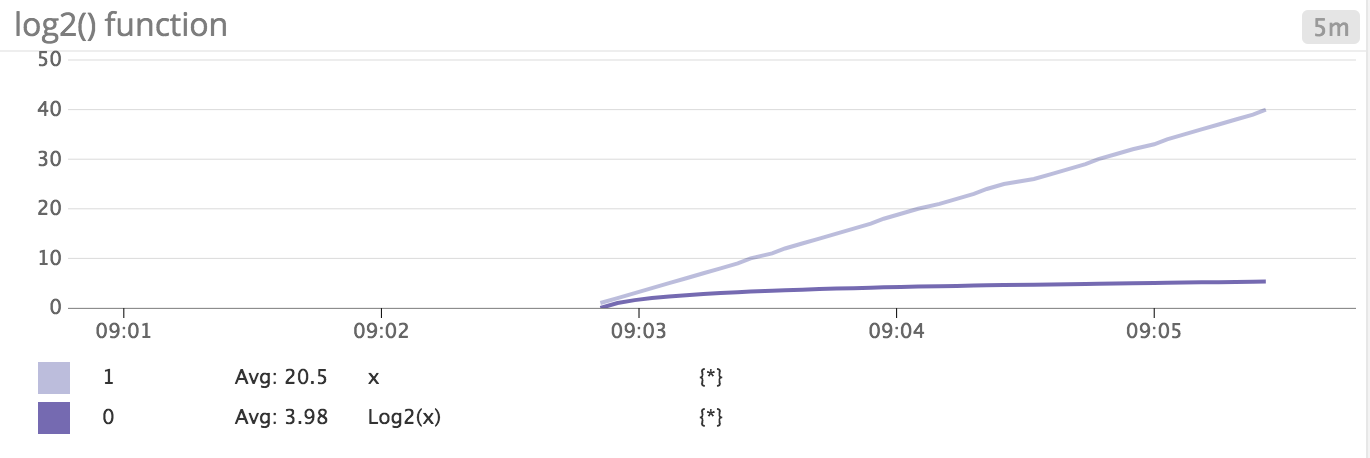
Example:
If a metric, x{*}, increments itself by 1 for each data point, then log2(x{*}) has the following shape:
Log base 10
| Function | Description | Example |
|---|---|---|
log10() | Graph the Base-10 logarithm of the metric. | log10(<METRIC_NAME>{*}) |
Example:
If a metric, x{*}, increments itself by 1 for each data point, then log10(x{*}) has the following shape:
Cumulative sum
| Function | Description | Example |
|---|---|---|
cumsum() | Graph the cumulative sum of the metric over the visible time window. | cumsum(<METRIC_NAME>{*}) |
Example:
If a metric, const_1{*}, is a constant with the value of 1, then cumsum(const_1{*}) has the following shape:
Cumulative sum in monitors
Cumulative sum should be avoided in monitor queries, because the cumulative sum function is a visual function. When used in a dashboard or notebook, the points will reflect values based on the selected timeframe. This doesn’t translate well in a monitor as the monitor doesn’t have a sense of which timeframe to use.
Instead, configure Cumulative Time Windows in your monitor evaluation period.
Integral
| Function | Description | Example |
|---|---|---|
integral() | Graph the integral of the metric. | integral(<METRIC_NAME>{*}) |
Note: Datadog’s integral() is the cumulative sum of [time delta] x [value delta] over all consecutive pairs of points in the visible time window for a given metric.
Other functions
Consult the other available functions:
- Algorithmic: Implement Anomaly or Outlier detection on your metric.


