- Essentials
- Getting Started
- Datadog
- Datadog Site
- DevSecOps
- Serverless for AWS Lambda
- Agent
- Integrations
- Containers
- Dashboards
- Monitors
- Logs
- APM Tracing
- Profiler
- Tags
- API
- Service Catalog
- Session Replay
- Continuous Testing
- Synthetic Monitoring
- Incident Management
- Database Monitoring
- Cloud Security Management
- Cloud SIEM
- Application Security Management
- Workflow Automation
- CI Visibility
- Test Visibility
- Test Impact Analysis
- Code Analysis
- Learning Center
- Support
- Glossary
- Standard Attributes
- Guides
- Agent
- Integrations
- OpenTelemetry
- Developers
- Authorization
- DogStatsD
- Custom Checks
- Integrations
- Create an Agent-based Integration
- Create an API Integration
- Create a Log Pipeline
- Integration Assets Reference
- Build a Marketplace Offering
- Create a Tile
- Create an Integration Dashboard
- Create a Recommended Monitor
- Create a Cloud SIEM Detection Rule
- OAuth for Integrations
- Install Agent Integration Developer Tool
- Service Checks
- IDE Plugins
- Community
- Guides
- Administrator's Guide
- API
- Datadog Mobile App
- CoScreen
- Cloudcraft
- In The App
- Dashboards
- Notebooks
- DDSQL Editor
- Sheets
- Monitors and Alerting
- Infrastructure
- Metrics
- Watchdog
- Bits AI
- Service Catalog
- API Catalog
- Error Tracking
- Service Management
- Infrastructure
- Application Performance
- APM
- Continuous Profiler
- Database Monitoring
- Data Streams Monitoring
- Data Jobs Monitoring
- Digital Experience
- Real User Monitoring
- Product Analytics
- Synthetic Testing and Monitoring
- Continuous Testing
- Software Delivery
- CI Visibility
- CD Visibility
- Test Optimization
- Code Analysis
- Quality Gates
- DORA Metrics
- Security
- Security Overview
- Cloud SIEM
- Cloud Security Management
- Application Security Management
- AI Observability
- Log Management
- Observability Pipelines
- Log Management
- Administration
Getting Started with the Continuous Profiler
Profiling can make your services faster, cheaper, and more reliable, but if you haven’t used a profiler, it can be confusing.
This guide explains profiling, provides a sample service with a performance problem, and uses the Datadog Continuous Profiler to understand and fix the problem.
Overview
A profiler shows how much “work” each function is doing by collecting data about the program as it’s running. For example, if infrastructure monitoring shows your app servers are using 80% of their CPU, you may not know why. Profiling shows a breakdown of the work, for example:
| Function | CPU usage |
|---|---|
doSomeWork | 48% |
renderGraph | 19% |
| Other | 13% |
When working on performance problems, this information is important because many programs spend a lot of time in a few places, which may not be obvious. Guessing at which parts of a program to optimize causes engineers to spend a lot of time with little results. By using a profiler, you can find exactly which parts of the code to optimize.
If you’ve used an APM tool, you might think of profiling like a “deeper” tracer that provides a fine grained view of your code without needing any instrumentation.
The Datadog Continuous Profiler can track various types of “work”, including CPU usage, amount and types of objects being allocated in memory, time spent waiting to acquire locks, amount of network or file I/O, and more. The profile types available depend on the language being profiled.
Setup
Prerequisites
Before getting started, ensure you have the following prerequisites:
- docker-compose
- A Datadog account and API key. If you need a Datadog account, sign up for a free trial.
Installation
The dd-continuous-profiler-example repo provides an example service with a performance problem for experimenting. An API is included for searching the “database” of 5000 movies.
Install and run the example service:
git clone https://github.com/DataDog/dd-continuous-profiler-example.git
cd dd-continuous-profiler-example
echo "DD_API_KEY=YOUR_API_KEY" > docker.env
docker-compose up -d
Validation
After the containers are built and running, the “toolbox” container is available to explore:
docker exec -it dd-continuous-profiler-example-toolbox-1 bash
Use the API with:
curl -s http://movies-api-java:8080/movies?q=wars | jq
If you prefer, there’s a Python version of the example service, called movies-api-py. If utilized, adjust the commands throughout the tutorial accordingly.
Generate data
Generate traffic using the ApacheBench tool, ab. Run it for 10 concurrent HTTP clients sending requests for 20 seconds. Inside the toolbox container, run:
ab -c 10 -t 20 http://movies-api-java:8080/movies?q=the
Example output:
...
Reported latencies by ab:
Percentage of the requests served within a certain time (ms)
  50%    464
  66%    503
  75%    533
  80%    553
  90%    614
  95%    683
  98%    767
  99%    795
 100%    867 (longest request)
Investigate
Read the profile
Use the Profile Search to find the profile covering the time period for which you generated traffic. It may take a minute or so to load. The profile that includes the load test has a higher CPU usage:
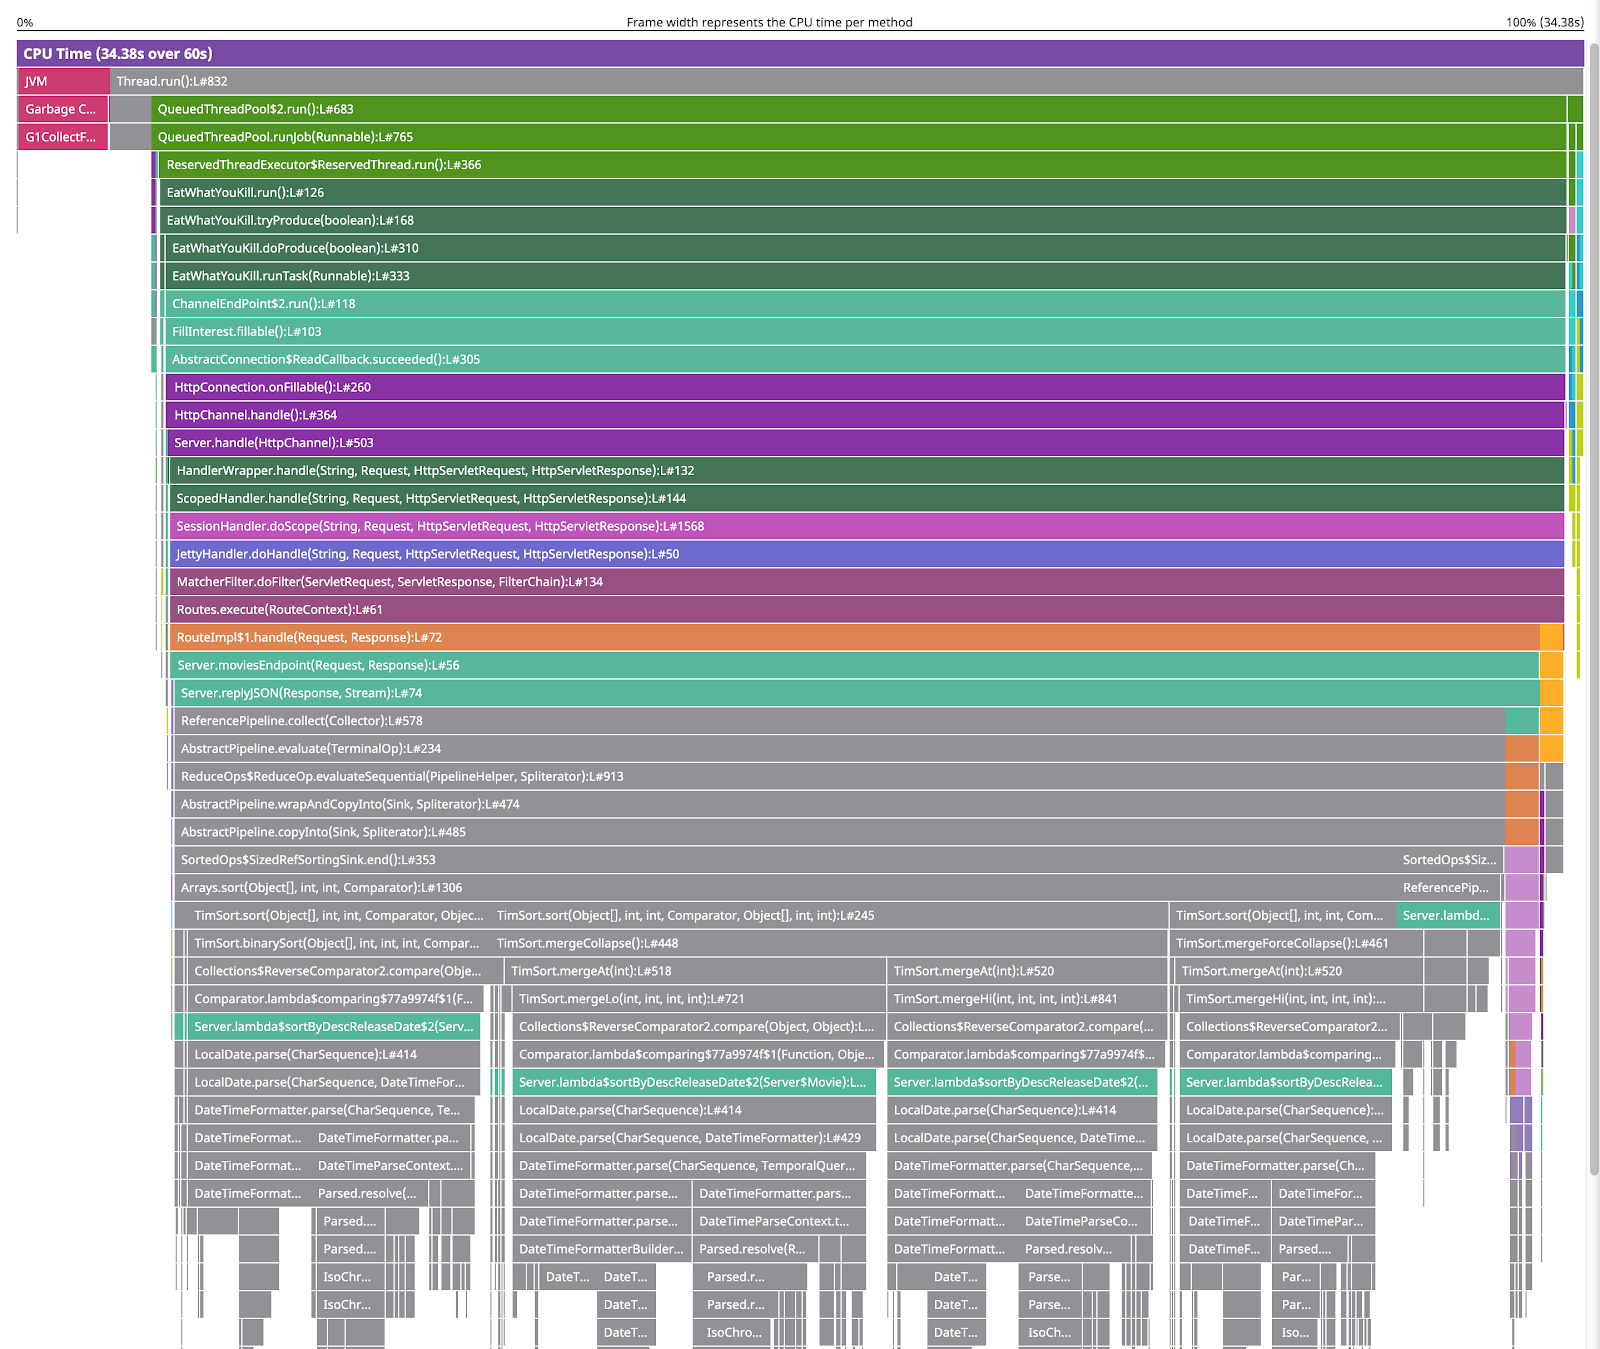
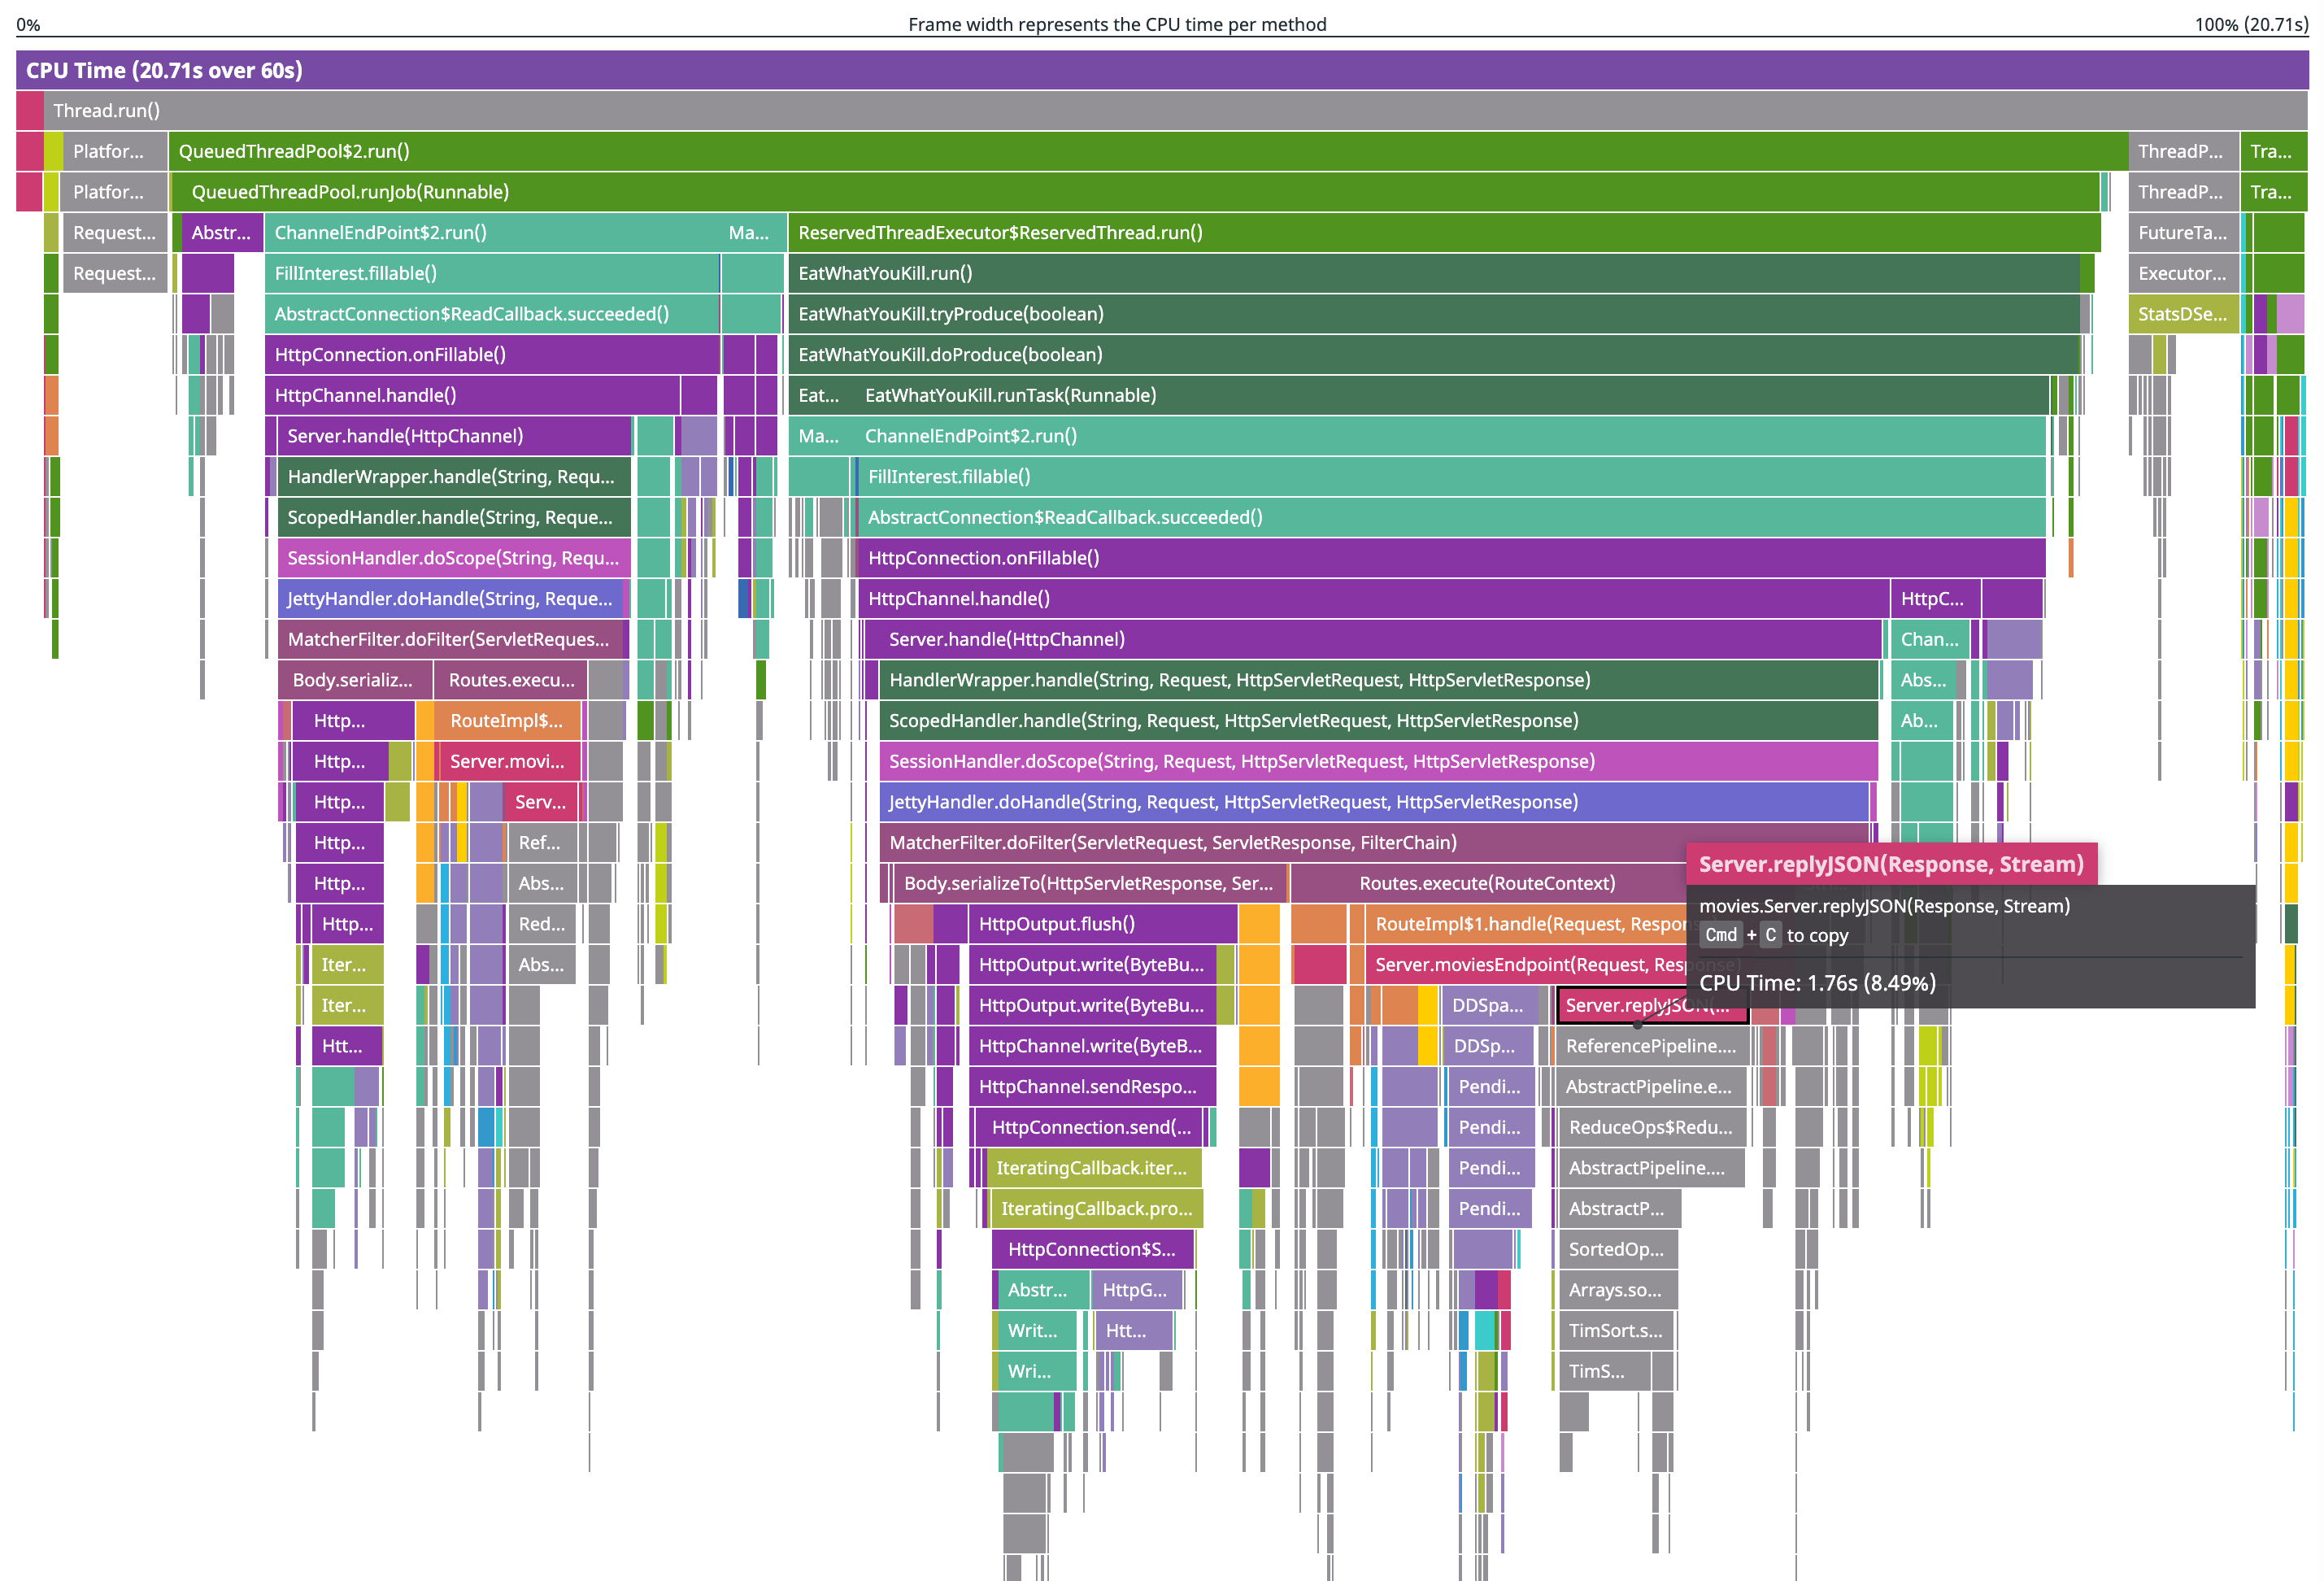
When you open it, the visualization of the profile looks similar to this:
This is a flame graph. The most important things it shows are how much CPU each method used (since this is a CPU profile) and how each method was called. For example, reading from the second row from the top, you see that Thread.run() called QueuedThreadPool$2.run() (amongst other things), which called QueuedThreadPool.runjob(Runnable), which called ReservedTheadExecutor$ReservedThread.run(), and so on.
Zooming in to one area on the bottom of the flame graph, a tooltip shows that roughly 309ms (0.90%) of CPU time was spent within this parse() function:
String.length() is directly below the parse() function, which means that parse() calls it. Hover over String.length(), to see it took about 112ms of CPU time:
That means 197 milliseconds were spent directly in parse(): 309ms - 112ms. That’s visually represented by the part of the parse() box that doesn’t have anything below it.
It’s worth calling out that the flame graph does not represent the progression of time. Looking at this part of the profile, Gson$1.write() didn’t run before TypeAdapters$16.write() but it may not have run after it either.
They could have been running concurrently, or the program could have run several calls of one, then several calls of the other, and kept switching back and forth. The flame graph merges together all the times that a program was running the same series of functions so you can tell at a glance which parts of the code were using the most CPU without tons of tiny boxes showing each time a function was called.
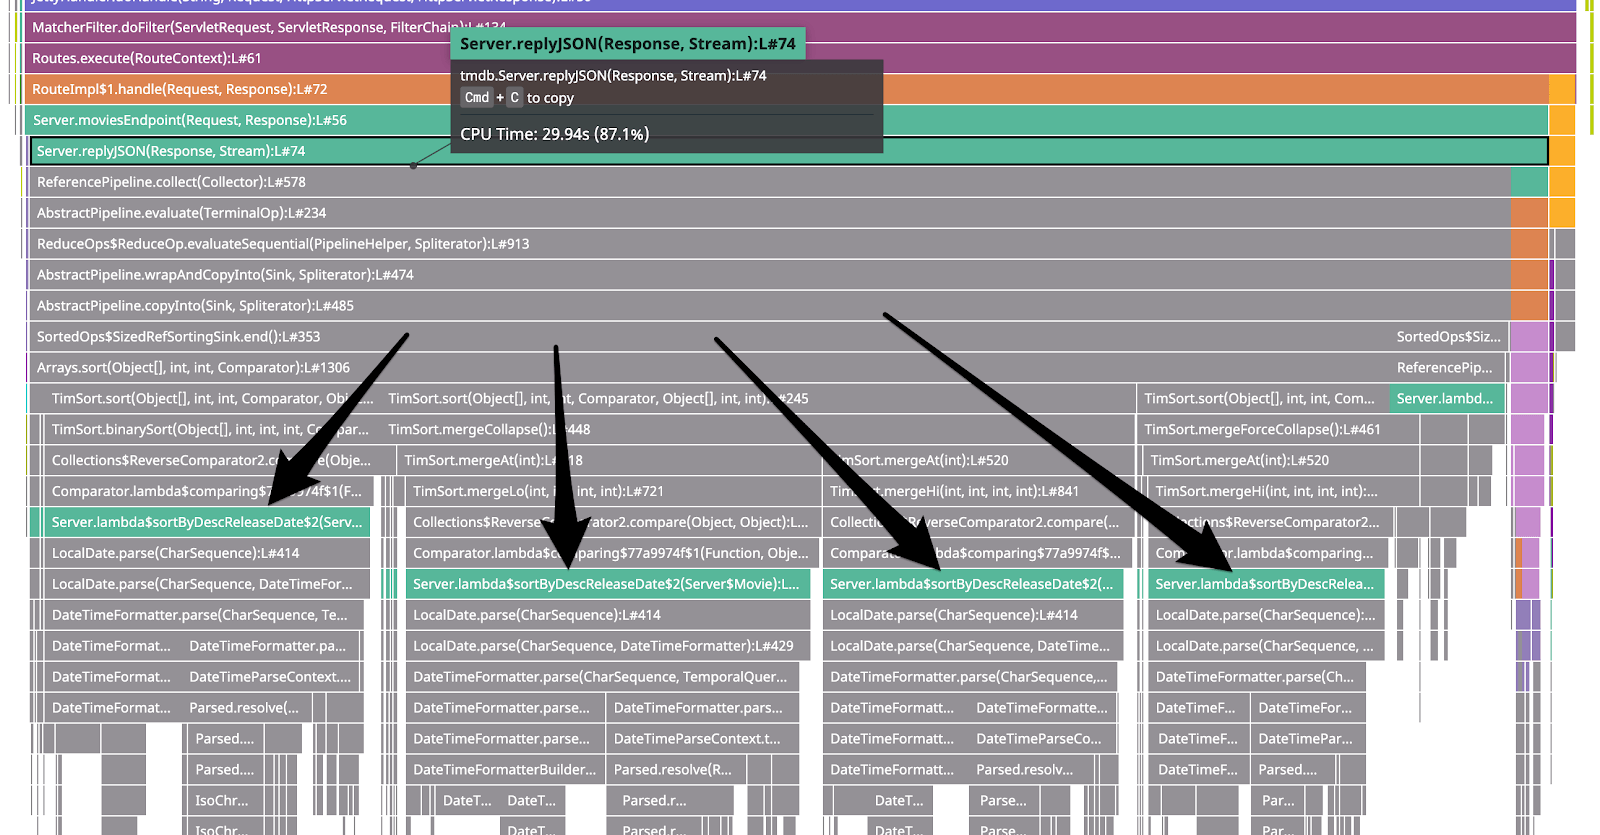
Zoom back out to see that about 87% of CPU usage was within the replyJSON() method. Below that, the graph shows replyJSON() and the methods it calls eventually branch into four main code paths (“stack traces”) that run functions pertaining to sorting and date parsing:
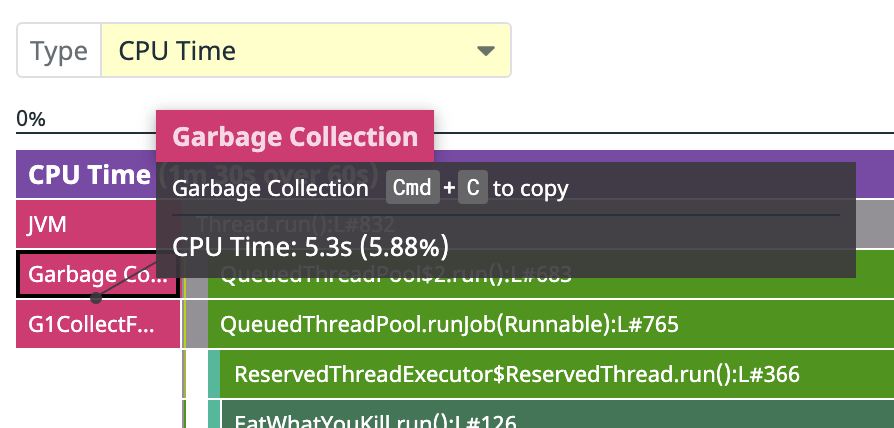
Also, you can see a part of the CPU profile that looks like this:
Profile types
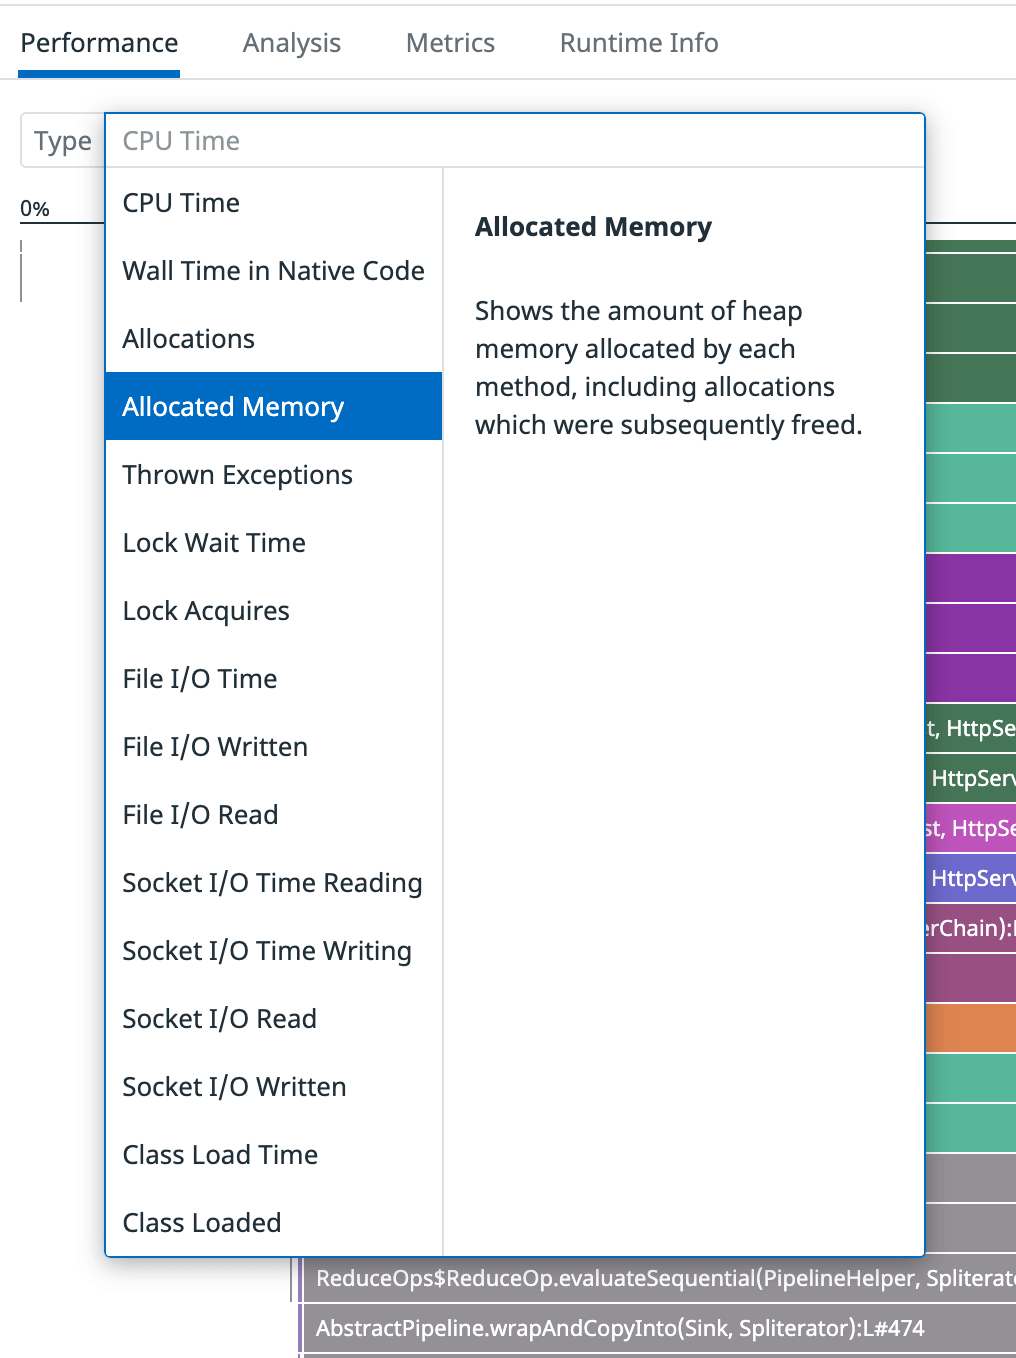
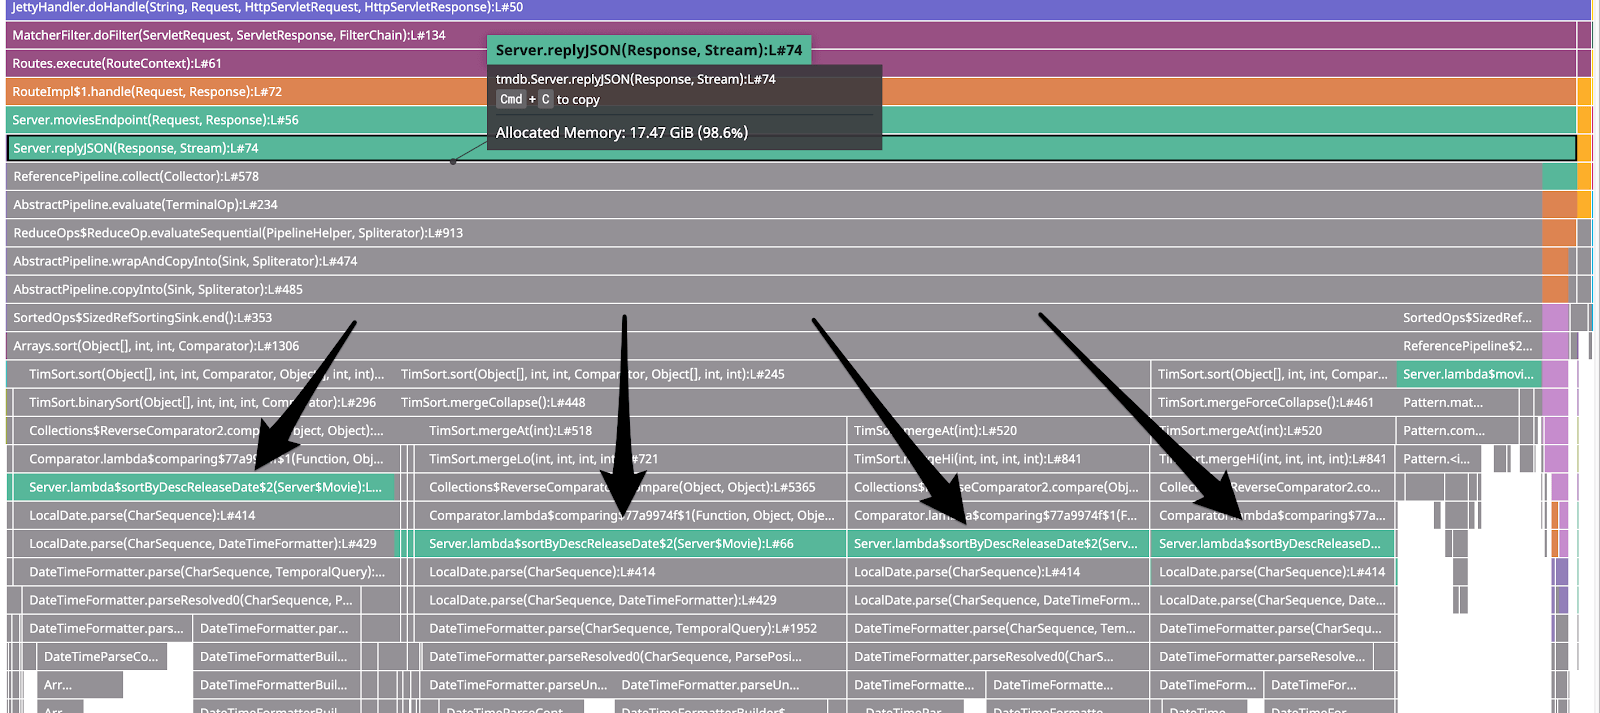
Almost 6% of CPU time was spent in garbage collection, which suggests it may be producing a lot of garbage. So, review the Allocated Memory profile type:
On an Allocated Memory profile, the size of the boxes shows how much memory each function allocated, and the call stack that led to the function doing the allocating. Here you can see that during this one minute profile, the replyJSON() method and other methods that it called, allocated 17.47 GiB, mostly related to the same date parsing code seen in the CPU profile above:
Remediation
Fix the code
Review the code and see what’s going on. By looking at the CPU flame graph, you can see that expensive code paths go through a Lambda on line 66, which calls LocalDate.parse():
That corresponds to this part of code in dd-continuous-profiler-example, where it calls to LocalDate.parse():
private static Stream<Movie> sortByDescReleaseDate(Stream<Movie> movies) {
  return movies.sorted(Comparator.comparing((Movie m) -> {
    // Problem: Parsing a datetime for each item to be sorted.
    // Example Solution:
    //   Since date is in isoformat (yyyy-mm-dd) already, that one sorts nicely with normal string sorting
    //   `return m.releaseDate`
    try {
      return LocalDate.parse(m.releaseDate);
    } catch (Exception e) {
      return LocalDate.MIN;
    }
  }).reversed());
}
This is the sorting logic in the API, which returns results in descending order by release date. It does this by using the release date converted to a LocalDate as the sorting key. To save time, you could cache the LocalDate so it’s only parsed for each movie’s release date rather than on every request, but there’s a better fix. The dates are being parsed in ISO 8601 format (yyyy-mm-dd), which means they can be sorted as strings instead of parsing.
Replace the try and catch with return m.releaseDate; like this:
private static Stream<Movie> sortByDescReleaseDate(Stream<Movie> movies) {
  return movies.sorted(Comparator.comparing((Movie m) -> {
    return m.releaseDate;
  }).reversed());
}
Then rebuild and restart the service:
docker-compose build movies-api-java
docker-compose up -d
Re-test
To test the results, generate traffic again:
docker exec -it dd-continuous-profiler-example-toolbox-1 bash
ab -c 10 -t 20 http://movies-api-java:8080/movies?q=the
Example output:
Reported latencies by ab:
Percentage of the requests served within a certain time (ms)
  50%     82
  66%    103
  75%    115
  80%    124
  90%    145
  95%    171
  98%    202
  99%    218
 100%    315 (longest request)
p99 went from 795ms to 218ms, and overall, this is four to six times faster than before.
Locate the profile containing the new load test and look at the CPU profile. The replyJSON parts of the flame graph are a much smaller percentage of the total CPU usage than the previous load test:
Clean up
When you’re done exploring, clean up by running:
docker-compose down
Recommendations
Saving money
Improving CPU usage like this can translate into saving money. If this had been a real service, this small improvement might have enabled you to scale down to half the servers, potentially saving thousands of dollars a year. Not bad for about 10 minutes of work.
Improve your service
This guide only skimmed the surface of profiling, but it should give you a sense of how to get started. Enable the Profiler for your services.
Further reading
Additional helpful documentation, links, and articles:

