- Essentials
- Getting Started
- Datadog
- Datadog Site
- DevSecOps
- Serverless for AWS Lambda
- Agent
- Integrations
- Containers
- Dashboards
- Monitors
- Logs
- APM Tracing
- Profiler
- Tags
- API
- Service Catalog
- Session Replay
- Continuous Testing
- Synthetic Monitoring
- Incident Management
- Database Monitoring
- Cloud Security Management
- Cloud SIEM
- Application Security Management
- Workflow Automation
- CI Visibility
- Test Visibility
- Test Impact Analysis
- Code Analysis
- Learning Center
- Support
- Glossary
- Standard Attributes
- Guides
- Agent
- Integrations
- OpenTelemetry
- Developers
- Authorization
- DogStatsD
- Custom Checks
- Integrations
- Create an Agent-based Integration
- Create an API Integration
- Create a Log Pipeline
- Integration Assets Reference
- Build a Marketplace Offering
- Create a Tile
- Create an Integration Dashboard
- Create a Recommended Monitor
- Create a Cloud SIEM Detection Rule
- OAuth for Integrations
- Install Agent Integration Developer Tool
- Service Checks
- IDE Plugins
- Community
- Guides
- Administrator's Guide
- API
- Datadog Mobile App
- CoScreen
- Cloudcraft
- In The App
- Dashboards
- Notebooks
- DDSQL Editor
- Sheets
- Monitors and Alerting
- Infrastructure
- Metrics
- Watchdog
- Bits AI
- Service Catalog
- API Catalog
- Error Tracking
- Service Management
- Infrastructure
- Application Performance
- APM
- Continuous Profiler
- Database Monitoring
- Data Streams Monitoring
- Data Jobs Monitoring
- Digital Experience
- Real User Monitoring
- Product Analytics
- Synthetic Testing and Monitoring
- Continuous Testing
- Software Delivery
- CI Visibility
- CD Visibility
- Test Optimization
- Code Analysis
- Quality Gates
- DORA Metrics
- Security
- Security Overview
- Cloud SIEM
- Cloud Security Management
- Application Security Management
- AI Observability
- Log Management
- Observability Pipelines
- Log Management
- Administration
Custom Metrics
Join an enablement webinar session
Explore and register for Foundation Enablement sessions for custom metrics. Learn how custom metrics help you track your application KPIs, such as the number of visitors, average customer basket size, request latency, or performance distribution for a custom algorithm.
Overview
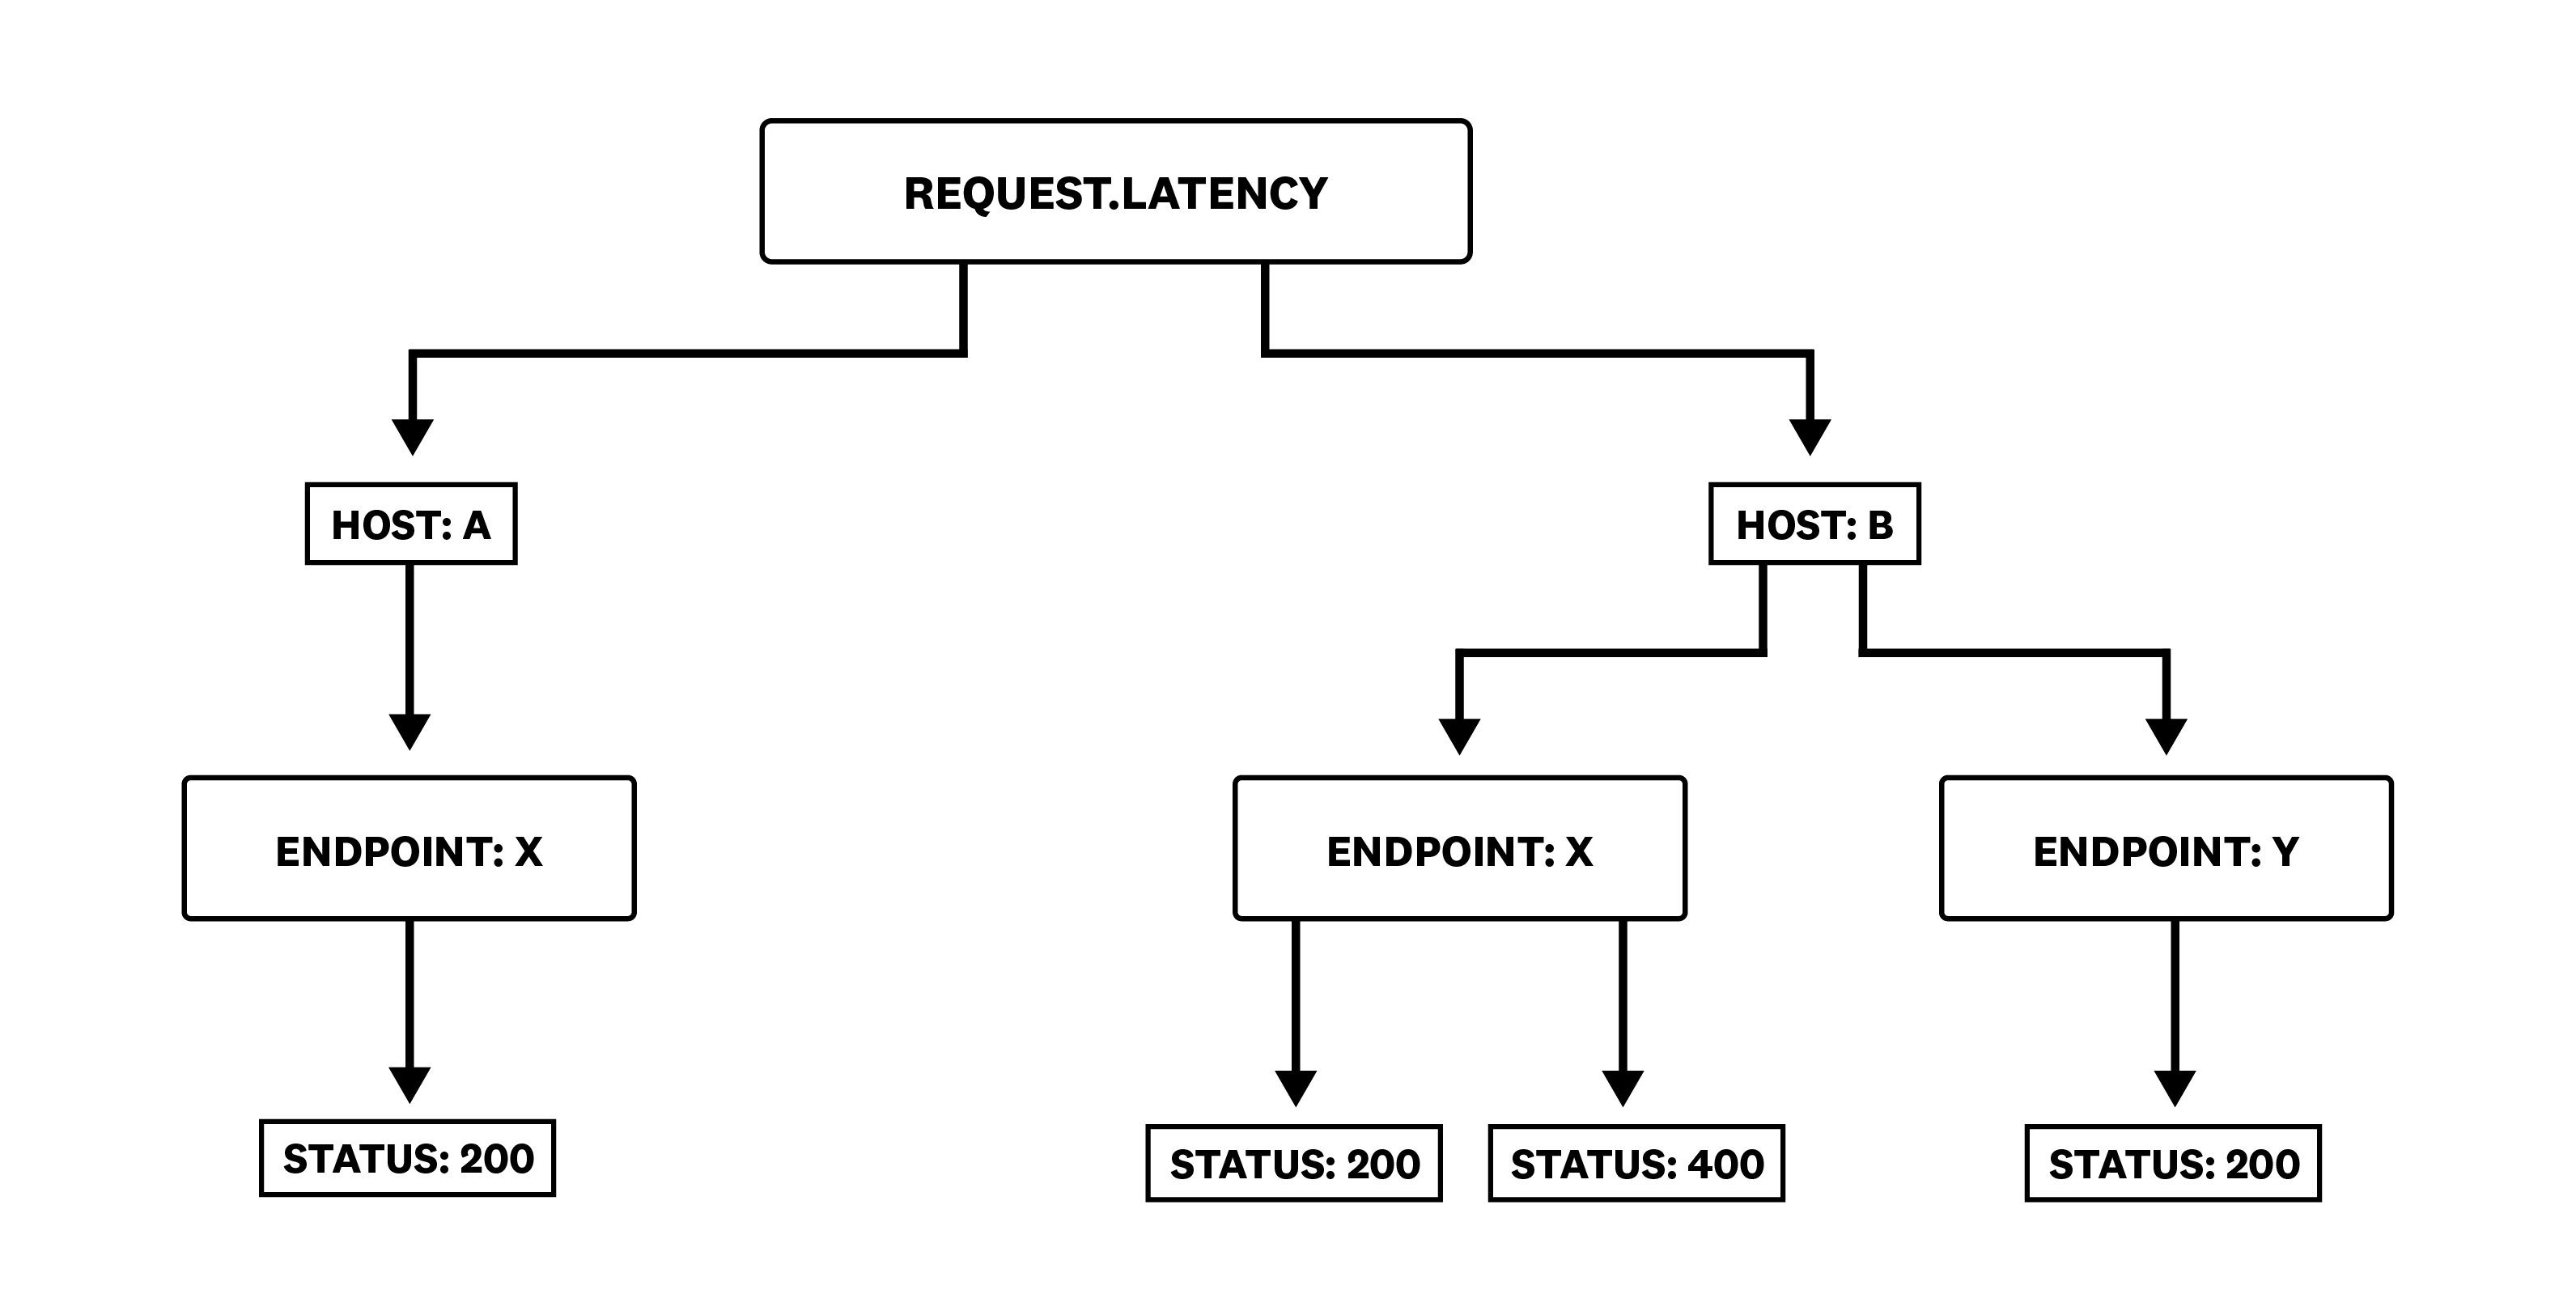
Custom metrics help you track your application KPIs: number of visitors, average customer basket size, request latency, or performance distribution for a custom algorithm. A custom metric is identified by a unique combination of a metric’s name and tag values (including the host tag). In the example below, the metric request.Latency has four unique tag value combinations from its two tag keys:
endpoint, which has the valueendpoint:Xorendpoint:Y.status, which has the valuestatus:200orstatus:400.
The following are also considered custom metrics:
- In general, any metric submitted through DogStatsD or through a custom Agent Check
- Metrics submitted by Marketplace integrations
- Certain standard integrations can potentially emit custom metrics
- Metrics submitted from an integration that is not one of the more than 800 Datadog integrations. Note: Marketplace integrations emit custom metrics.
Note: Users with the Datadog Admin role or usage_read permission can see the monthly average number of custom metrics per hour and the top 5000 custom metrics for their account in the usage details page. Learn more about how custom metrics are counted.
Custom metrics properties
A Datadog custom metric has the properties below. Read the metrics introduction to learn how to graph metrics within Datadog.
| Property | Description |
|---|---|
<METRIC_NAME> | The name of your metric. |
<METRIC_VALUE> | The value of your metric. Note: Metric values must be 32-bit. Values should not reflect dates or timestamps. |
<TIMESTAMP> | The timestamp associated with the metric value. Note: Metric timestamps cannot be more than ten minutes in the future or more than one hour in the past. |
<TAGS> | The set of tags associated with your metric. |
<METRIC_TYPE> | The type of your metric. Read about metric types. |
<INTERVAL> | If the <TYPE> of the metric is RATE or COUNT, it defines the corresponding interval. |
Naming custom metrics
The following custom metric naming convention must be followed:
- Metric names must start with a letter.
- Metric names must only contain ASCII alphanumerics, underscores, and periods.
- Other characters, including spaces, are converted to underscores.
- Unicode is not supported.
- Metric names must not exceed 200 characters. Fewer than 100 is preferred from a UI perspective.
Note: Metric names are case sensitive in Datadog.
Metric units
Set metric units through Metrics Summary or set custom metric units with the Unit override feature in the graph editor of your visualizations. For more information, see the Metrics Units documentation.
Submitting custom metrics
There are multiple ways to send metrics to Datadog:
You can also use one of the Datadog official and community contributed API and DogStatsD client libraries to submit your custom metrics
Note: There are no enforced fixed rate limits on custom metric submission. If your default allotment is exceeded, you are billed according to Datadog’s billing policy for custom metrics.
Standard integrations
The following standard integrations can potentially emit custom metrics.
| Type of integrations | Integrations |
|---|---|
| Limited to 350 custom metrics by default. | ActiveMQ XML / Go-Expvar / Java-JMX |
| No default limit on custom metrics collection. | Nagios /PDH Check /OpenMetrics /Windows performance counters /WMI /Prometheus |
| Can be configured to collect custom metrics. | MySQL /Oracle /Postgres /SQL Server |
| Custom metrics sent from cloud integrations | AWS |
Further reading
Additional helpful documentation, links, and articles:

