- Essentials
- Getting Started
- Datadog
- Datadog Site
- DevSecOps
- Serverless for AWS Lambda
- Agent
- Integrations
- Containers
- Dashboards
- Monitors
- Logs
- APM Tracing
- Profiler
- Tags
- API
- Service Catalog
- Session Replay
- Continuous Testing
- Synthetic Monitoring
- Incident Management
- Database Monitoring
- Cloud Security Management
- Cloud SIEM
- Application Security Management
- Workflow Automation
- CI Visibility
- Test Visibility
- Test Impact Analysis
- Code Analysis
- Learning Center
- Support
- Glossary
- Standard Attributes
- Guides
- Agent
- Integrations
- OpenTelemetry
- Developers
- Authorization
- DogStatsD
- Custom Checks
- Integrations
- Create an Agent-based Integration
- Create an API Integration
- Create a Log Pipeline
- Integration Assets Reference
- Build a Marketplace Offering
- Create a Tile
- Create an Integration Dashboard
- Create a Recommended Monitor
- Create a Cloud SIEM Detection Rule
- OAuth for Integrations
- Install Agent Integration Developer Tool
- Service Checks
- IDE Plugins
- Community
- Guides
- Administrator's Guide
- API
- Datadog Mobile App
- CoScreen
- Cloudcraft
- In The App
- Dashboards
- Notebooks
- DDSQL Editor
- Sheets
- Monitors and Alerting
- Infrastructure
- Metrics
- Watchdog
- Bits AI
- Service Catalog
- API Catalog
- Error Tracking
- Service Management
- Infrastructure
- Application Performance
- APM
- Continuous Profiler
- Database Monitoring
- Data Streams Monitoring
- Data Jobs Monitoring
- Digital Experience
- Real User Monitoring
- Product Analytics
- Synthetic Testing and Monitoring
- Continuous Testing
- Software Delivery
- CI Visibility
- CD Visibility
- Test Optimization
- Code Analysis
- Quality Gates
- DORA Metrics
- Security
- Security Overview
- Cloud SIEM
- Cloud Security Management
- Application Security Management
- AI Observability
- Log Management
- Observability Pipelines
- Log Management
- Administration
RUM Explorer
Overview
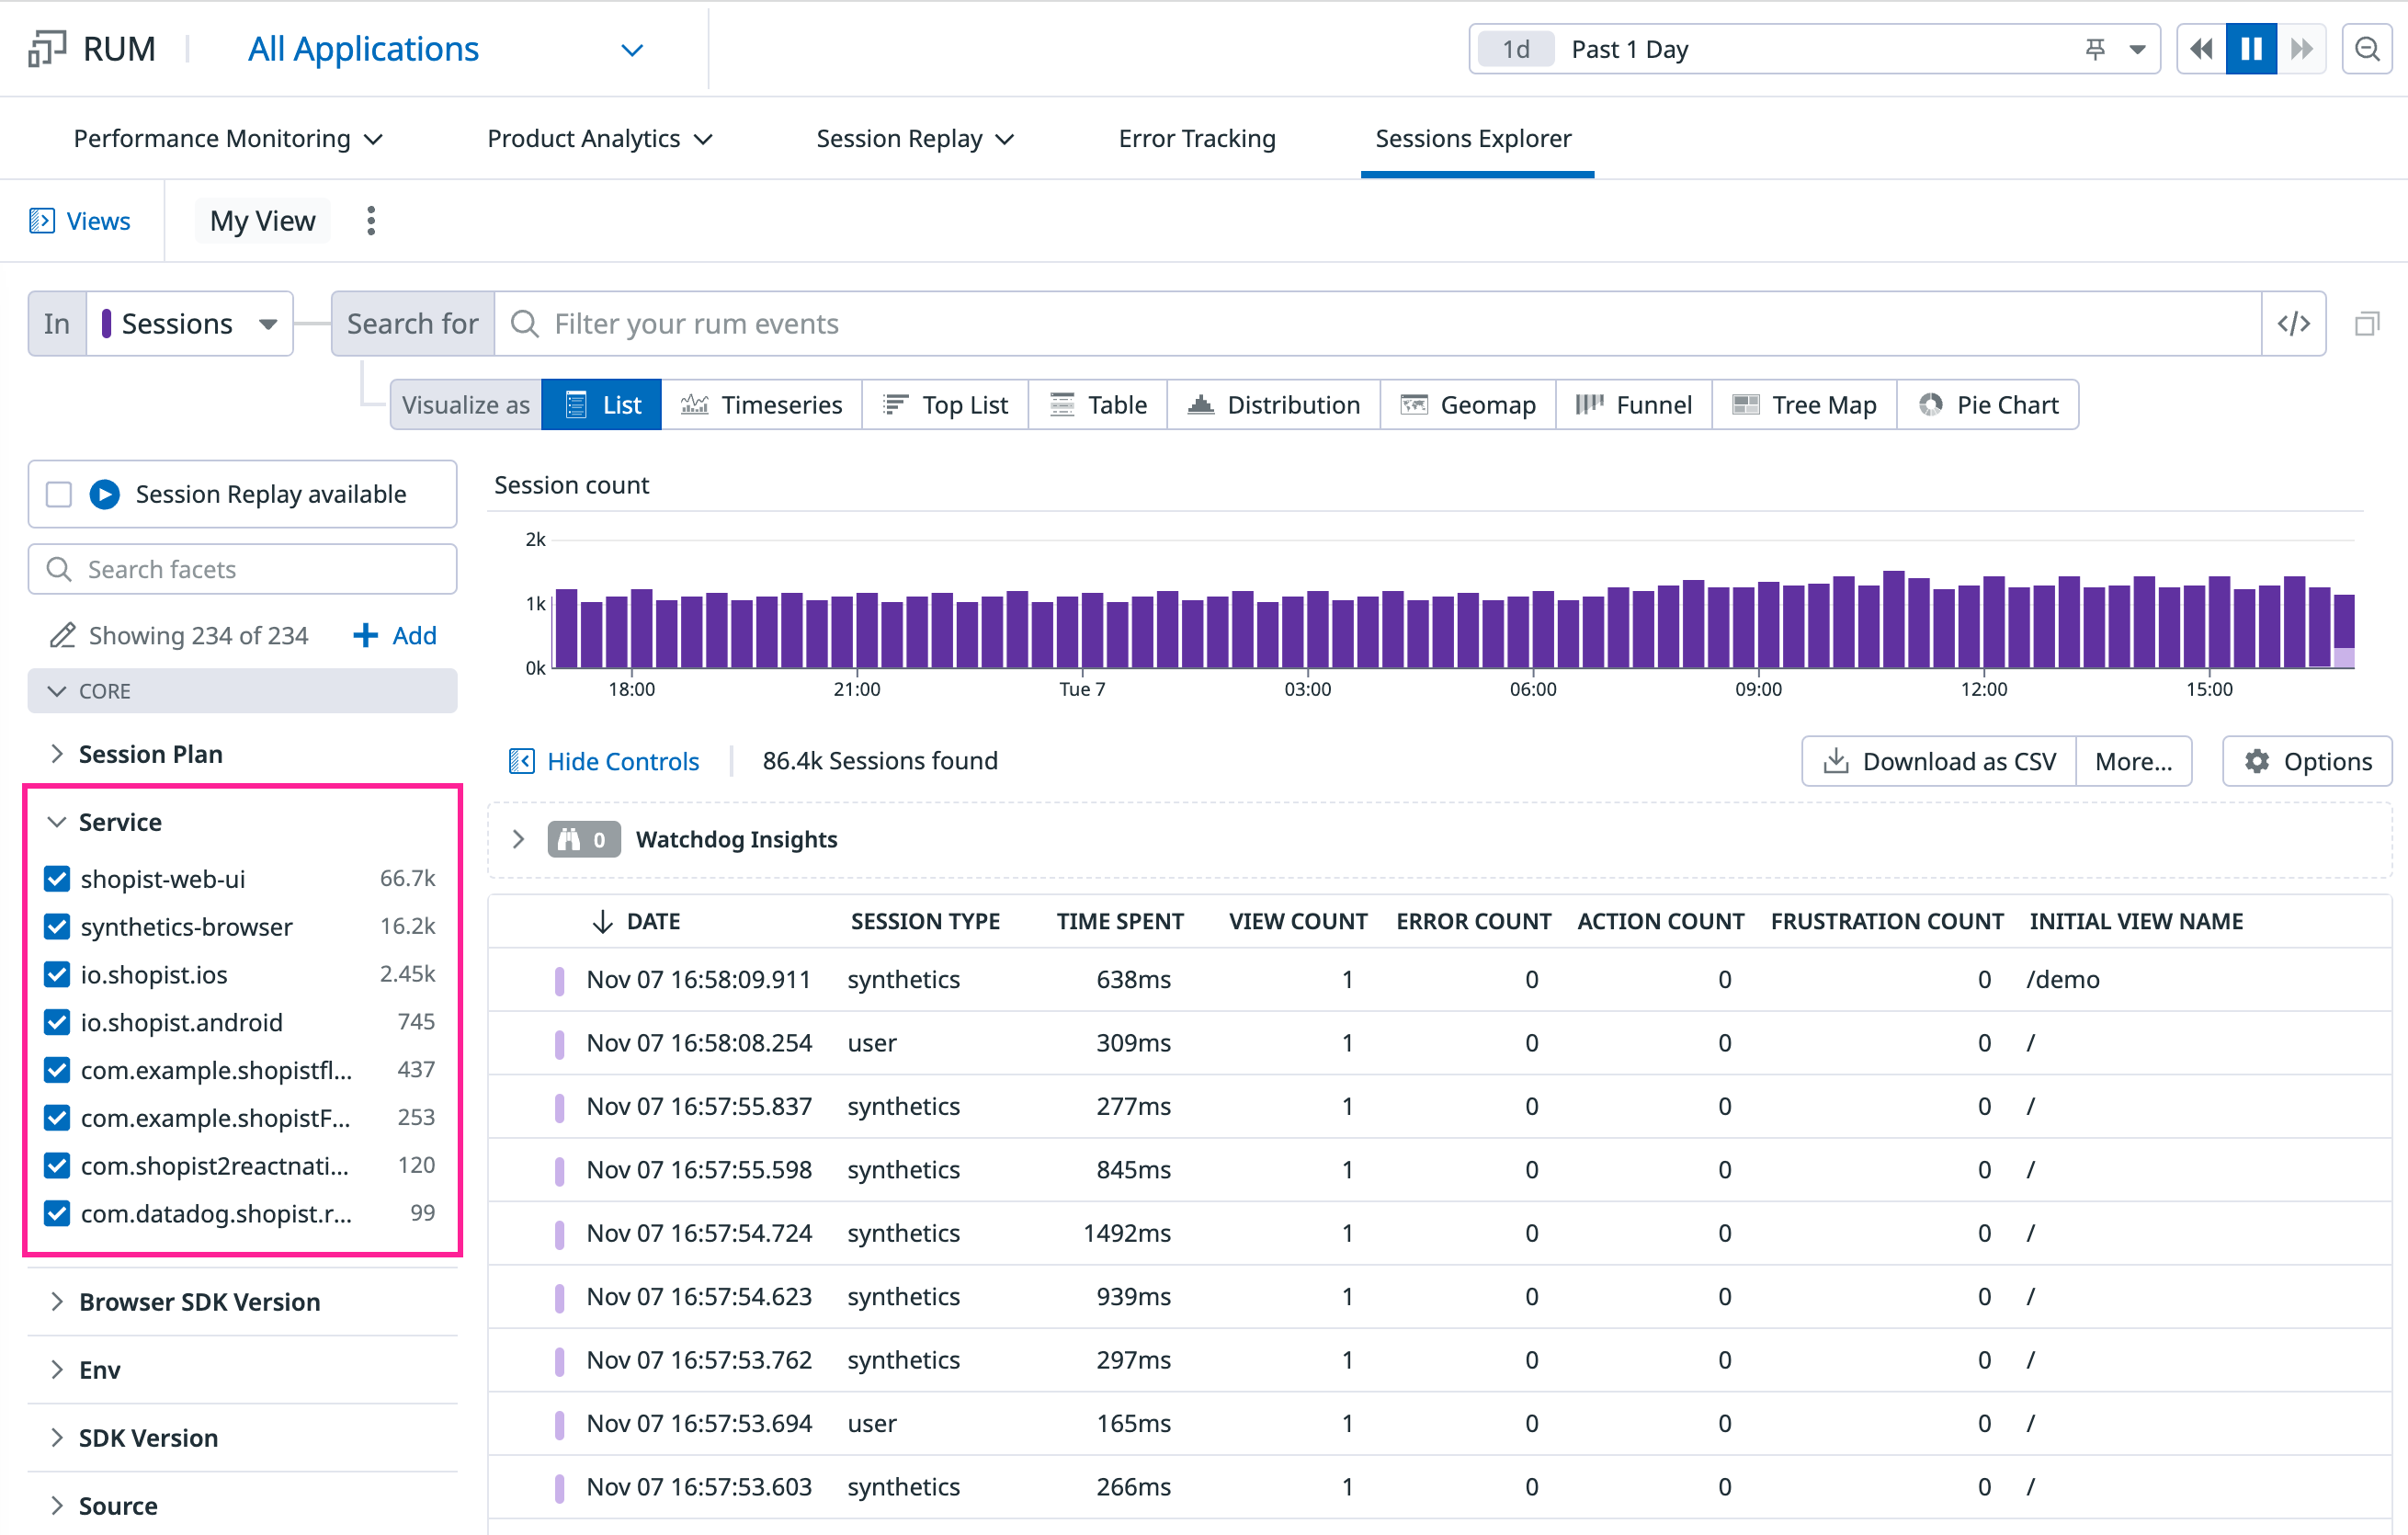
The Real User Monitoring (RUM) Explorer allows you to examine data collected from your applications and granular information about your RUM events.
You can:
- Navigate through user sessions
- Investigate performance issues affecting views, resources, or actions
- Troubleshoot application errors and long tasks
View by application
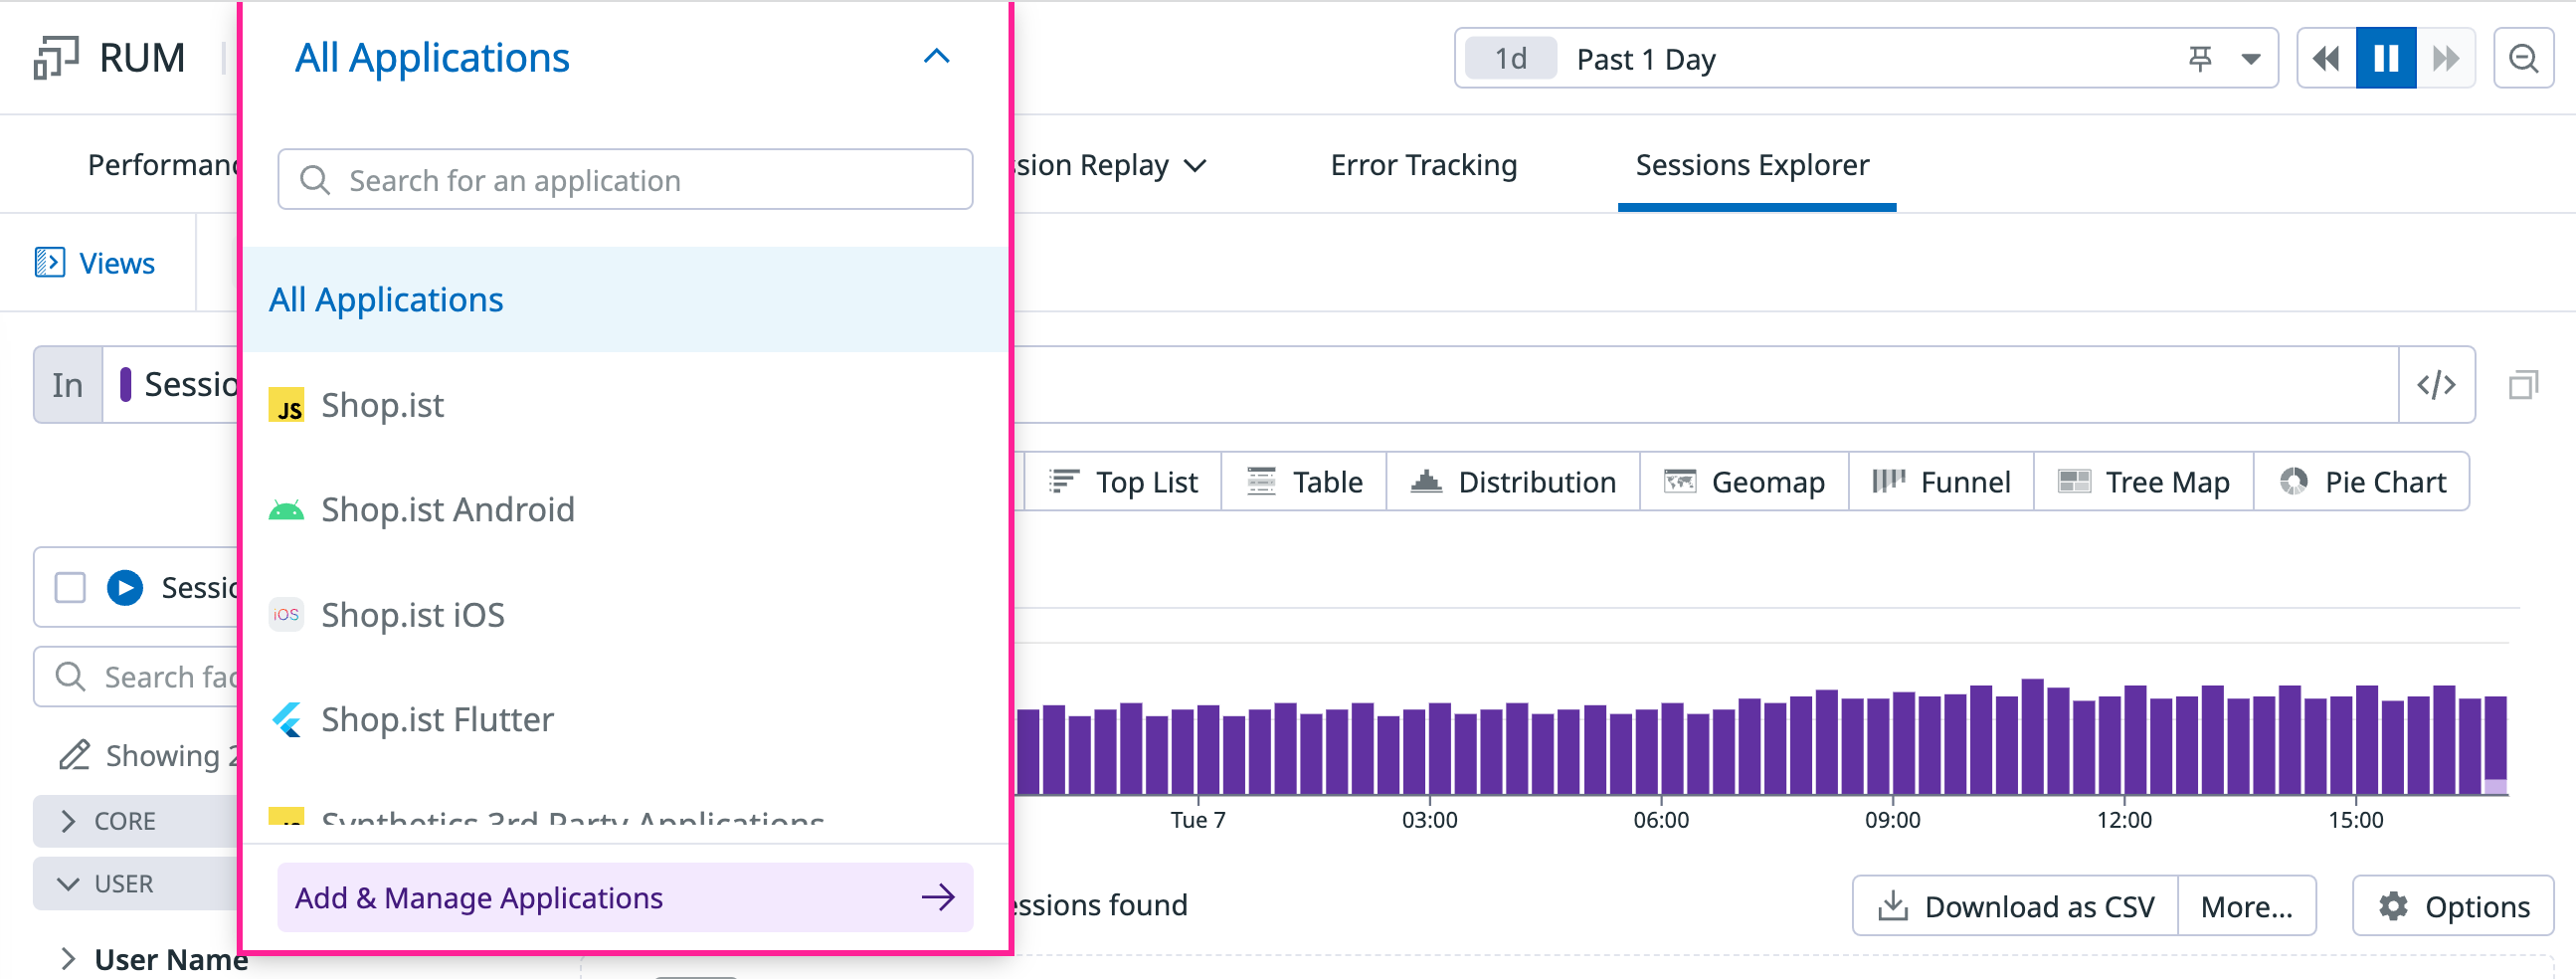
Use the application selector in the top navigation to select and view all RUM data for a specific application.
Search and filter
Search and filter your RUM events by typing in the search bar and selecting a visualization type in the RUM Explorer. You can narrow down, broaden, and shift your focus on subsets of events you are interested in. Use autocomplete suggestions to view facets and recent queries.
Group
Group the RUM events you have queried into higher-level entities that may help you derive or consolidate information about an issue. To identify event patterns and aggregate events by subsets, see Group RUM Events.
To start creating queries and using facets, see Search Syntax.
Visualize
Select a visualization for your filters and aggregations that displays your RUM events in a helpful perspective for you to uncover decisive information.
For example, you can view RUM events in a list, organize RUM data into columns, and see RUM data in a timeseries graph that displays your RUM telemetry over time.
To start visualizing RUM data in the RUM Explorer, see Create RUM Visualizations.
Further Reading
Additional helpful documentation, links, and articles:


