- Essentials
- Getting Started
- Datadog
- Datadog Site
- DevSecOps
- Serverless for AWS Lambda
- Agent
- Integrations
- Containers
- Dashboards
- Monitors
- Logs
- APM Tracing
- Profiler
- Tags
- API
- Service Catalog
- Session Replay
- Continuous Testing
- Synthetic Monitoring
- Incident Management
- Database Monitoring
- Cloud Security Management
- Cloud SIEM
- Application Security Management
- Workflow Automation
- CI Visibility
- Test Visibility
- Test Impact Analysis
- Code Analysis
- Learning Center
- Support
- Glossary
- Standard Attributes
- Guides
- Agent
- Integrations
- OpenTelemetry
- Developers
- Authorization
- DogStatsD
- Custom Checks
- Integrations
- Create an Agent-based Integration
- Create an API Integration
- Create a Log Pipeline
- Integration Assets Reference
- Build a Marketplace Offering
- Create a Tile
- Create an Integration Dashboard
- Create a Recommended Monitor
- Create a Cloud SIEM Detection Rule
- OAuth for Integrations
- Install Agent Integration Developer Tool
- Service Checks
- IDE Plugins
- Community
- Guides
- Administrator's Guide
- API
- Datadog Mobile App
- CoScreen
- Cloudcraft
- In The App
- Dashboards
- Notebooks
- DDSQL Editor
- Sheets
- Monitors and Alerting
- Infrastructure
- Metrics
- Watchdog
- Bits AI
- Service Catalog
- API Catalog
- Error Tracking
- Service Management
- Infrastructure
- Application Performance
- APM
- Continuous Profiler
- Database Monitoring
- Data Streams Monitoring
- Data Jobs Monitoring
- Digital Experience
- Real User Monitoring
- Product Analytics
- Synthetic Testing and Monitoring
- Continuous Testing
- Software Delivery
- CI Visibility
- CD Visibility
- Test Optimization
- Code Analysis
- Quality Gates
- DORA Metrics
- Security
- Security Overview
- Cloud SIEM
- Cloud Security Management
- Application Security Management
- AI Observability
- Log Management
- Observability Pipelines
- Log Management
- Administration
Compute Apdex And Custom Performance Indicators With RUM Data
Overview
Datadog collects Real User Monitoring (RUM) events from browser and mobile RUM SDKs that you can use to build a quick graph and compute performance indicator metrics such as Apdex.
To compute your Apdex score, you can use service monitoring from APM or user monitoring data from the RUM SDKs. This guide provides instructions on computing Apdex for an application with RUM data and the Query Value widget in a Quick Graph.
For more information about computing Apdex with service monitoring data, see Configure Apdex score by service.
Prerequisites
- Your web or mobile application is instrumented with the RUM SDK. To set up instrumentation, see RUM Browser Monitoring, RUM Android Monitoring, and RUM iOS Monitoring.
- Events from your application are available in Datadog.
Compute an Apdex score
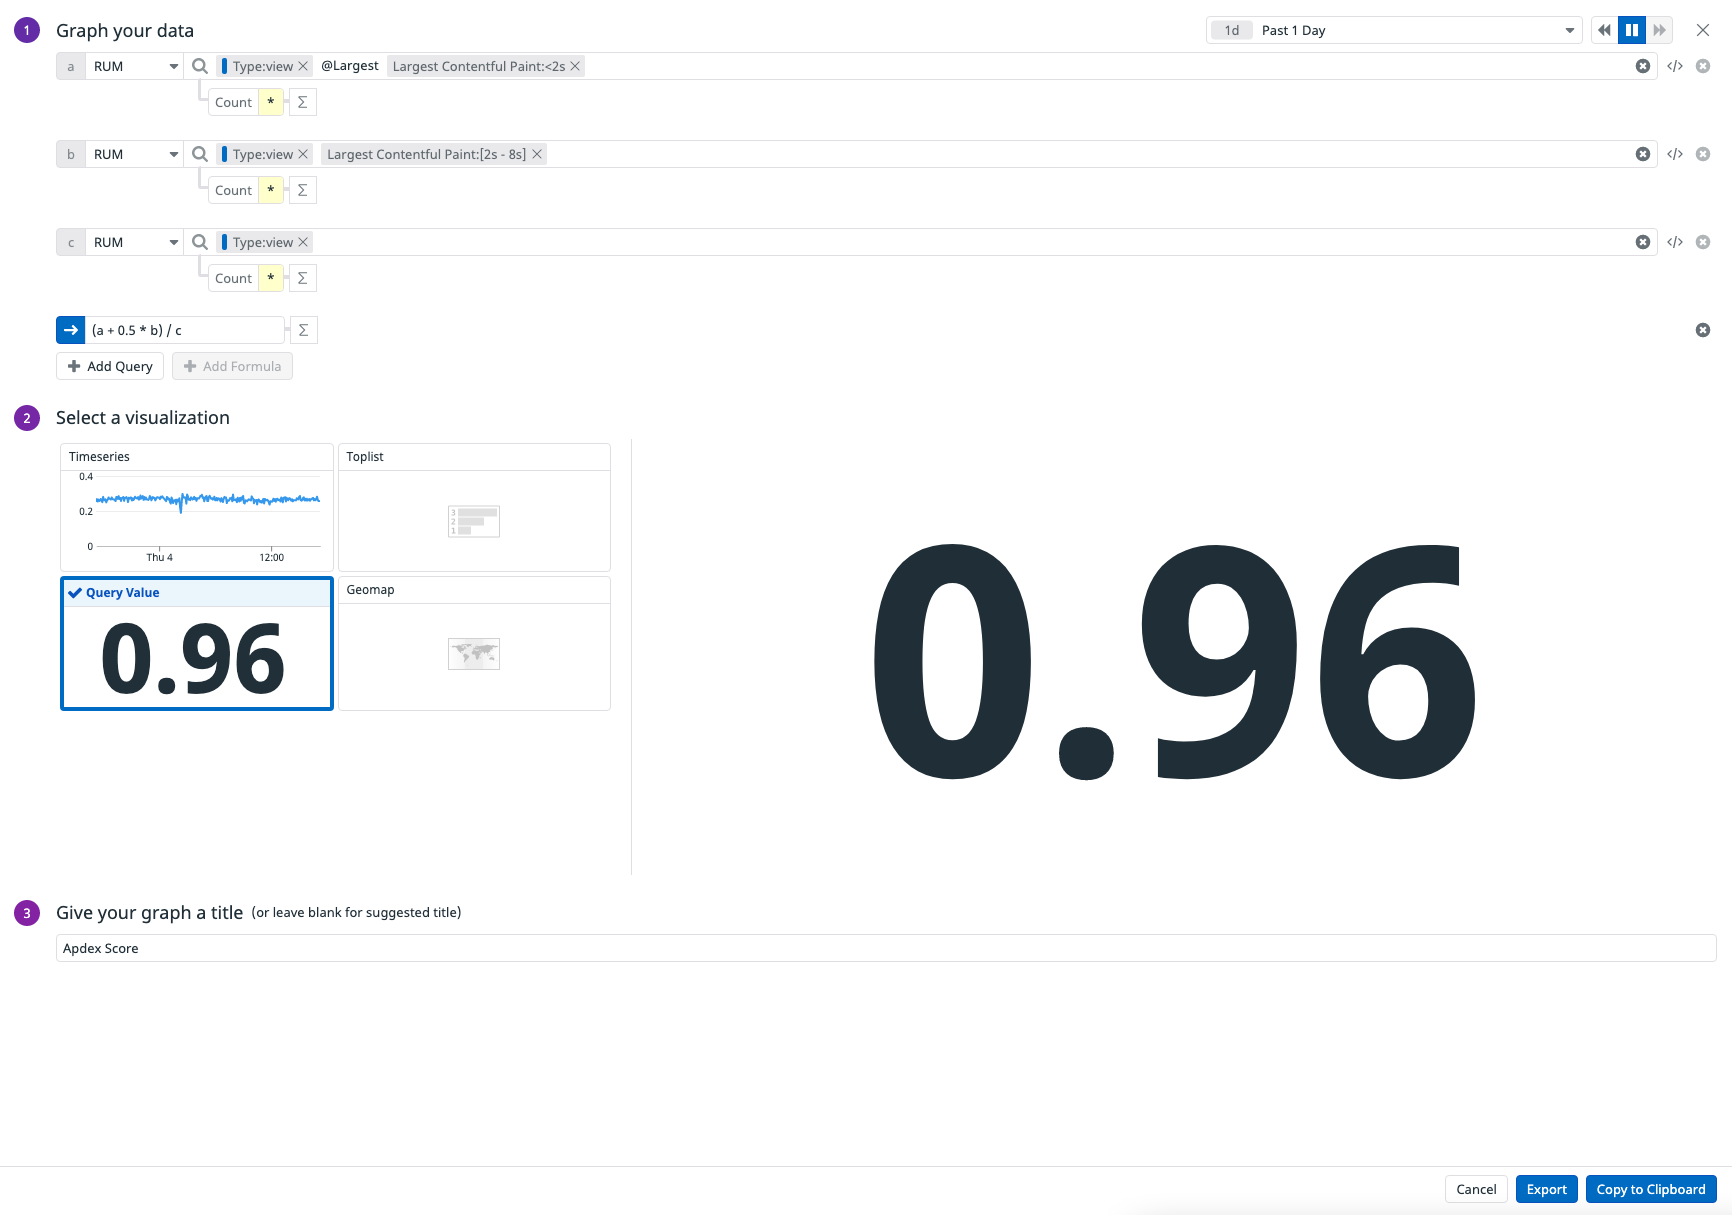
The example below calculates an Apdex score using the Largest Contentful Paint performance metric from RUM events, and a hypothetical threshold of T = 2 sec. The minimum frustrating latency is 4T = 8 sec. The resulting value is shown in a Query Value widget quick graph that you can export to dashboards or notebooks.
Create a quick graph
- Navigate to Dashboards > Quick Graph.
- Create three RUM queries:
- In the Formula field, enter the Apdex formula
(a + 0.5 * b) / c. - Under Select a visualization, click Query Value. A query value widget appears.
- In the time frame selector, select Past 1 Day. By default, the widget displays in Global Time.
- Enter a name for your graph, such as
Apdex Score. - Optionally, export or copy and paste the quick graph to a dashboard or notebook, or click Export > New Dashboard to create a dashboard with this quick graph.
Query A
- In Graph your data, select
RUMas the data source for queryaand enter@view.largest_contentful_paint:<2s. - Press Enter or click Update query in the dropdown menu. The
Largest Contentful Paint:<2squery appears next toRUMfor querya.
Query B
- To create query
b, click + Add Query. - Select
RUMas the data source for queryband enter@view.largest_contentful_paint:[2s TO 8s]. - Press Enter or click Update query in the dropdown menu. The
Largest Contentful Paint:[2s - 8s]query appears next toRUMfor queryb.
Query C
- To create query
c, click + Add Query. - Select
RUMas the data source for querycand enter@Type:view. - Press Enter or click Update query in the dropdown menu. The
Type:viewquery appears next toRUMfor queryc.
JSON configuration
To access the JSON code for this graph, click the JSON tab next to Edit.
Click the copy icon on the right hand corner to copy the quick graph JSON to your clipboard.
JSON
{
    "viz": "query_value",
    "requests": [
        {
            "formulas": [
                {
                    "formula": "(query1 + 0.5 * query2) / query3"
                }
            ],
            "queries": [
                {
                    "search": {
                        "query": "@type:view @view.largest_contentful_paint:<2000000000"
                    },
                    "data_source": "rum",
                    "compute": {
                        "aggregation": "count"
                    },
                    "name": "query1",
                    "indexes": [
                        "*"
                    ],
                    "group_by": []
                },
                {
                    "search": {
                        "query": "@type:view @view.largest_contentful_paint:[2000000000 TO 8000000000]"
                    },
                    "data_source": "rum",
                    "compute": {
                        "aggregation": "count"
                    },
                    "name": "query2",
                    "indexes": [
                        "*"
                    ],
                    "group_by": []
                },
                {
                    "search": {
                        "query": "@type:view"
                    },
                    "data_source": "rum",
                    "compute": {
                        "aggregation": "count"
                    },
                    "name": "query3",
                    "indexes": [
                        "*"
                    ],
                    "group_by": []
                }
            ],
            "response_format": "scalar",
            "conditional_formats": []
        }
    ],
    "autoscale": true,
    "precision": 2
}
Additional visualizations and Apdex scores
In the example above, the Apdex score is relevant to the View RUM events and Largest Contentful Paint performance metric.
You can also calculate other Apdex scores with the following methods:
- To see the Apdex score trend over time, select
Timeseriesinstead ofQuery Valuein Select your visualization. - To compute the Apdex score for a specific application, add an additional
@application.namequery and update your formula. - To compute the Apdex score with another RUM performance metric such as First Contentful Paint, replace
@view.LargestContentfulPaintwith@view.FirstContentfulPaintin the queries.
To compute additional performance indicators for your applications, determine what data points you need and which RUM events are relevant for you before creating a quick graph.
Further Reading
Additional helpful documentation, links, and articles:

