- Essentials
- Getting Started
- Datadog
- Datadog Site
- DevSecOps
- Serverless for AWS Lambda
- Agent
- Integrations
- Containers
- Dashboards
- Monitors
- Logs
- APM Tracing
- Profiler
- Tags
- API
- Service Catalog
- Session Replay
- Continuous Testing
- Synthetic Monitoring
- Incident Management
- Database Monitoring
- Cloud Security Management
- Cloud SIEM
- Application Security Management
- Workflow Automation
- CI Visibility
- Test Visibility
- Test Impact Analysis
- Code Analysis
- Learning Center
- Support
- Glossary
- Standard Attributes
- Guides
- Agent
- Integrations
- OpenTelemetry
- Developers
- Authorization
- DogStatsD
- Custom Checks
- Integrations
- Create an Agent-based Integration
- Create an API Integration
- Create a Log Pipeline
- Integration Assets Reference
- Build a Marketplace Offering
- Create a Tile
- Create an Integration Dashboard
- Create a Recommended Monitor
- Create a Cloud SIEM Detection Rule
- OAuth for Integrations
- Install Agent Integration Developer Tool
- Service Checks
- IDE Plugins
- Community
- Guides
- Administrator's Guide
- API
- Datadog Mobile App
- CoScreen
- Cloudcraft
- In The App
- Dashboards
- Notebooks
- DDSQL Editor
- Sheets
- Monitors and Alerting
- Infrastructure
- Metrics
- Watchdog
- Bits AI
- Service Catalog
- API Catalog
- Error Tracking
- Service Management
- Infrastructure
- Application Performance
- APM
- Continuous Profiler
- Database Monitoring
- Data Streams Monitoring
- Data Jobs Monitoring
- Digital Experience
- Real User Monitoring
- Product Analytics
- Synthetic Testing and Monitoring
- Continuous Testing
- Software Delivery
- CI Visibility
- CD Visibility
- Test Optimization
- Code Analysis
- Quality Gates
- DORA Metrics
- Security
- Security Overview
- Cloud SIEM
- Cloud Security Management
- Application Security Management
- AI Observability
- Log Management
- Observability Pipelines
- Log Management
- Administration
The Trace Pipeline
Collect traces from your intrumented applications to gain end-to-end visibility into your applications. Query and visualize distributed traces from the Trace Explorer, understand how requests flow through your microservices and easily investigate errors and performance issues.
With APM, both the ingestion and the retention of traces are fully customizable.
Ingestion mechanisms
Set up tracing to gain end-to-end visibility into your applications with fine-grained ingestion configuration. Make sure to capture complete traces, including all error and high-latency traces to never miss performance issues such as an application outage or an unresponsive service.
Ingestion controls
The Ingestion Control page overviews ingestion volumes and configuration settings across your services.
Generating metrics from spans
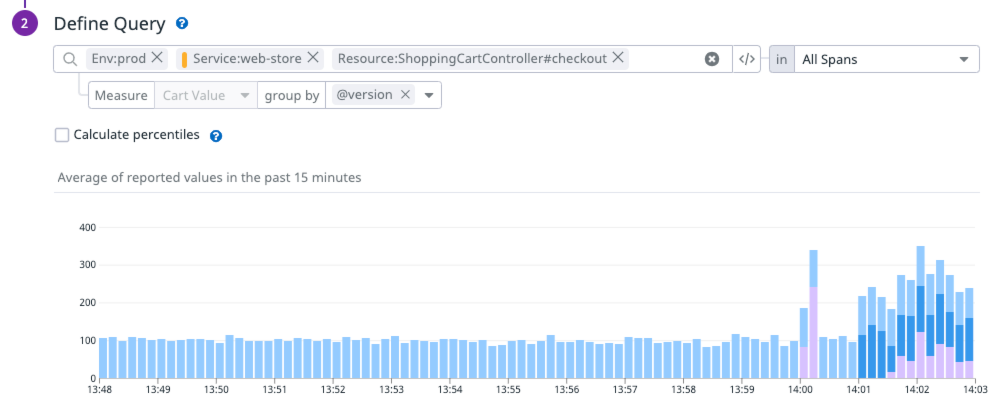
You can generate metrics from ingested spans, and use those custom metrics for queries and comparisons. Learn more in Generating Metrics from Spans.
Trace retention
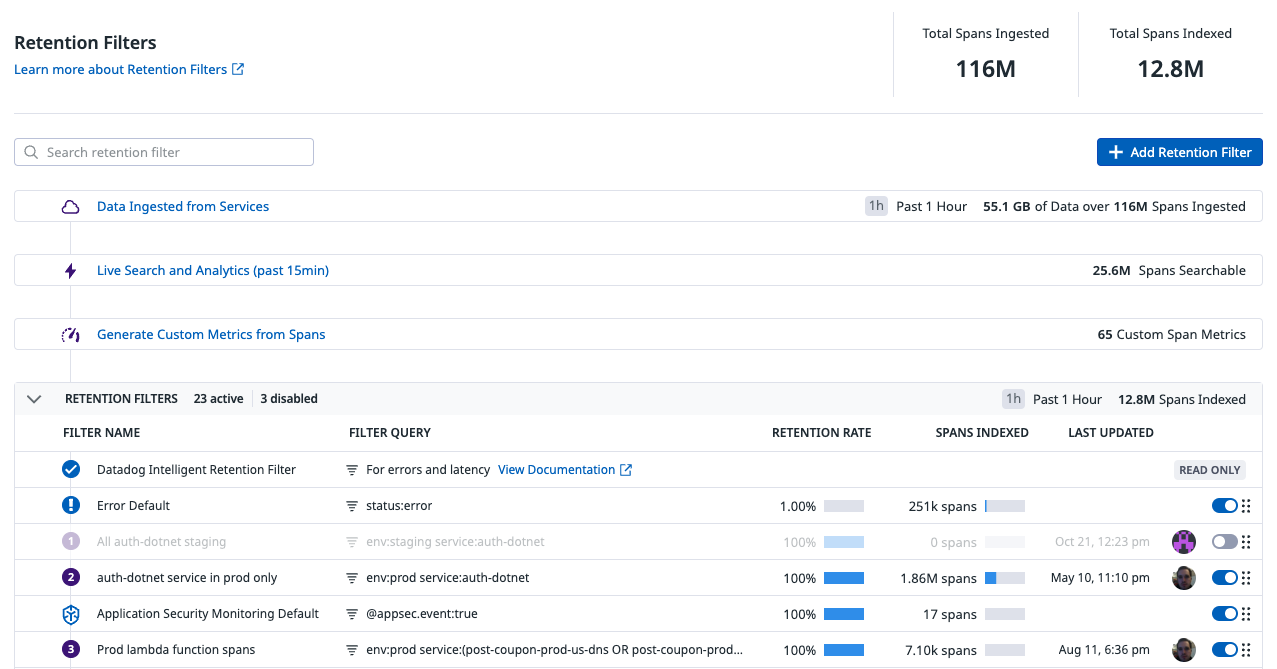
After spans have been ingested by Datadog, some are kept for 15 days according to the Retention Filters that have been set on your account. The Datadog Intelligent Retention Filter indexes a proportion of traces to help you monitor the health of your applications. Plus, you can define your own custom retention filters to index trace data you want to keep in support your organization’s goals.
Trace usage metrics
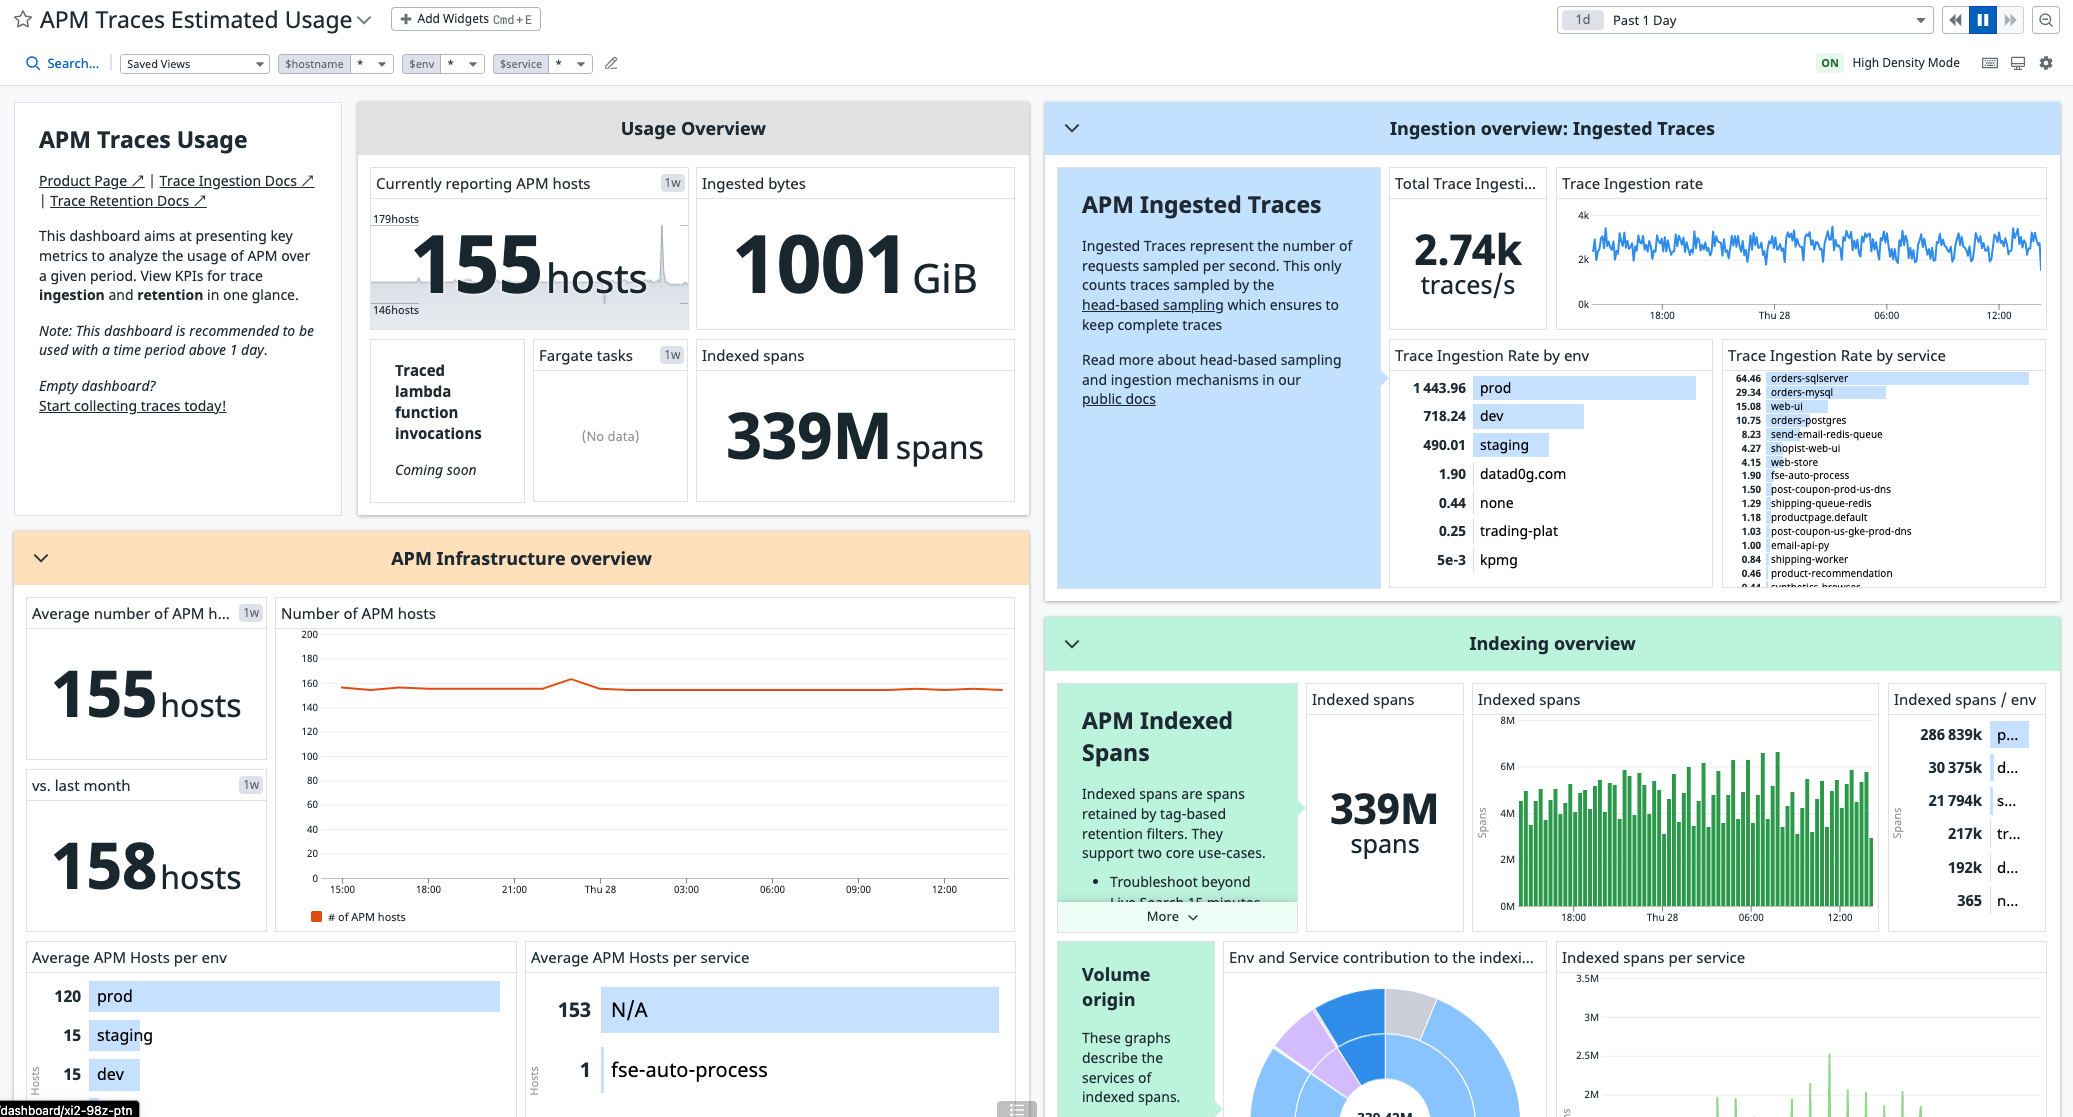
Learn about how to track and monitor your volume of ingested and indexed data, including using the APM Estimated Usage and Ingestion Reasons dashboards, by reading Usage Metrics.


