- Essentials
- Getting Started
- Datadog
- Datadog Site
- DevSecOps
- Serverless for AWS Lambda
- Agent
- Integrations
- Containers
- Dashboards
- Monitors
- Logs
- APM Tracing
- Profiler
- Tags
- API
- Service Catalog
- Session Replay
- Continuous Testing
- Synthetic Monitoring
- Incident Management
- Database Monitoring
- Cloud Security Management
- Cloud SIEM
- Application Security Management
- Workflow Automation
- CI Visibility
- Test Visibility
- Test Impact Analysis
- Code Analysis
- Learning Center
- Support
- Glossary
- Standard Attributes
- Guides
- Agent
- Integrations
- OpenTelemetry
- Developers
- Authorization
- DogStatsD
- Custom Checks
- Integrations
- Create an Agent-based Integration
- Create an API Integration
- Create a Log Pipeline
- Integration Assets Reference
- Build a Marketplace Offering
- Create a Tile
- Create an Integration Dashboard
- Create a Recommended Monitor
- Create a Cloud SIEM Detection Rule
- OAuth for Integrations
- Install Agent Integration Developer Tool
- Service Checks
- IDE Plugins
- Community
- Guides
- Administrator's Guide
- API
- Datadog Mobile App
- CoScreen
- Cloudcraft
- In The App
- Dashboards
- Notebooks
- DDSQL Editor
- Sheets
- Monitors and Alerting
- Infrastructure
- Metrics
- Watchdog
- Bits AI
- Service Catalog
- API Catalog
- Error Tracking
- Service Management
- Infrastructure
- Application Performance
- APM
- Continuous Profiler
- Database Monitoring
- Data Streams Monitoring
- Data Jobs Monitoring
- Digital Experience
- Real User Monitoring
- Product Analytics
- Synthetic Testing and Monitoring
- Continuous Testing
- Software Delivery
- CI Visibility
- CD Visibility
- Test Optimization
- Code Analysis
- Quality Gates
- DORA Metrics
- Security
- Security Overview
- Cloud SIEM
- Cloud Security Management
- Application Security Management
- AI Observability
- Log Management
- Observability Pipelines
- Log Management
- Administration
Watchdog Alerts
Overview
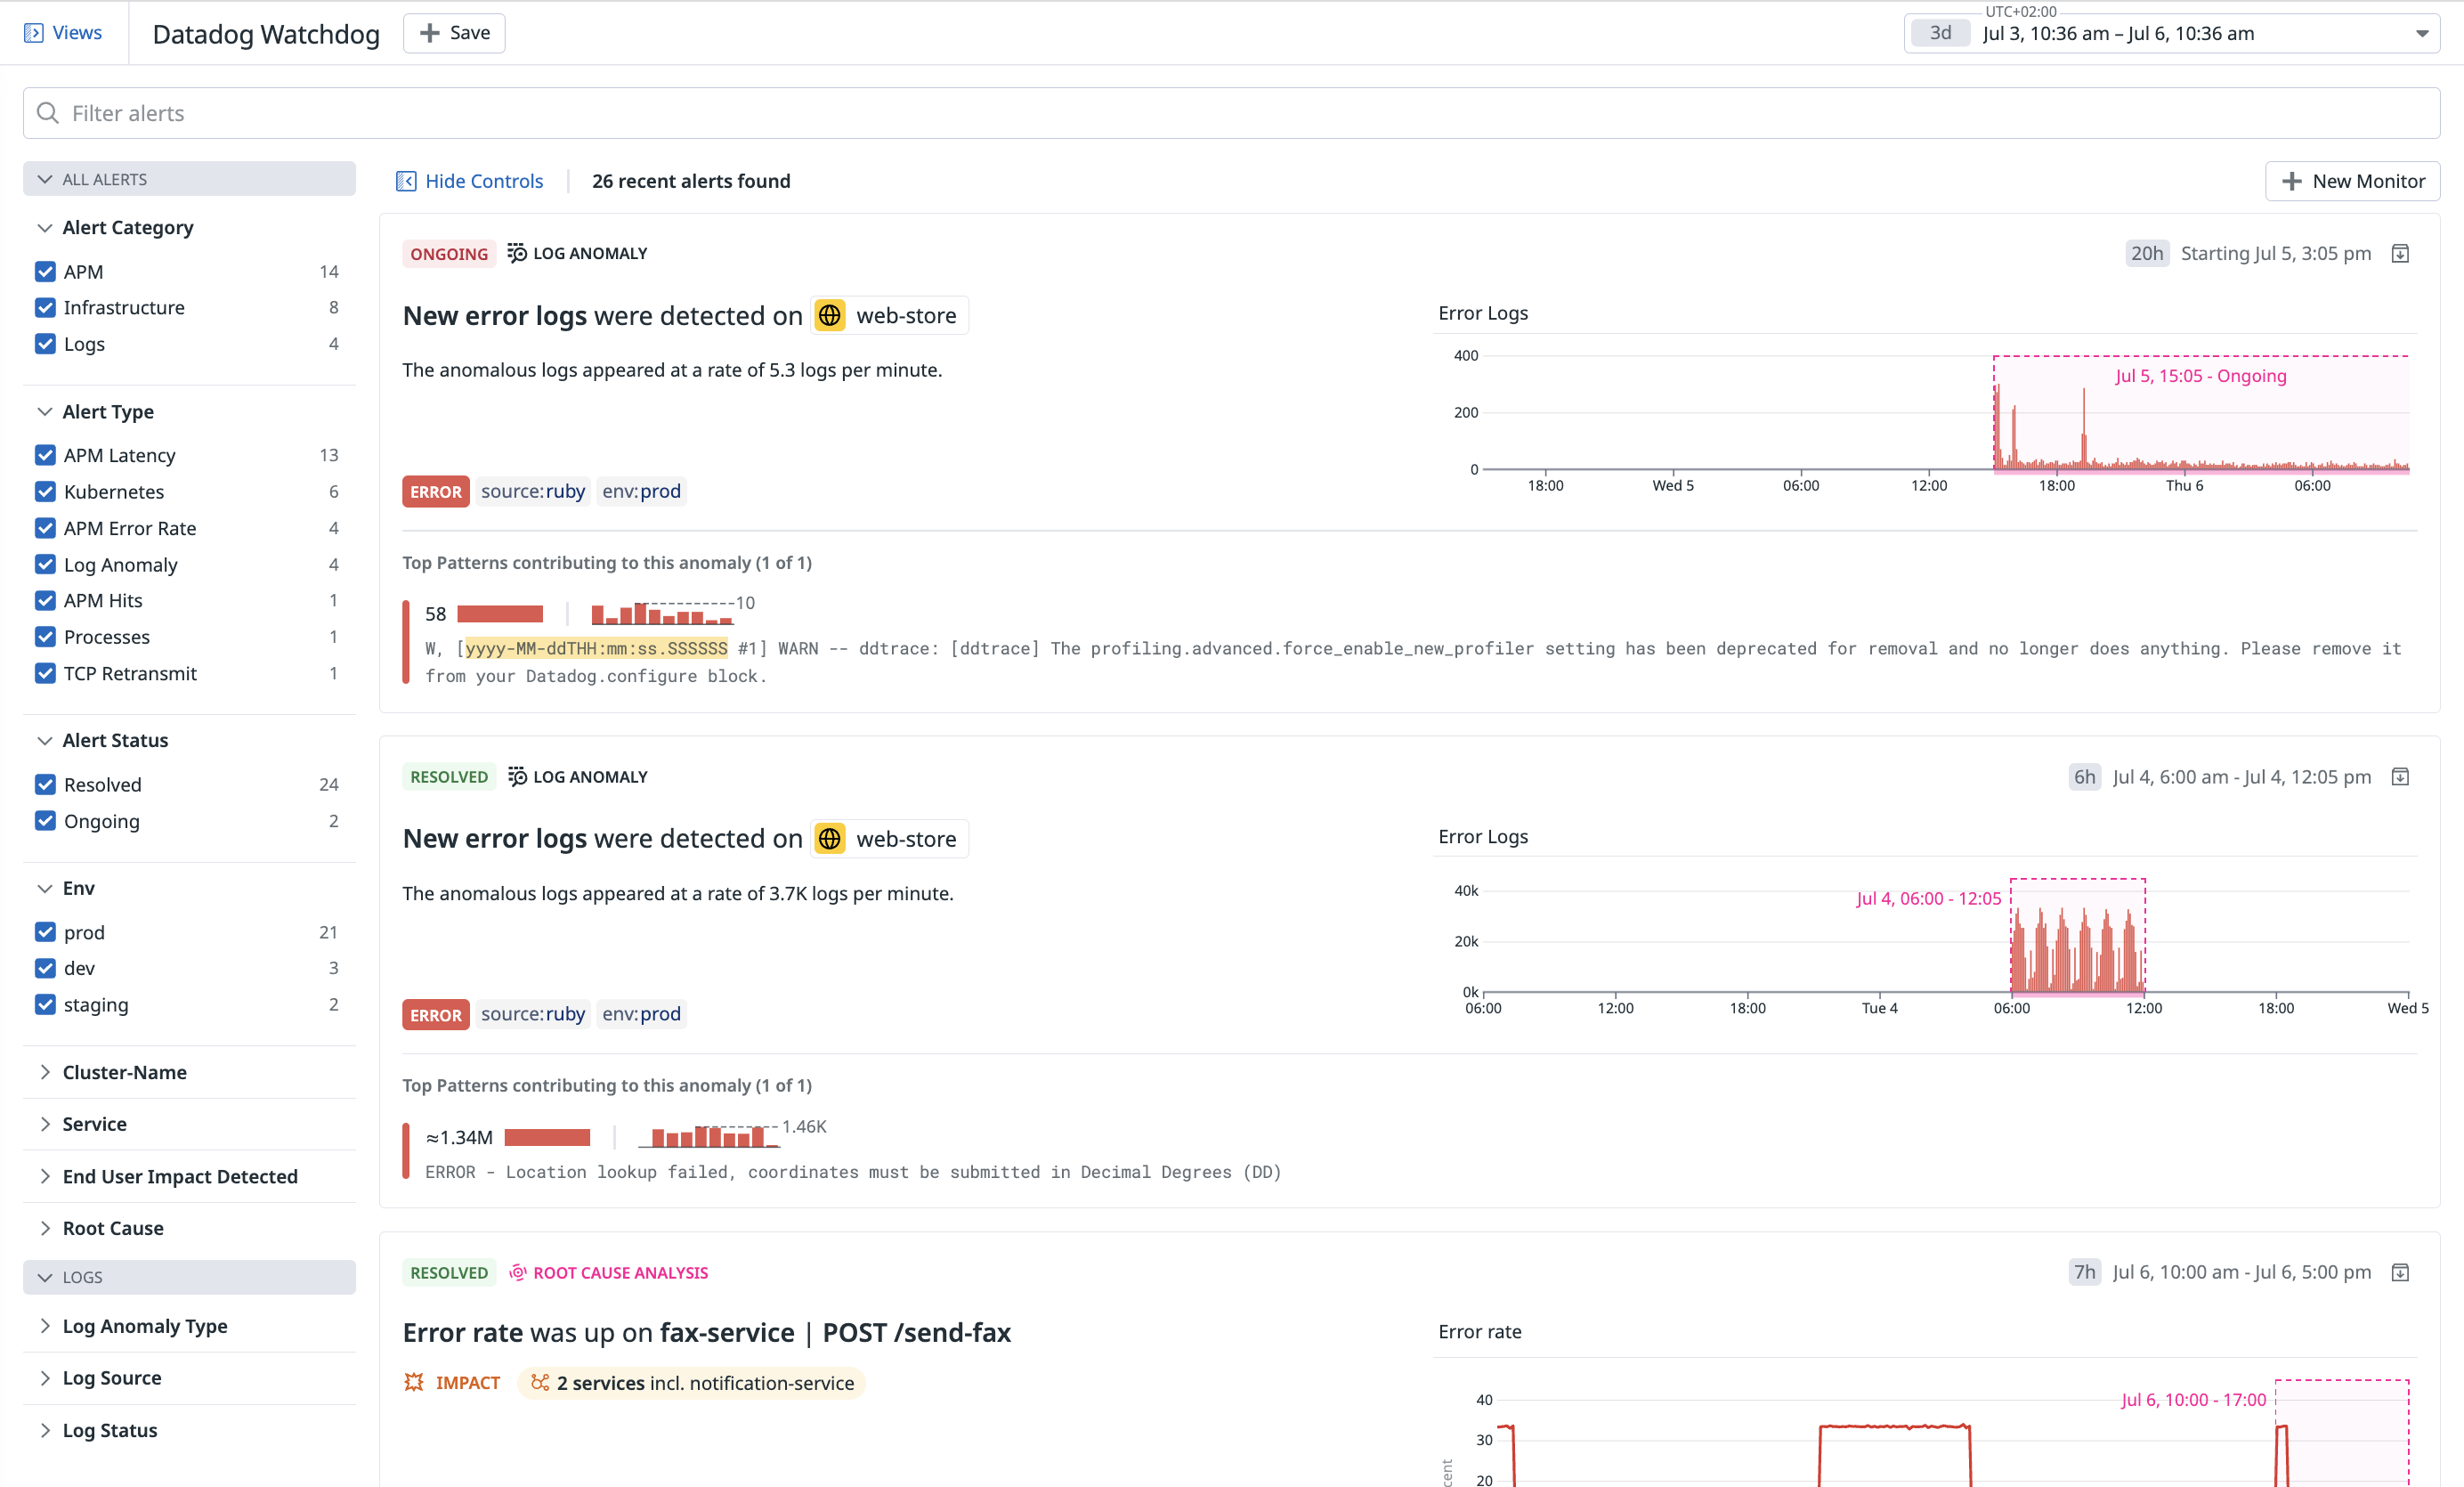
Watchdog proactively looks for anomalies on your systems and applications. Each anomaly is then displayed in the Watchdog Alert Explorer with more information about what happened, the possible impact on other systems, and the root cause.
Watchdog Alert details
An alert overview card contains the sections below:
- Status: The anomaly can be
ongoing,resolved, orexpired. (An anomaly isexpiredif it has been ongoing for over 48 hours.) - Timeline: Describes the time period over which the anomaly occurs.
- Message: Describes the anomaly.
- Graph: Visually represents the anomaly.
- Tags: Shows the scope of the anomaly.
- Impact (when available): Describes which users, views, or services the anomaly affects.
Clicking anywhere on an alert overview card opens the alerts details pane.
In addition to repeating the information in the alert overview card, the Overview tab may contain one or more of the following fields:
- Expected Bounds: Click the Show expected bounds checkbox. The graph changes color to differentiate between expected and anomalous behavior.
- Suggested Next Steps: Describes steps for investigation and triage of the anomalous behavior.
- Monitors: Lists monitors associated with your alert. Each monitor displayed has the metric of the current alert and its associated tags included in its scope.
Additionally, Watchdog suggests one or more monitors you can create to notify you if the anomaly happens again. These monitors do not exist yet, so the table lists their status as suggested. Click Enable Monitor to enable the suggested monitor for your organization. A series of icons pops up allowing you to open, edit, clone, mute, or delete the new monitor.
Watchdog Alert Explorer
You can use the time range, search bar, or facets to filter your Watchdog Alerts feed.
- Time range: Use the time range selector in the upper right to view alerts detected in a specific time range. You can view any alert that happened in the last 6 months.
- Search bar: Enter text in the Filter alerts search box to search over alert titles.
- Facets: The left side of the Watchdog Alerts feed contains the search facets below. Check the corresponding boxes to filter your alerts by facet.
Available facets:
| All Alerts Group | Description |
|---|---|
| Alert Category | Display all apm, infrastructure, or logs alerts. |
| Alert Type | Select alerts using metrics from APM or infrastructure integrations. |
| Alert Status | Select alerts based on their status (ongoing, resolved, or expired). |
| APM Primary Tag | The defined APM primary tag to display alerts from. |
| Environment | The environment to display alerts from. See Unified Service Tagging for more information about the env tag. |
| Service | The service to display alerts from. See Unified Service Tagging for more information about the service tag. |
| End User Impacted | (Requires RUM). If Watchdog found any end users impacted. See Impact Analysis for more information. |
| Root Cause | (Requires APM). If Watchdog found the root cause of the anomaly or the critical failure. See Root Cause Analysis for more information. |
| Team | The team owning the impacted services. Enriched from the Service Catalog. |
| Log Anomaly Type | Only display log anomalies of this type. The supported types are new log patterns and increases in existing log patterns. |
| Log Source | Only display alerts containing logs from this source. |
| Log Status | Only display alerts containing logs of this log status. |
Watchdog Alerts coverage
Watchdog Alerts cover multiple application and infrastructure metrics:
Ingested logs are analyzed at the intake level where Watchdog performs aggregations on detected patterns as well as environment, service, source, and status tags.
These aggregated logs are scanned for anomalous behaviors, such as the following:
- An emergence of logs with a warning or error status.
- A sudden increase of logs with a warning or error status.
All log anomalies are surfaced as Insights in the Log Explorer, matching the search context and any restrictions applied to your role.
Log anomalies that Watchdog determines to be particularly severe are surfaced in the Watchdog Alert Explorer and can be alerted on by setting up a Watchdog logs monitor.
A severe anomaly is defined as:
- Containing error logs.
- Lasting at least 10 minutes (to avoid transient errors).
- Having a significant increase (to avoid small increases).
- Having a low
noisescore (to avoid having a lot of alerts for a given service). Thenoisescore is calculated at the service level by:- Looking at the number of error patterns (the higher, the noisier).
- Computing how close the patterns are to each other (the closer, the noisier).
Required data history
Watchdog requires some data to establish a baseline of expected behavior. For log anomalies, the minimum history is 24 hours. Watchdog starts finding anomalies after the minimum required history is available, and Watchdog improves as history grows. Best performances are obtained with six weeks of history.
Disabling log anomaly detection
To disable log anomaly detection, go to the Log Management pipeline page and click the Log Anomalies toggle.
Watchdog scans all services and resources to look for anomalies on the following metrics:
- Error rate
- Latency
- Hits (request rate)
Watchdog filters out barely-used endpoints or services to reduce noise and avoid anomalies on small amounts of traffic. Additionally, if an anomaly on hit rate is detected but has no impact on latency or error rate, the anomaly is then ignored.
Required data history
Watchdog requires some data to establish a baseline of expected behavior. For metric anomalies, the minimum history is two weeks. Watchdog starts finding anomalies after the minimum required history is available, and Watchdog improves as history grows. Best performances are obtained with six weeks of history.
Watchdog scans all services and resources to look for anomalies on the following metrics:
- Error rate
- Latency
- Hits (request rate)
Watchdog filters out minimally-used endpoints and services to reduce noise and avoid anomalies on small amounts of traffic. Additionally, if an anomaly on hit rate is detected but has no impact on latency or error rate, the anomaly is ignored.
Required data history
Watchdog requires data to establish a baseline of expected behavior. For metric anomalies, the minimum history is two weeks. Watchdog starts finding anomalies after the minimum required history is available, and Watchdog improves as history grows. Best performances are obtained with six weeks of history.
Watchdog looks at infrastructure metrics from the following integrations:
- System, for host-level memory usage (memory leaks) and TCP retransmit rate.
- Redis
- PostgreSQL
- NGINX
- Docker
- Kubernetes
- Amazon Web Services:
Required data history
Watchdog requires some data to establish a baseline of expected behavior. For metric anomalies, the minimum history is two weeks. Watchdog starts finding anomalies after the minimum required history is available, and Watchdog improves as history grows. Best performances are obtained with six weeks of history.
Custom anomaly detection
Watchdog uses the same seasonal algorithms that power monitors and dashboards. To look for anomalies on other metrics or to customize the sensitivity, the following algorithms are available:
Where to find Watchdog Alerts
Watchdog Alerts appear in the following places within Datadog:
- The Watchdog Alert Explorer
- On any individual APM Service Page
- In the Service Catalog
- In the Watchdog Insights panel, available on all explorers
Watchdog binoculars on APM pages
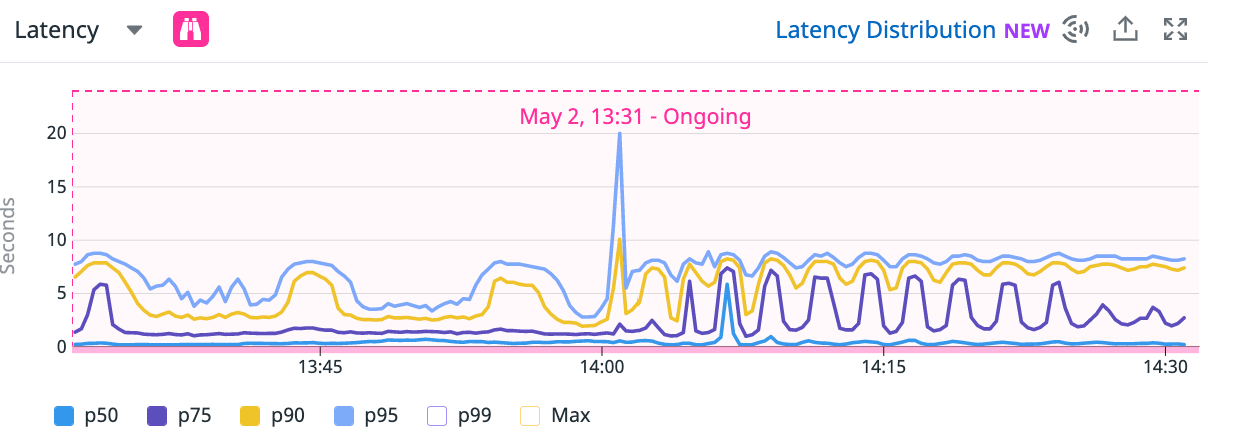
When Watchdog detects an irregularity in an APM metric, the pink Watchdog binoculars icon appears next to the impacted service in the APM Service Catalog.
You can see greater detail about a metric anomaly by navigating to the top of a Service Page with the Watchdog Insights carousel.
You can also find the Watchdog icon on metric graphs.
Click on the binoculars icon to see a Watchdog Alert card with more details.
Manage archived alerts
To archive a Watchdog Alert, open the side panel and click the folder icon in the upper-right corner. Archiving hides the alert from the explorer, as well as other places in Datadog, like the home page. If an alert is archived, the pink Watchdog binoculars icon does not show up next to the relevant service or resource.
To see archived alerts, select the checkbox option to Show N archived alerts in the top left of the Watchdog Alert Explorer. The option is only available if at least one alert is archived. You can see who archived each alert and when it was archived, and restore archived alerts to your feed.
Note: Archiving does not prevent Watchdog from flagging future issues related to the service or resource.


