- Essentials
- Getting Started
- Datadog
- Datadog Site
- DevSecOps
- Serverless for AWS Lambda
- Agent
- Integrations
- Containers
- Dashboards
- Monitors
- Logs
- APM Tracing
- Profiler
- Tags
- API
- Service Catalog
- Session Replay
- Continuous Testing
- Synthetic Monitoring
- Incident Management
- Database Monitoring
- Cloud Security Management
- Cloud SIEM
- Application Security Management
- Workflow Automation
- CI Visibility
- Test Visibility
- Test Impact Analysis
- Code Analysis
- Learning Center
- Support
- Glossary
- Standard Attributes
- Guides
- Agent
- Integrations
- OpenTelemetry
- Developers
- Authorization
- DogStatsD
- Custom Checks
- Integrations
- Create an Agent-based Integration
- Create an API Integration
- Create a Log Pipeline
- Integration Assets Reference
- Build a Marketplace Offering
- Create a Tile
- Create an Integration Dashboard
- Create a Recommended Monitor
- Create a Cloud SIEM Detection Rule
- OAuth for Integrations
- Install Agent Integration Developer Tool
- Service Checks
- IDE Plugins
- Community
- Guides
- Administrator's Guide
- API
- Datadog Mobile App
- CoScreen
- Cloudcraft
- In The App
- Dashboards
- Notebooks
- DDSQL Editor
- Sheets
- Monitors and Alerting
- Infrastructure
- Metrics
- Watchdog
- Bits AI
- Service Catalog
- API Catalog
- Error Tracking
- Service Management
- Infrastructure
- Application Performance
- APM
- Continuous Profiler
- Database Monitoring
- Data Streams Monitoring
- Data Jobs Monitoring
- Digital Experience
- Real User Monitoring
- Product Analytics
- Synthetic Testing and Monitoring
- Continuous Testing
- Software Delivery
- CI Visibility
- CD Visibility
- Test Optimization
- Code Analysis
- Quality Gates
- DORA Metrics
- Security
- Security Overview
- Cloud SIEM
- Cloud Security Management
- Application Security Management
- AI Observability
- Log Management
- Observability Pipelines
- Log Management
- Administration
Configure
Overview
Dashboards provide visibility into your data across Datadog products. Add details and configurations to expedite troubleshooting and add focus to the information you are visualizing.
Configure individual dashboards to:
- Add details and descriptive information on what the dashboard visualizes
- View configuration actions to customize your dashboard display and view dashboard related activities
- Restrict access to individual dashboards with Permissions
- Customize views with template variables
Dashboard details
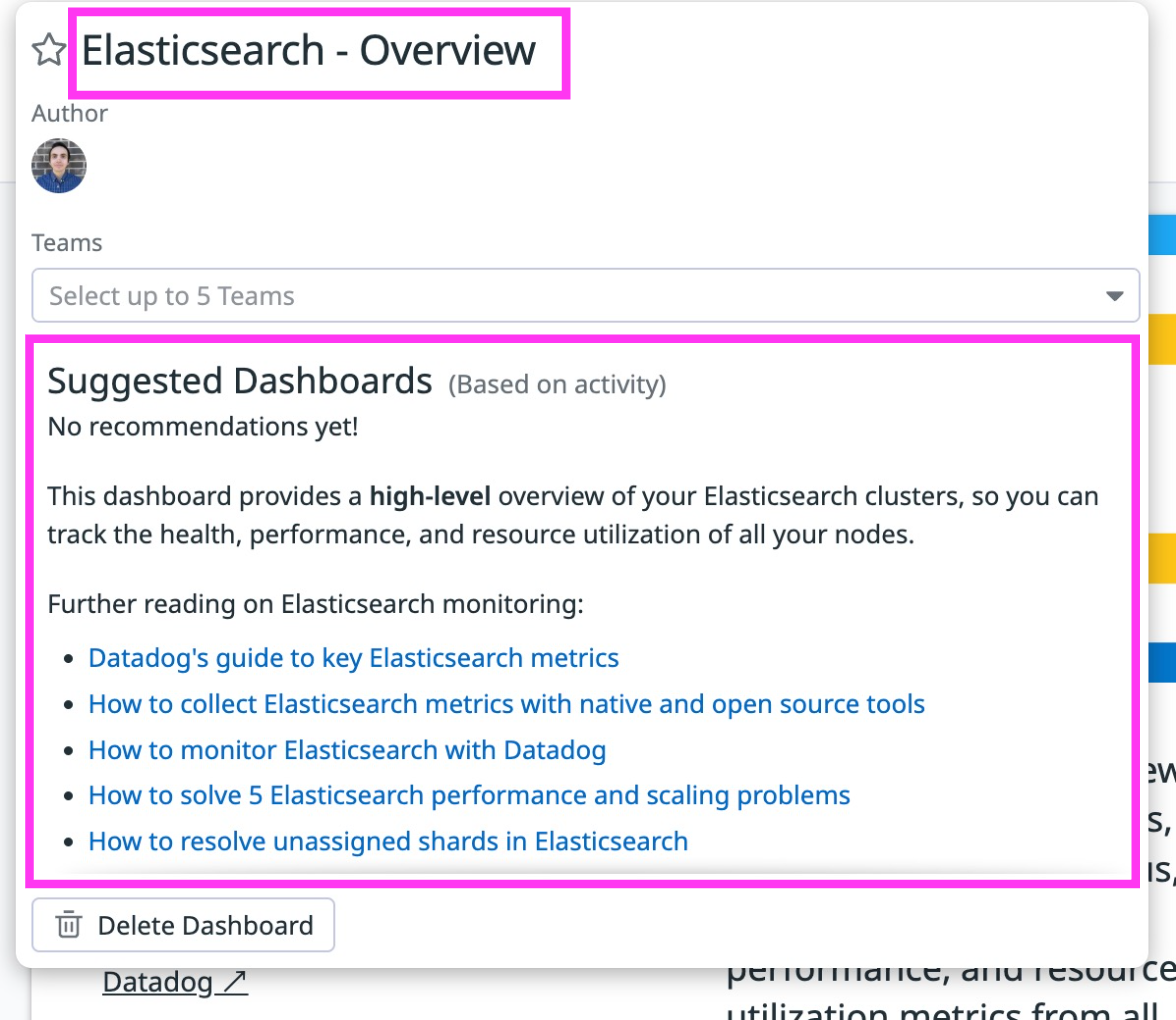
From an individual dashboard, hover over the dashboard title to view and edit dashboard details. A panel opens which displays the title and the creator.
Update Markdown-supported dashboard descriptions or associate teams with a dashboard:
- Hover the dashboard title. A dropdown panel opens.
- Click on the dashboard title or description to edit them.
- Click the check button, to change the title.
- Select up to 5 teams from the Teams dropdown.
- (Optional) Add
[[suggested_dashboards]]inside the dashboard description for a list of suggested dashboards. These dashboards are recommended based on the user activity in your organization and how often users go from this dashboard to other dashboards.
Template variables
Template variables allow you to focus your dashboards on a particular subset of hosts, containers, or services based on tags or facets. See the Template variables documentation to learn how to:
- Add and configure dashboard template variables
- Apply template variables to dashboard widgets
- Use template variables to create Saved views
Configuration actions
Click Configure to open a menu of configuration options available for your dashboard, including:
| Configuration | Description |
|---|---|
| Version history | Preview, restore, or clone your dashboard’s version history. For more information, see the Version History guide. |
| View audit events | See who is using this dashboard within your organization. As an individual, you can see a stream of your own actions. For more information, see Datadog Audit Trail. |
| Clone dashboard | Copy the entire dashboard to a new dashboard. You are prompted to name the clone. |
| Keyboard shortcuts | View a list of available keyboard shortcuts. |
| Display UTC time | Toggle between UTC time and your default time zone. |
| Increase density | High-density mode displays group widgets in a dashboard side-by-side for increased widget density. This mode turns on by default on large screens for dashboards that use group widgets. |
| TV Mode | Toggle to display key performance metrics on large screens or TVs. |
Notifications
Enable notifications tracking to receive change notifications for a dashboard. Any user in the organization can enable this for themselves, regardless of administrative privileges.
When notifications are activated for a dashboard, an event is created in the Events Explorer. This event provides information on text changes, widget changes, dashboard cloning, and dashboard deletion, along with the name of the user performing the action. View change events for a specific dashboard in the event explorer by searching:
tags:(audit AND dash) <DASHBOARD_NAME>
Copy, import, or export dashboard JSON
Copy, import, or export a dashboard’s JSON using the export icon (upper right) with the following options:
| Option | Description |
|---|---|
| Copy dashboard JSON | Copy the dashboard’s JSON to your clipboard. |
| Import dashboard JSON | Paste or import your JSON to the dashboard. This option overwrites all content on the dashboard. If the JSON is already on your clipboard, use Ctrl V (Cmd V for Mac). |
| Export dashboard JSON | Download a JSON file containing the JSON of your dashboard. |
Delete dashboard
Dashboards must be unstarred before deletion.
Use this option to permanently delete your dashboard. Use the preset Recently Deleted list to restore deleted dashboards. Dashboards in Recently Deleted are permanently deleted after 30 days. For more information, see the Dashboard list documentation.
Permissions
View restrictions on individual dashboards are available upon request to anyone on a paid plan. Reach out to your account team or Datadog support to enable this feature.
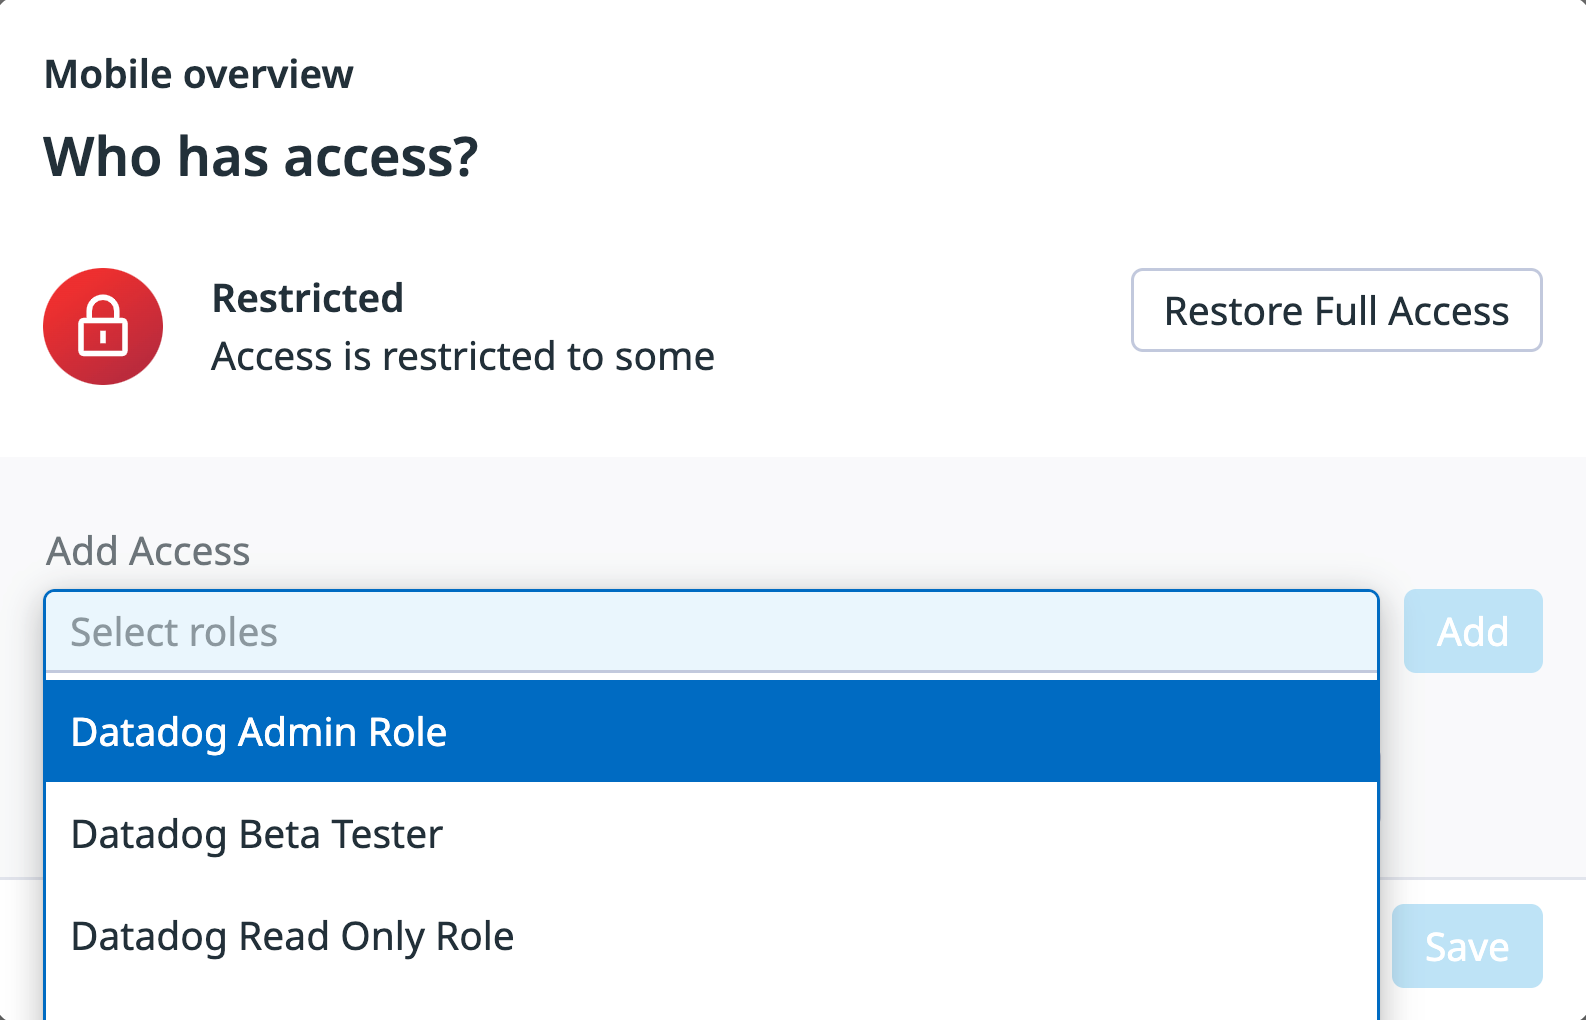
Use granular access controls to limit the roles that may edit a particular dashboard:
- While viewing a dashboard, click on the cog Configure in the upper right.
- Select Permissions.
- Click Restrict Access.
- The dialog box updates to show that members of your organization have Viewer access by default.
- Use the dropdown to select one or more roles, teams, or users that may edit the dashboard.
- Click Add.
- The dialog box updates to show that the role you selected has the Editor permission.
- Click Save.
Note: To maintain your edit access to the dashboard, the system requires you to include at least one role that you are a member of before saving. For more information about roles, see the RBAC documentation.
To restore general access to a dashboard with restricted access, follow the steps below:
- While viewing a dashboard, click on the cog Configure in the upper right.
- Select Permissions.
- Click Restore Full Access.
- Click Save.
If the dashboard was created with the deprecated “read only” setting, the access control list pre-populates with a list of roles that have the Access Management (user_access_manage) permission.
If you manage your dashboards with Terraform, you can use the latest version of the Datadog Terraform provider to control which roles can edit your dashboards. For more information, see the Terraform Dashboard role restriction guide.
The access indicator appears at the top right of each edit-restricted dashboard. Depending on your permissions, it may say Gain Edit Access or Request Edit Access. Click the access indicator to understand your access permissions and what steps to take to edit the dashboard.
Further Reading
Additional helpful documentation, links, and articles:


