- Principales informations
- Getting Started
- Datadog
- Site Datadog
- DevSecOps
- Serverless for AWS Lambda
- Agent
- Intégrations
- Conteneurs
- Dashboards
- Monitors
- Logs
- Tracing
- Profileur
- Tags
- API
- Service Catalog
- Session Replay
- Continuous Testing
- Surveillance Synthetic
- Incident Management
- Database Monitoring
- Cloud Security Management
- Cloud SIEM
- Application Security Management
- Workflow Automation
- CI Visibility
- Test Visibility
- Intelligent Test Runner
- Code Analysis
- Learning Center
- Support
- Glossary
- Standard Attributes
- Guides
- Agent
- Intégrations
- OpenTelemetry
- Développeurs
- Authorization
- DogStatsD
- Checks custom
- Intégrations
- Create an Agent-based Integration
- Create an API Integration
- Create a Log Pipeline
- Integration Assets Reference
- Build a Marketplace Offering
- Create a Tile
- Create an Integration Dashboard
- Create a Recommended Monitor
- Create a Cloud SIEM Detection Rule
- OAuth for Integrations
- Install Agent Integration Developer Tool
- Checks de service
- IDE Plugins
- Communauté
- Guides
- API
- Application mobile
- CoScreen
- Cloudcraft
- In The App
- Dashboards
- Notebooks
- DDSQL Editor
- Alertes
- Infrastructure
- Métriques
- Watchdog
- Bits AI
- Service Catalog
- API Catalog
- Error Tracking
- Service Management
- Infrastructure
- Universal Service Monitoring
- Conteneurs
- Sans serveur
- Surveillance réseau
- Cloud Cost
- Application Performance
- APM
- Profileur en continu
- Database Monitoring
- Agent Integration Overhead
- Setup Architectures
- Configuration de Postgres
- Configuration de MySQL
- Configuration de SQL Server
- Setting Up Oracle
- Setting Up MongoDB
- Connecting DBM and Traces
- Données collectées
- Exploring Database Hosts
- Explorer les métriques de requête
- Explorer des échantillons de requêtes
- Dépannage
- Guides
- Data Streams Monitoring
- Data Jobs Monitoring
- Digital Experience
- RUM et Session Replay
- Product Analytics
- Surveillance Synthetic
- Continuous Testing
- Software Delivery
- CI Visibility
- CD Visibility
- Test Visibility
- Exécuteur de tests intelligent
- Code Analysis
- Quality Gates
- DORA Metrics
- Securité
- Security Overview
- Cloud SIEM
- Cloud Security Management
- Application Security Management
- AI Observability
- Log Management
- Pipelines d'observabilité
- Log Management
- Administration
Kitepipe AtomWatch
Supported OS
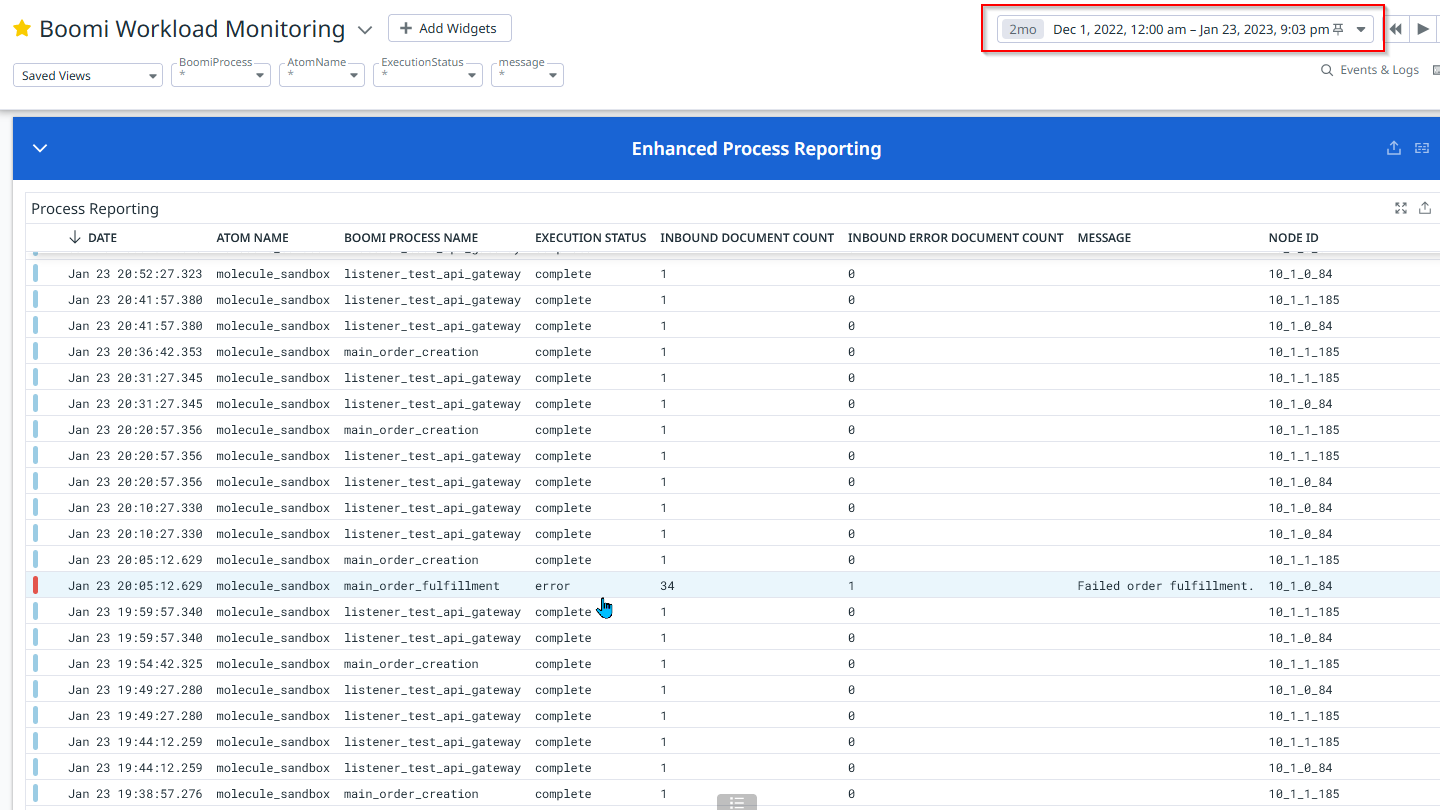
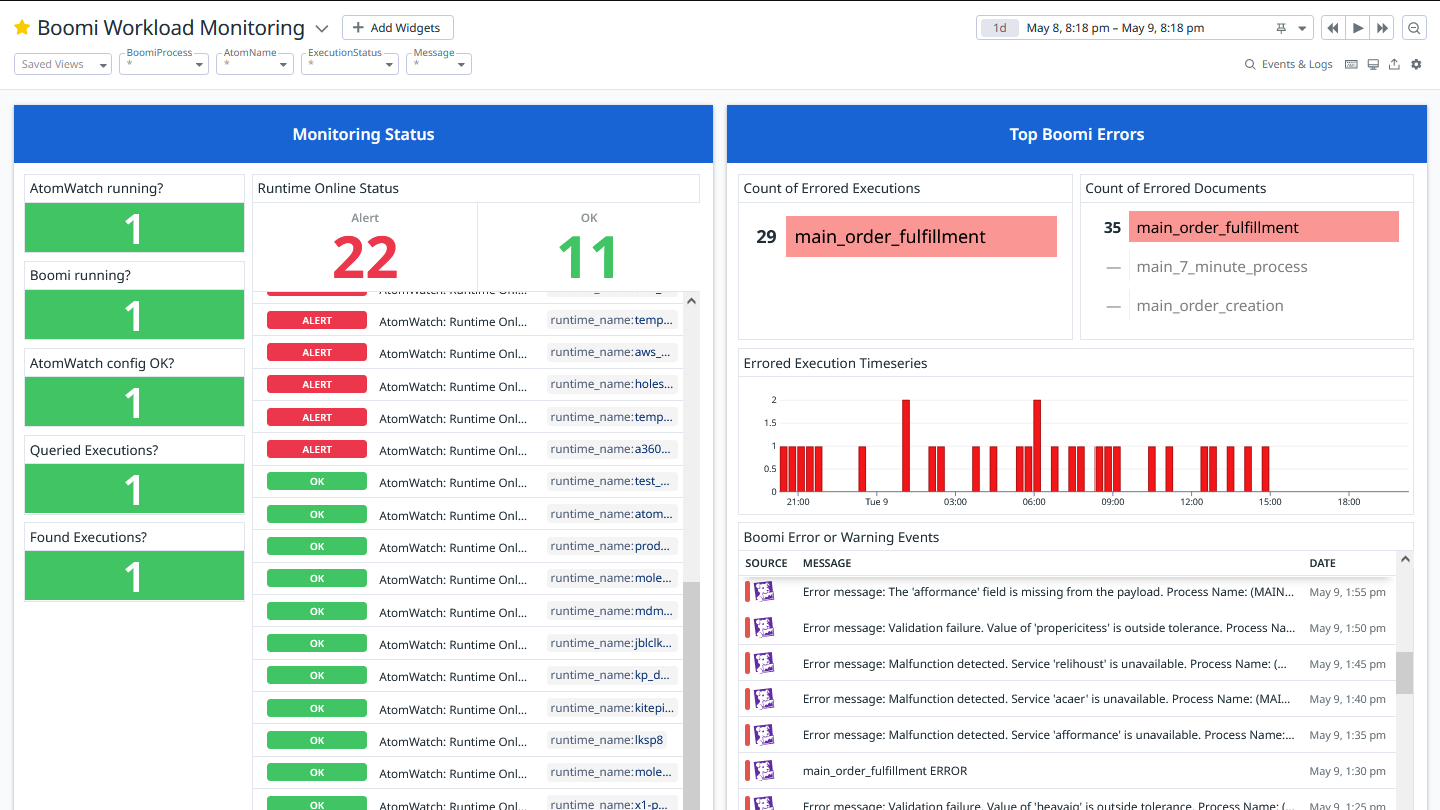
Enhanced Process Reporting lets you look back more than 30 days and filter by more fields, with wildcards.
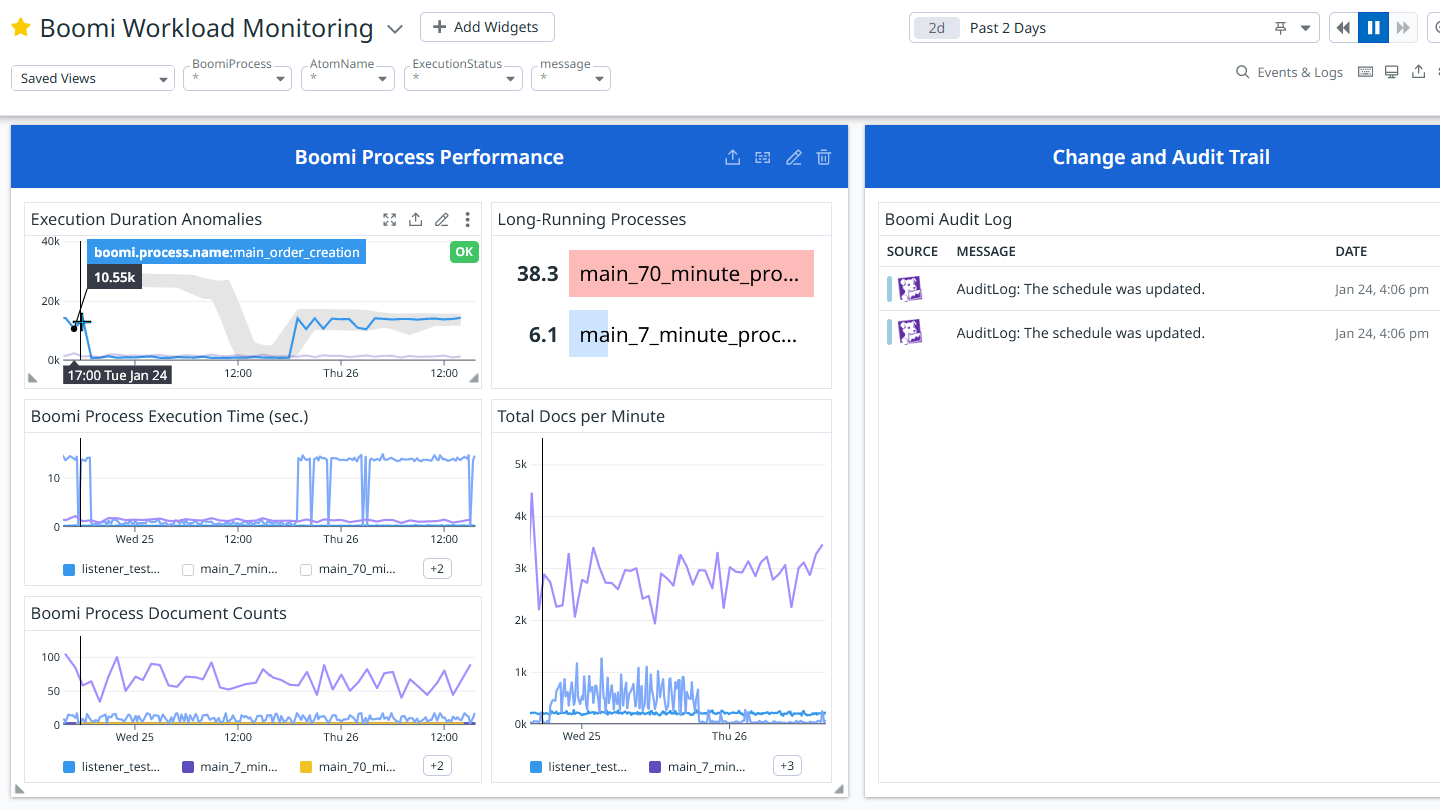
See long-running processes at a glance and receive alerts with anomaly detection.
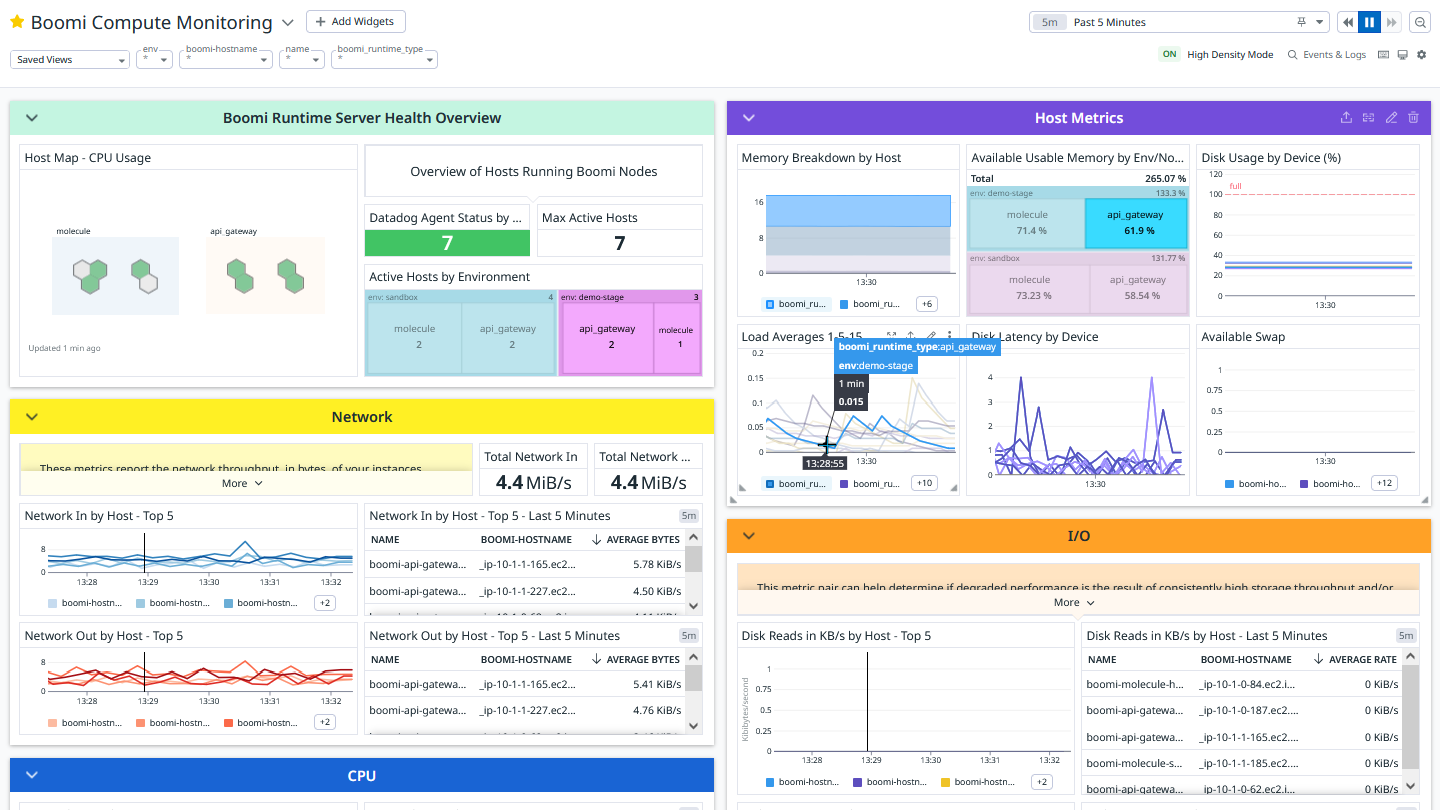
Extensive infrastructure monitoring including CPU, RAM, Disk, Network.
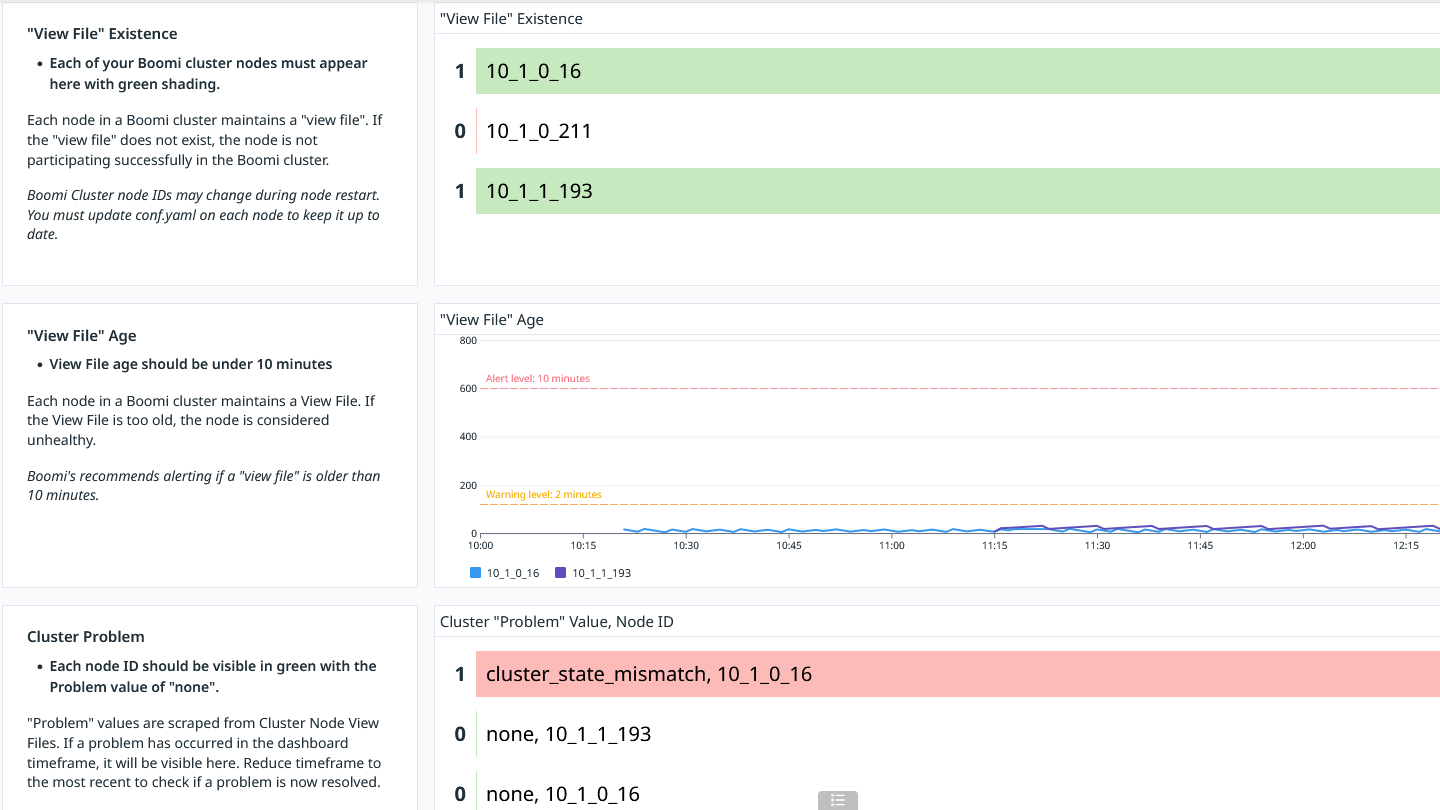
Cluster monitoring that exceeds Boomi's published recommendations.
Toplists and graphs of errored Boomi processes.
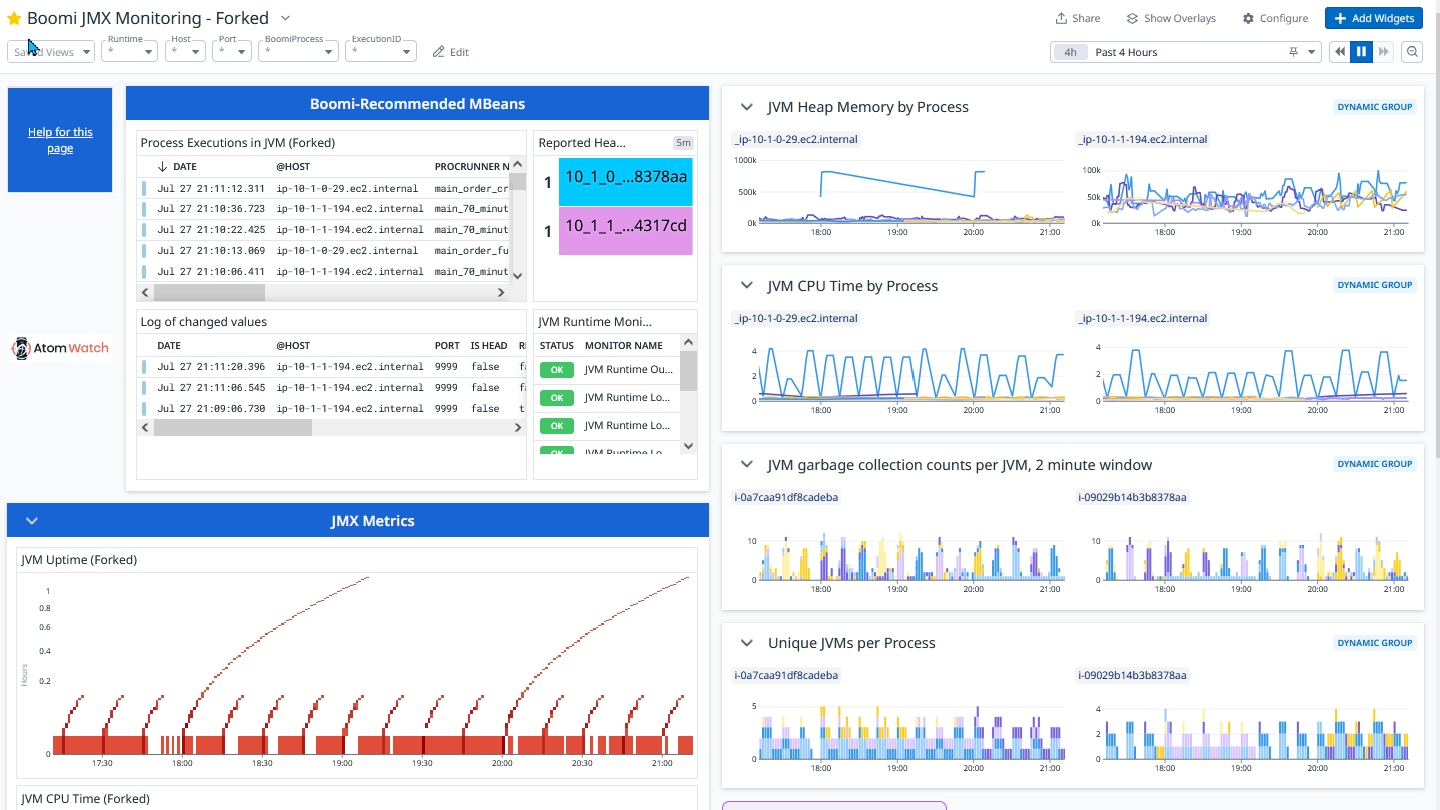
Supports JMX Monitoring.
Cette page n'est pas encore disponible en français, sa traduction est en cours.
Si vous avez des questions ou des retours sur notre projet de traduction actuel, n'hésitez pas à nous contacter.
Si vous avez des questions ou des retours sur notre projet de traduction actuel, n'hésitez pas à nous contacter.
Overview
AtomWatch by Kitepipe is an Agent-based integration that collects metrics from Boomi processes, cluster nodes, and related infrastructure to inform both Datadog and Boomi customers about the health of the integration.
AtomWatch version 1.2 contains 7 dashboards, 17 custom metrics, and 16 monitors that report on Boomi execution statistics, cluster status, JMX monitoring, and infrastructure health. These metrics are available to Datadog and Boomi customers for extended time-trending analysis (over the standard of 30 days for Boomi Process Reporting availability).
Datadog customers who purchase AtomWatch must manage the Boomi Java Runtime in either an Atom or Molecule configuration. Kitepipe includes a one hour set-up and configuration session with the initial 14 Day Free Trial.
About Kitepipe
Kitepipe is a Boomi Platinum Implementation Partner, and is the premier Boomi integration development team in North America. Kitepipe was founded in 2011 in response to the need for a Boomi-focused services team that could deliver all the promises of this powerful integration platform.
Today, the Kitepipe team of certified Boomi on-shore developers help dozens of Boomi customers quickly achieve business value with the industry-leading Boomi integration platform.
The Datadog service AtomWatch is a new offering from Kitepipe with a focus on Boomi managed services in AWS. Kitepipe is the leader in a number of integration areas, verticals, and domains, including AWS migrations of Boomi processes, AWS managed Boomi, Biotech vertical solutions built on Boomi, NetSuite, SAP, Coupa, Workday, and HRIS, Data Mart/BI, and more endpoints.
Log Collection
This integration makes API calls to the Boomi Platform on your behalf, retrieving execution records and sending them to Datadog as logs. It also optionally monitors in-progress executions and JVM telemetry through JMX, sending this information to Datadog as logs. You can see which Boomi processes are running in which JVMs, along with associated metrics such as memory usage, garbage collection, thread count, and more.
Events
This integration retrieves AuditLog records from the Boomi API, and sends them to Datadog as events. The events are visible in filtered form in the Boomi Workload Monitoring Dashboard or in the Events Explorer. You can build your own monitors to inspect the unfiltered AuditLog records.
Metrics
This integration submits metrics. You can explore a list of metrics in the Data Collected tab.
Support
For support or feature requests, reach out to AtomWatch through the following channel:
Kitepipe support hours for AtomWatch are designated during the business hours of 9AM to 3PM across US and Canadian time zones. AtomWatch troubleshooting requests will be answered within 24 to 48 hours from the notification receipt to the AtomWatch email alias.
For best response results, include the customer name, Boomi configuration, and a brief description of the event or troubleshooting question. Enhanced support programs are available from Kitepipe upon request.
Further Reading
Additional helpful documentation, links, and articles:
- AtomWatch Documentation
- Monitor your Boomi integrations with Kitepipe’s offering in the Datadog Marketplace
- Enabling JMX in Boomi
This application is made available through the Datadog Marketplace and is supported by a Datadog Technology Partner. To use it, purchase this application in the Marketplace.
