- Essentials
- Getting Started
- Datadog
- Datadog Site
- DevSecOps
- Serverless for AWS Lambda
- Agent
- Integrations
- Containers
- Dashboards
- Monitors
- Logs
- APM Tracing
- Profiler
- Tags
- API
- Service Catalog
- Session Replay
- Continuous Testing
- Synthetic Monitoring
- Incident Management
- Database Monitoring
- Cloud Security Management
- Cloud SIEM
- Application Security Management
- Workflow Automation
- CI Visibility
- Test Visibility
- Test Impact Analysis
- Code Analysis
- Learning Center
- Support
- Glossary
- Standard Attributes
- Guides
- Agent
- Integrations
- OpenTelemetry
- Developers
- Authorization
- DogStatsD
- Custom Checks
- Integrations
- Create an Agent-based Integration
- Create an API Integration
- Create a Log Pipeline
- Integration Assets Reference
- Build a Marketplace Offering
- Create a Tile
- Create an Integration Dashboard
- Create a Recommended Monitor
- Create a Cloud SIEM Detection Rule
- OAuth for Integrations
- Install Agent Integration Developer Tool
- Service Checks
- IDE Plugins
- Community
- Guides
- Administrator's Guide
- API
- Datadog Mobile App
- CoScreen
- Cloudcraft
- In The App
- Dashboards
- Notebooks
- DDSQL Editor
- Sheets
- Monitors and Alerting
- Infrastructure
- Metrics
- Watchdog
- Bits AI
- Service Catalog
- API Catalog
- Error Tracking
- Service Management
- Infrastructure
- Application Performance
- APM
- Continuous Profiler
- Database Monitoring
- Data Streams Monitoring
- Data Jobs Monitoring
- Digital Experience
- Real User Monitoring
- Product Analytics
- Synthetic Testing and Monitoring
- Continuous Testing
- Software Delivery
- CI Visibility
- CD Visibility
- Test Optimization
- Code Analysis
- Quality Gates
- DORA Metrics
- Security
- Security Overview
- Cloud SIEM
- Cloud Security Management
- Application Security Management
- AI Observability
- Log Management
- Observability Pipelines
- Log Management
- Administration
ngrok
Supported OS


ngrok HTTP request events overview dashboard
ngrok services platform
ngrok + datadog
Overview
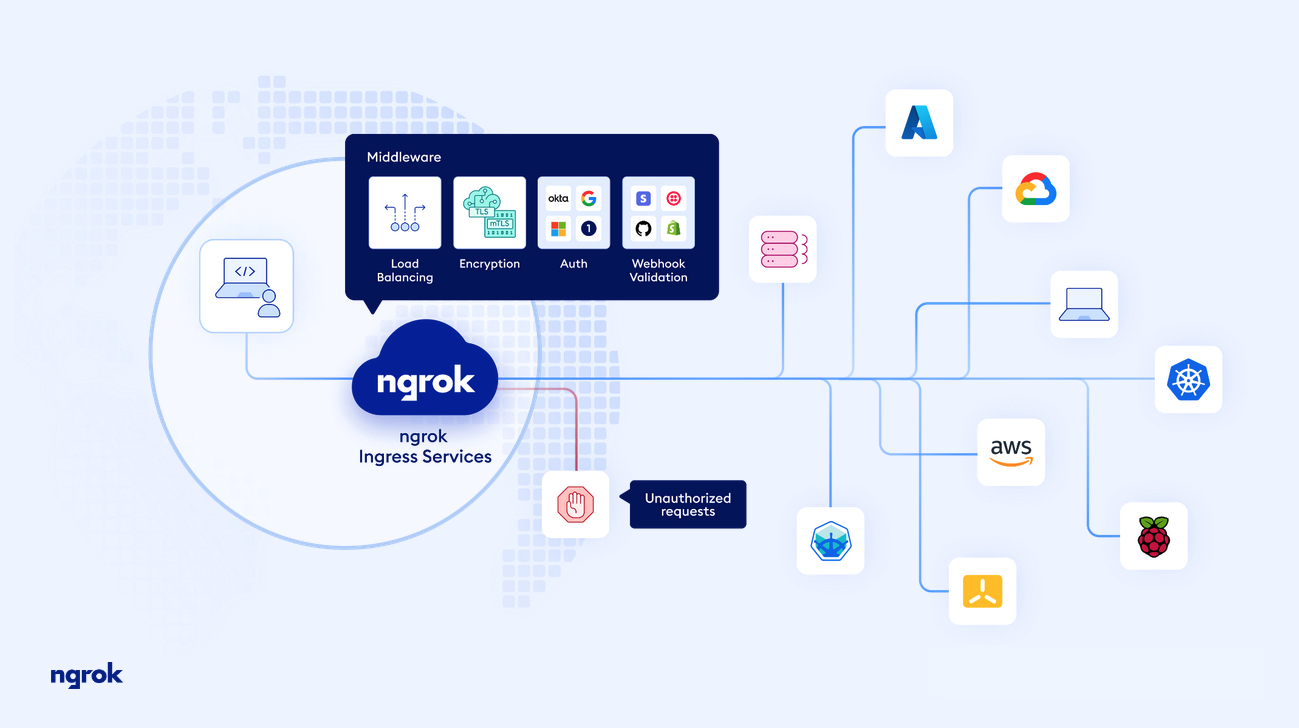
ngrok delivers instant ingress to your applications in any cloud, private network, or devices with authentication, load balancing, and other critical controls using our global points of presence.
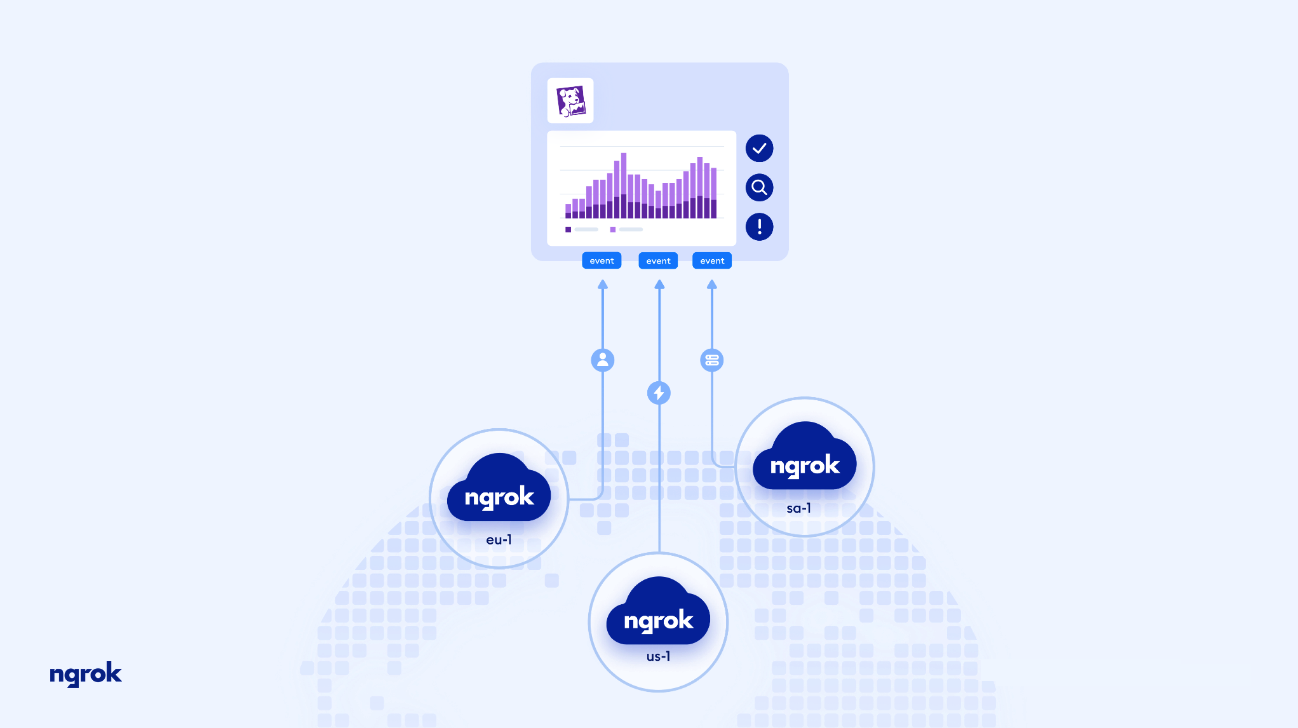
The ngrok platform includes a Datadog event destination integration. With ngrok HTTP events, you can visualize valuable application insights using Datadog Log Management including HTTP status code breakdown, top client IPs and most requested resources. You can use the Datadog HTTPS logging endpoint to set up the integration on the ngrok dashboard UI.
Setup
To forward ngrok events for consumption into Datadog, you need to make two configurations.
- ngrok Event Subscription: Contains which events to be forwarded
- ngrok Event Destination: The configuration for where the events defined in the Event Subscription are forwarded to.
The following example demonstrates how to configure an Event Subscription with a Datadog Event Destination for HTTP request events. For step-by-step instructions, see the ngrok Datadog Event Destination documentation.
Step 1: Create a ngrok Event Subscription
- In the ngrok Dashboard Console, navigate to Events page.
- Select “New Subscription”.
- Provide a Description for Subscription and select “Add Source”.
- From the list, select “http_request_complete.v0” and select Add Event Source.
Step 2: Configure Event Destination properties
The steps are performed within the previously created Event Subscription configuration:
- Navigate to the “Event Destination” tab and select “Add Destination”.
- From the dropdown menu, select Datadog and input the correct information:
a. Select the correct Datadog site for your data.
b. Navigate to Datadog and create an API key within the organization settings.
c. Copy the API key and paste into the API Key field.
d. Optionally, define a Service Name, this be added as a key to the event data as service:value.
e. Optionally, define DD Tags, these arekey:valuepairs to be added as Datadog tags to the event data.
f. Optional, define a description, this is locally significant and helps identify the Datadog Event Destination. - Select “Send Test Event”.
- If presented with a Success message, select “Done”. If an error is presented, validate that the Datadog site and API key are correct.
Step 3: Create Datadog Log Facets Once logs begin to arrive, create log facets for data analysis and dashboard visualization. For more information about creating log facets, see the Log Facets documentation.
Create facets for the following fields:
- event_type
- object.conn.server_name
- object.conn.client_ip
- object.http.response.status_code
- object.http.request.method
- object.http.request.url.path
Troubleshooting
Need help? Contact ngrok Support or reference the ngrok documentation.
Further Reading
Learn more about ngrok.
