riak.memory_atom
(gauge) | Total amount of memory currently allocated for atom storage
Shown as byte |
riak.memory_atom_used
(gauge) | Total amount of memory currently used for atom storage
Shown as byte |
riak.memory_binary
(gauge) | Total amount of memory used for binaries
Shown as byte |
riak.memory_code
(gauge) | Total amount of memory allocated for Erlang code
Shown as byte |
riak.memory_ets
(gauge) | Total memory allocated for Erlang Term Storage
Shown as byte |
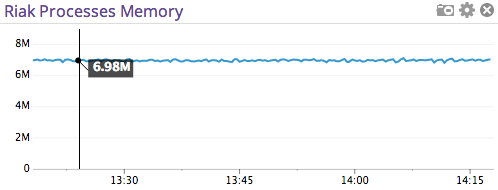
riak.memory_processes
(gauge) | Total amount of memory allocated for Erlang processes
Shown as byte |
riak.memory_processes_used
(gauge) | Total amount of memory used by Erlang processes
Shown as byte |
riak.memory_total
(gauge) | Total allocated memory (sum of processes and system)
Shown as byte |
riak.node_get_fsm_active_60s
(gauge) | Number of active GET FSMs |
riak.node_get_fsm_in_rate
(gauge) | Average number of GET FSMs enqueued by Sidejob |
riak.node_get_fsm_objsize_100
(gauge) | Object size encountered by this node
Shown as byte |
riak.node_get_fsm_objsize_95
(gauge) | Object size encountered by this node
Shown as byte |
riak.node_get_fsm_objsize_99
(gauge) | Object size encountered by this node
Shown as byte |
riak.node_get_fsm_objsize_mean
(gauge) | Object size encountered by this node
Shown as byte |
riak.node_get_fsm_objsize_median
(gauge) | Object size encountered by this node
Shown as byte |
riak.node_get_fsm_out_rate
(gauge) | Average number of GET FSMs dequeued by Sidejob |
riak.node_get_fsm_rejected_60s
(gauge) | Number of GET FSMs actively being rejected by Sidejob's overload protection |
riak.node_get_fsm_siblings_100
(gauge) | Number of siblings encountered during all GET operations by this node
Shown as node |
riak.node_get_fsm_siblings_95
(gauge) | Number of siblings encountered during all GET operations by this node
Shown as node |
riak.node_get_fsm_siblings_99
(gauge) | Number of siblings encountered during all GET operations by this node
Shown as node |
riak.node_get_fsm_siblings_mean
(gauge) | Number of siblings encountered during all GET operations by this node
Shown as node |
riak.node_get_fsm_siblings_median
(gauge) | Number of siblings encountered during all GET operations by this node
Shown as node |
riak.node_get_fsm_time_100
(gauge) | Time between reception of client GET request and subsequent response to client
Shown as microsecond |
riak.node_get_fsm_time_95
(gauge) | Time between reception of client GET request and subsequent response to client
Shown as microsecond |
riak.node_get_fsm_time_99
(gauge) | Time between reception of client GET request and subsequent response to client
Shown as microsecond |
riak.node_get_fsm_time_mean
(gauge) | Time between reception of client GET request and subsequent response to client
Shown as microsecond |
riak.node_get_fsm_time_median
(gauge) | Time between reception of client GET request and subsequent response to client
Shown as microsecond |
riak.node_gets
(count) | Number of GETs coordinated by this node
Shown as operation |
riak.node_put_fsm_active_60s
(gauge) | Number of active PUT FSMs |
riak.node_put_fsm_in_rate
(gauge) | Average number of PUT FSMs enqueued by Sidejob |
riak.node_put_fsm_out_rate
(gauge) | Average number of PUT FSMs dequeued by Sidejob |
riak.node_put_fsm_rejected_60s
(gauge) | Number of PUT FSMs actively being rejected by Sidejob's overload protection |
riak.node_put_fsm_time_100
(gauge) | Time between reception of client PUT request and subsequent response to client
Shown as microsecond |
riak.node_put_fsm_time_95
(gauge) | Time between reception of client PUT request and subsequent response to client
Shown as microsecond |
riak.node_put_fsm_time_99
(gauge) | Time between reception of client PUT request and subsequent response to client
Shown as microsecond |
riak.node_put_fsm_time_mean
(gauge) | Time between reception of client PUT request and subsequent response to client
Shown as microsecond |
riak.node_put_fsm_time_median
(gauge) | Time between reception of client PUT request and subsequent response to client
Shown as microsecond |
riak.node_puts
(gauge) | Number of PUTs coordinated by this node
Shown as operation |
riak.pbc_active
(gauge) | Number of active protocol buffers connections
Shown as connection |
riak.pbc_connects
(gauge) | Number of protocol buffers connections
Shown as connection |
riak.read_repairs
(gauge) | Number of read repair operations this this node has coordinated in the last minute
Shown as operation |
riak.search_index_fail_count
(gauge) | Total number of documents that have failed to index
Shown as object |
riak.search_index_fail_one
(gauge) | Number of documents that have failed to index in the past one minute
Shown as object |
riak.search_index_latency_95
(gauge) | Time between insertion of document and it being indexed: 95th percentile
Shown as microsecond |
riak.search_index_latency_99
(gauge) | Time between insertion of document and it being indexed: 99th percentile
Shown as microsecond |
riak.search_index_latency_999
(gauge) | Time between insertion of document and it being indexed: 99.9th percentile
Shown as microsecond |
riak.search_index_latency_max
(gauge) | Time between insertion of document and it being indexed: max
Shown as microsecond |
riak.search_index_latency_mean
(gauge) | Time between insertion of document and it being indexed: mean
Shown as microsecond |
riak.search_index_latency_median
(gauge) | Time between insertion of document and it being indexed: median
Shown as microsecond |
riak.search_index_latency_min
(gauge) | Time between insertion of document and it being indexed: min
Shown as microsecond |
riak.search_index_throughput_count
(gauge) | Total number of documents that have been indexed
Shown as operation |
riak.search_index_throughput_one
(gauge) | Number of documents that have been indexed in the last one minute
Shown as operation |
riak.search_query_fail_count
(gauge) | Total number of queries that have failed
Shown as event |
riak.search_query_fail_one
(gauge) | Number of queries that have failed in the last one minute
Shown as event |
riak.search_query_latency_95
(gauge) | Time between reception of query and response: 95th percentile
Shown as microsecond |
riak.search_query_latency_99
(gauge) | Time between reception of query and response: 99th percentile
Shown as microsecond |
riak.search_query_latency_999
(gauge) | Time between reception of query and response: 99.9th percentile
Shown as microsecond |
riak.search_query_latency_max
(gauge) | Time between reception of query and response: max
Shown as microsecond |
riak.search_query_latency_mean
(gauge) | Time between reception of query and response: mean
Shown as microsecond |
riak.search_query_latency_median
(gauge) | Time between reception of query and response: median
Shown as microsecond |
riak.search_query_latency_min
(gauge) | Time between reception of query and response: min
Shown as microsecond |
riak.search_query_throughput_count
(gauge) | Total number of queries that have been performed
Shown as operation |
riak.search_query_throughput_one
(gauge) | Number of searches that have been performed in the last one minute
Shown as operation |
riak.vnode_gets
(gauge) | Number of GET operations coordinated by vnodes on this node
Shown as operation |
riak.vnode_index_deletes
(gauge) | Number of vnode index delete operations
Shown as operation |
riak.vnode_index_reads
(gauge) | Number of vnode index read operations
Shown as read |
riak.vnode_index_writes
(gauge) | Number of vnode index write operations
Shown as write |
riak.vnode_puts
(count) | Number of PUT operations coordinated by vnodes on this node
Shown as operation |