- Essentials
- Getting Started
- Datadog
- Datadog Site
- DevSecOps
- Serverless for AWS Lambda
- Agent
- Integrations
- Containers
- Dashboards
- Monitors
- Logs
- APM Tracing
- Profiler
- Tags
- API
- Service Catalog
- Session Replay
- Continuous Testing
- Synthetic Monitoring
- Incident Management
- Database Monitoring
- Cloud Security Management
- Cloud SIEM
- Application Security Management
- Workflow Automation
- CI Visibility
- Test Visibility
- Intelligent Test Runner
- Code Analysis
- Learning Center
- Support
- Glossary
- Standard Attributes
- Guides
- Agent
- Integrations
- OpenTelemetry
- Developers
- Authorization
- DogStatsD
- Custom Checks
- Integrations
- Create an Agent-based Integration
- Create an API Integration
- Create a Log Pipeline
- Integration Assets Reference
- Build a Marketplace Offering
- Create a Tile
- Create an Integration Dashboard
- Create a Recommended Monitor
- Create a Cloud SIEM Detection Rule
- OAuth for Integrations
- Install Agent Integration Developer Tool
- Service Checks
- IDE Plugins
- Community
- Guides
- API
- Datadog Mobile App
- CoScreen
- Cloudcraft
- In The App
- Dashboards
- Notebooks
- DDSQL Editor
- Sheets
- Monitors and Alerting
- Infrastructure
- Metrics
- Watchdog
- Bits AI
- Service Catalog
- API Catalog
- Error Tracking
- Service Management
- Infrastructure
- Application Performance
- APM
- Continuous Profiler
- Database Monitoring
- Data Streams Monitoring
- Data Jobs Monitoring
- Digital Experience
- Real User Monitoring
- Product Analytics
- Synthetic Testing and Monitoring
- Continuous Testing
- Software Delivery
- CI Visibility
- CD Visibility
- Test Visibility
- Intelligent Test Runner
- Code Analysis
- Quality Gates
- DORA Metrics
- Security
- Security Overview
- Cloud SIEM
- Cloud Security Management
- Application Security Management
- AI Observability
- Log Management
- Observability Pipelines
- Log Management
- Administration
Alerting With RUM Data
Overview
Real User Monitoring allows you to create alerts which notify you about atypical behavior in your applications. You can create RUM monitors with complex conditions, predefined thresholds, and multiple queries to calculate averages, ratios, and performance indicator metrics (such as Apdex).
Define your search query
To create a RUM monitor, see the RUM Monitor documentation first. You can add one or many queries to filter through your RUM data in the RUM Explorer. For each query, you can scope it on an application level or a more granular level like a specific page.
You can use any facets that RUM collects, including custom facets and measures. Use the measure by field to measure view-related counts such as load time, time spent, and error count.
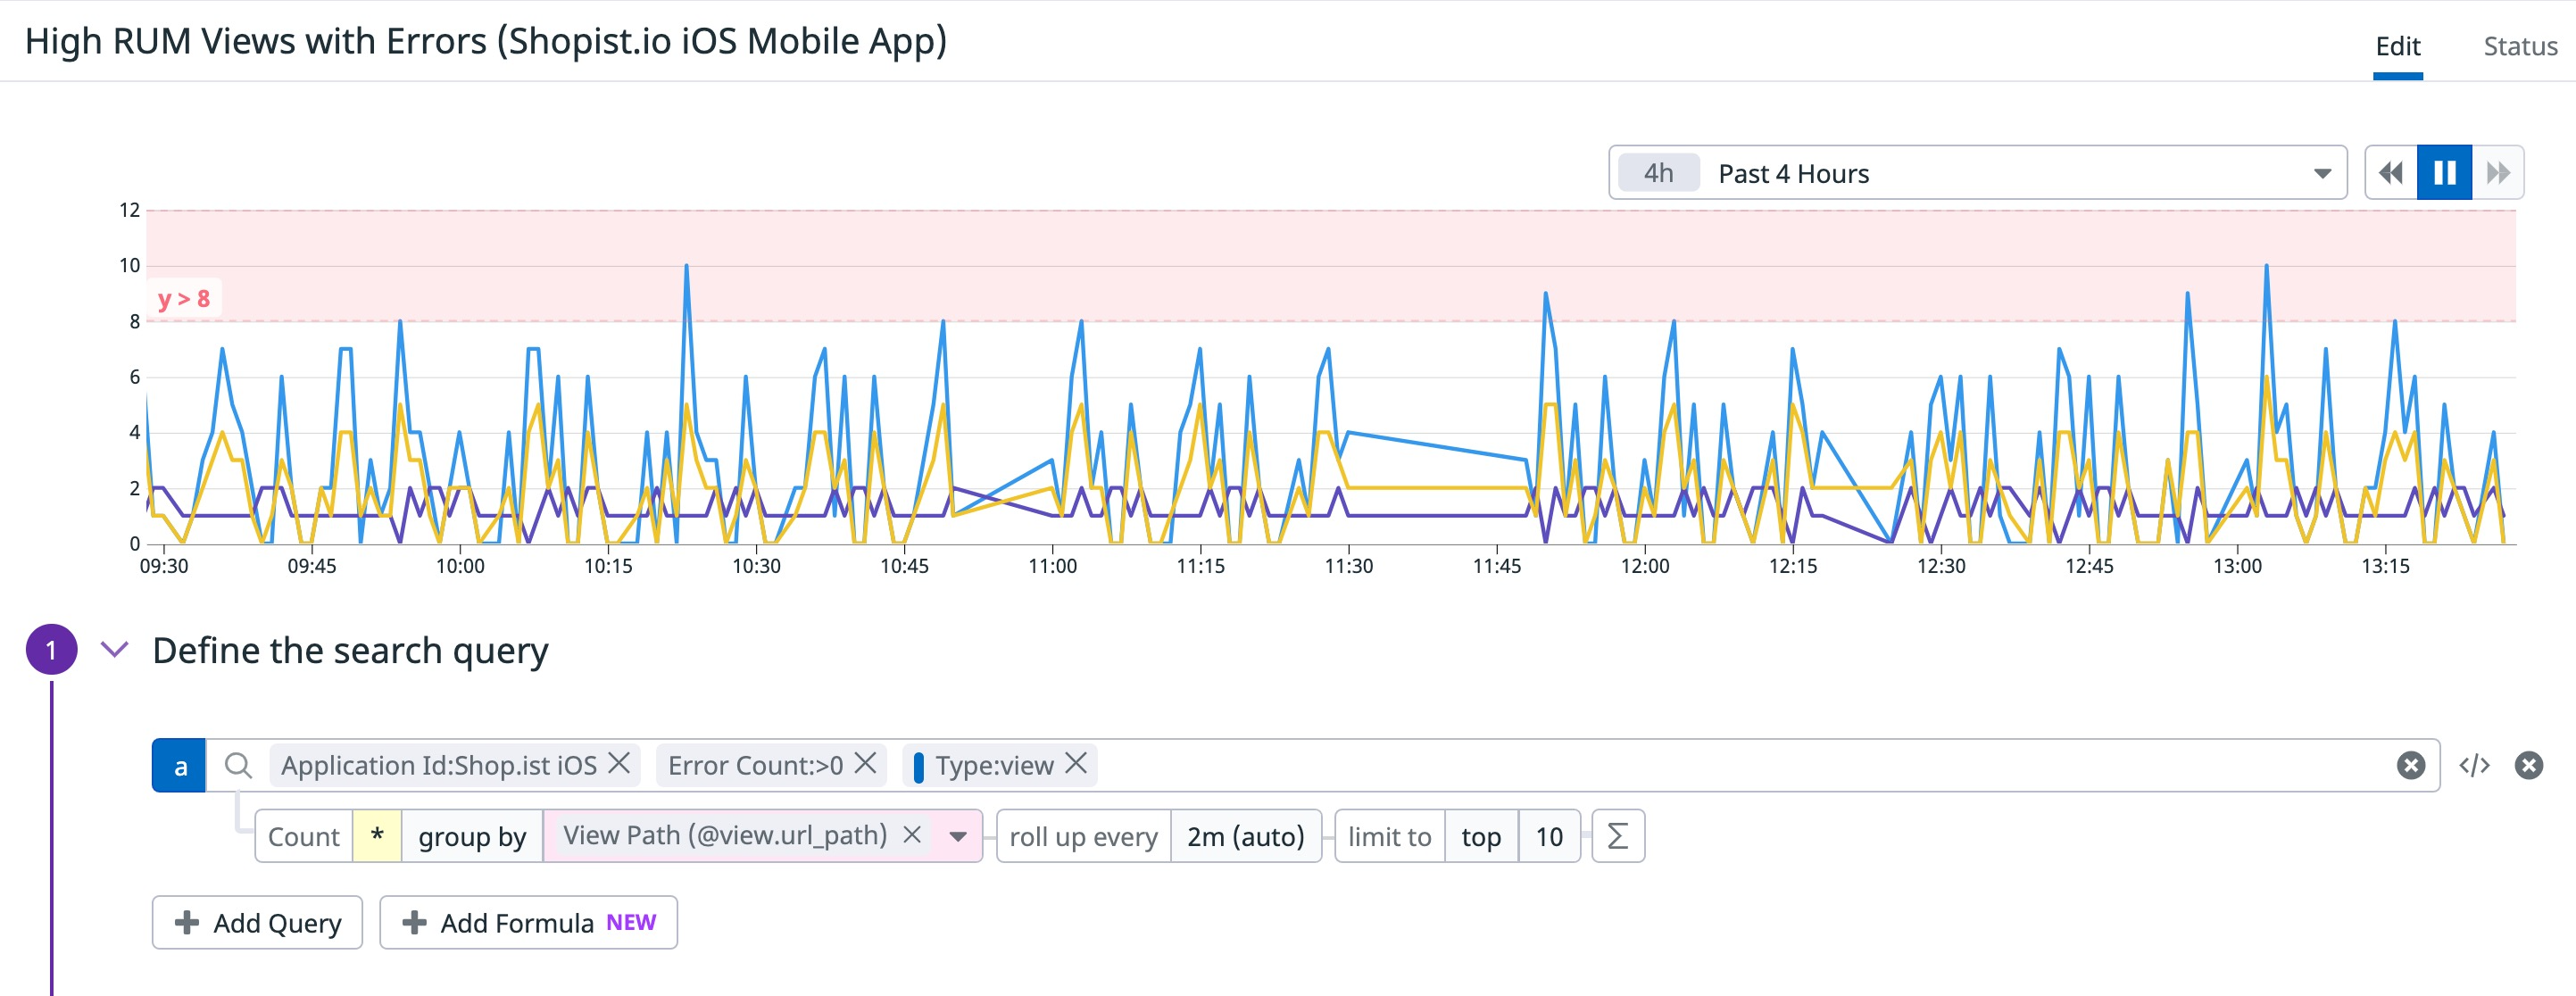
The example above is a search query for a RUM monitor configured for views on the Shopist iOS application with facets such as Application ID and View Path. This example monitor alerts when a view has a high amount of errors (for example, more than 8).
Export your query to a monitor
You can export search queries from the RUM Explorer to a monitor to retain all the context for the query.
The example above is a search query for a RUM monitor configured for images that are larger than 1Mb. Large images may reduce your application’s performance.
Click the Export button to export your search query to a pre-configured RUM monitor. For more information, see Export RUM Events.
Route your alert
Once you have created an alert, route the alert to an individual or a team channel by writing a message and sending a test notification. For more information, see Notifications.
Alerting examples
The following examples highlight use cases for alerting with your RUM data.
Revenue dips
With RUM’s global context, you can enrich your RUM events with business-specific attributes such as the purchase amount for each user.
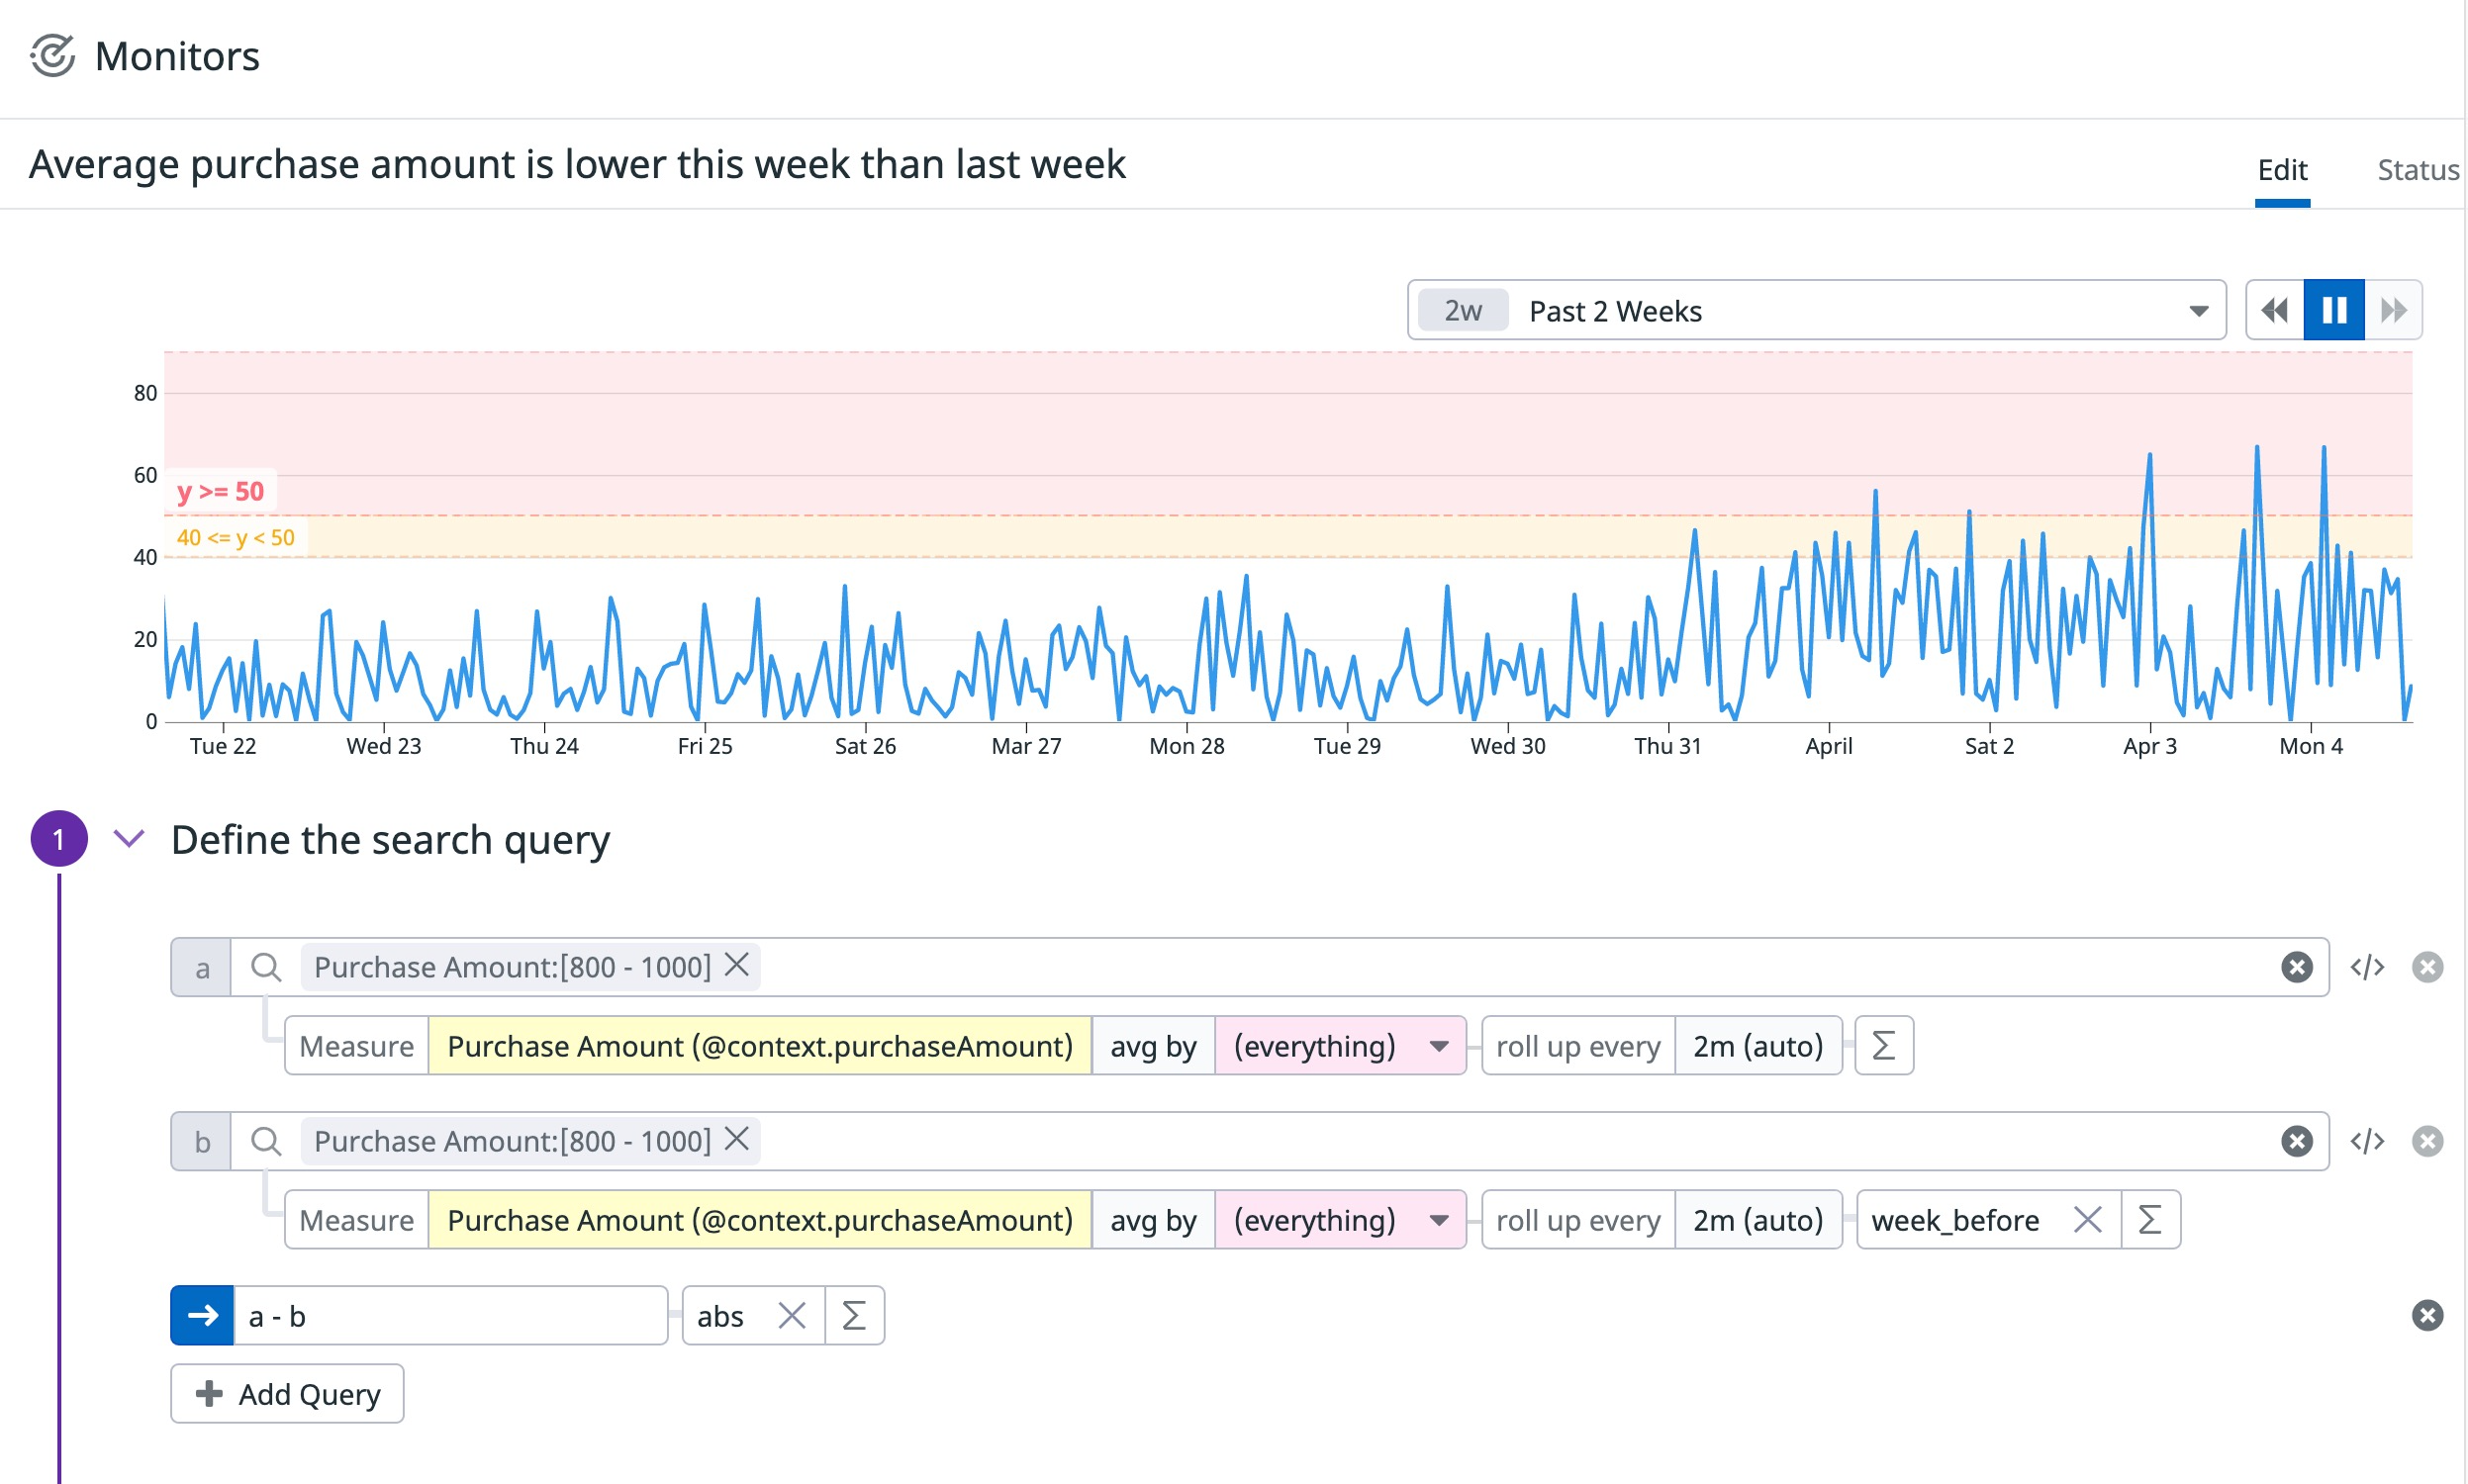
Assuming that most users of the example application spend between $800 to $1000, this example shows a RUM monitor configured to spot deviations in users’ spending patterns week by week.
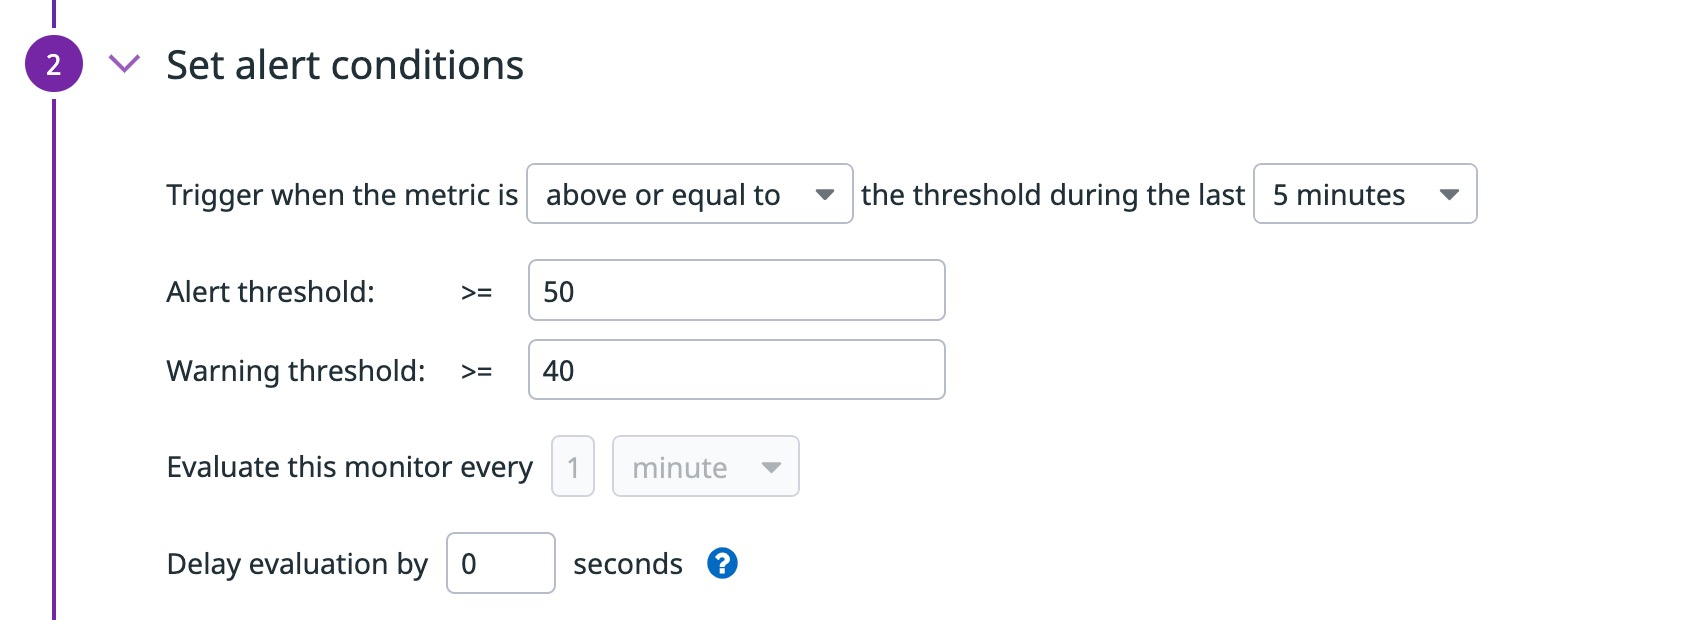
To compare this week’s spending to last week’s spending, add a function such as week_before next to the roll up every field. You can also apply the absolute value to calculate the difference in purchasing amount from last week to this week. When the week-over-week difference exceeds $50, the alert sends a notification.
Error rates
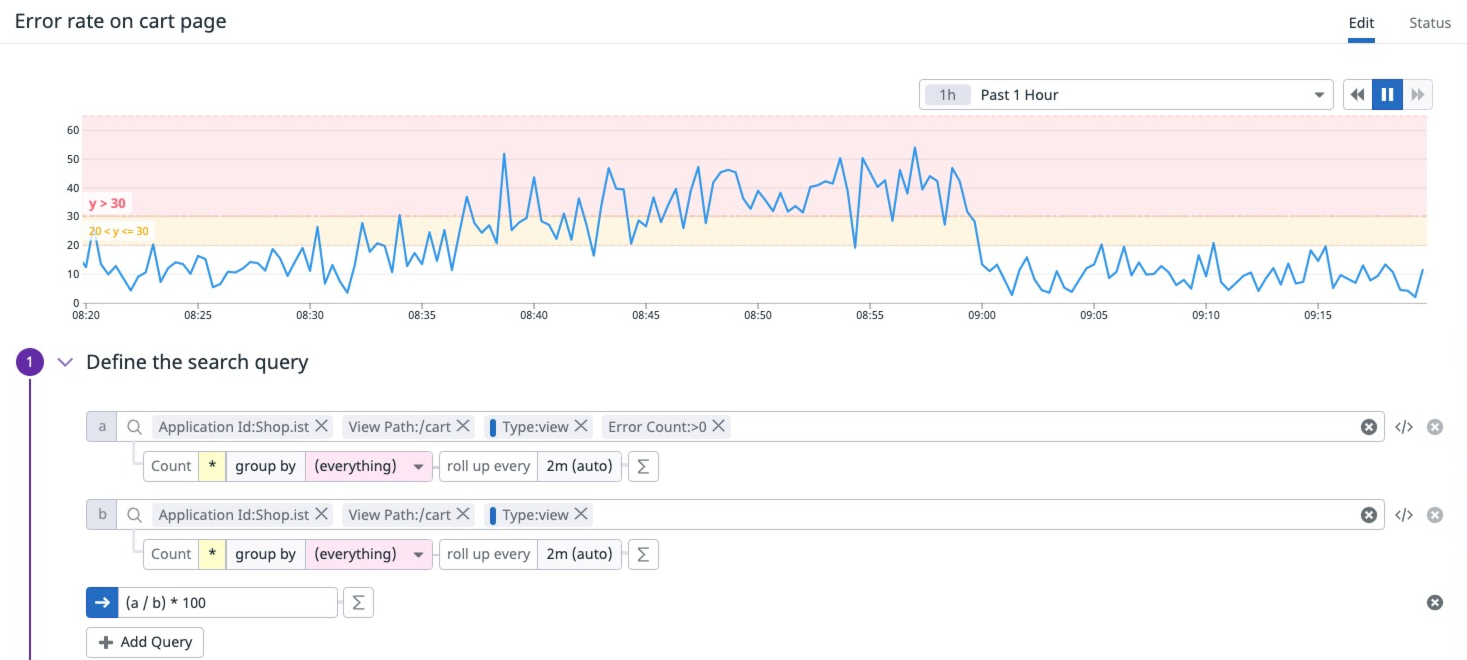
The ratio of errors to requests allows you to calculate what percentage of requests are resulting in errors.
This example shows a RUM monitor for the error rate of the /cart page on a sample Shop.ist application.
Performance vitals
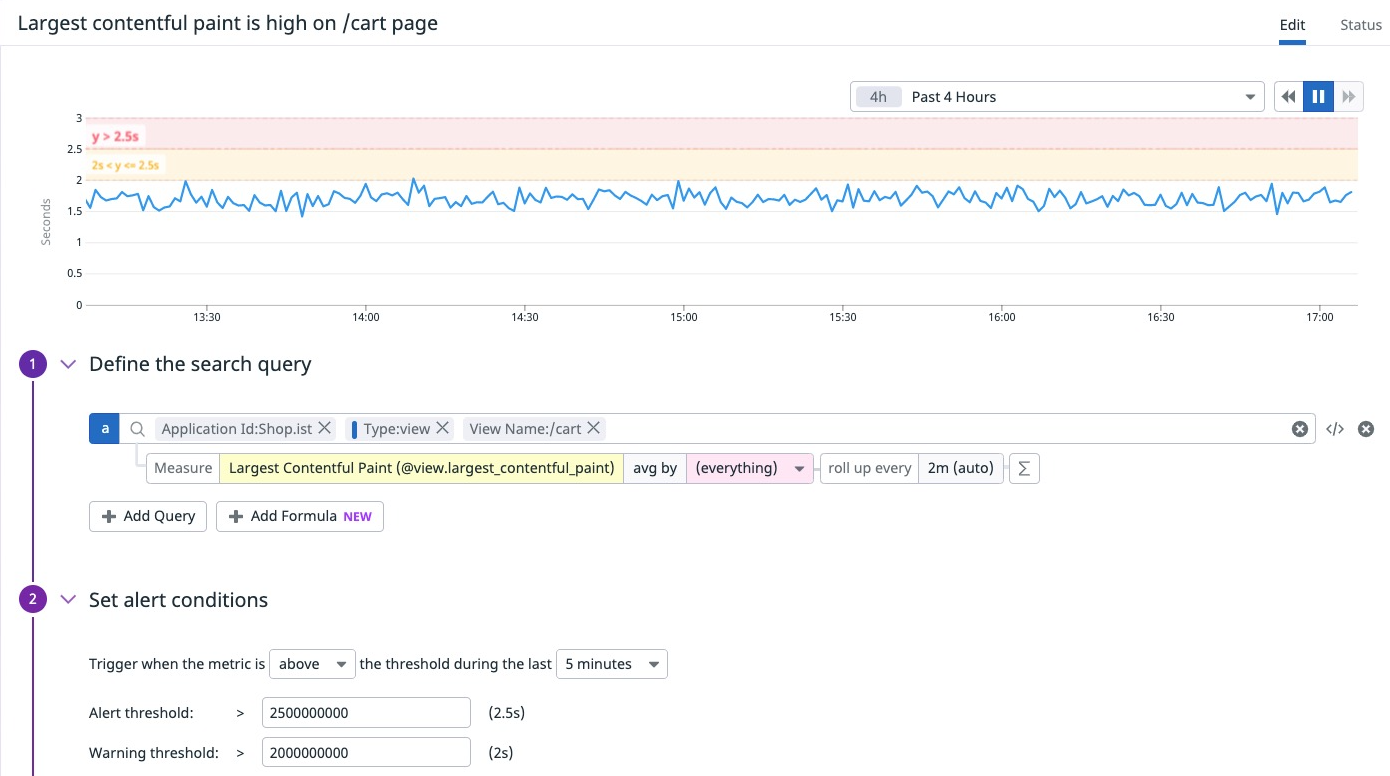
Real User Monitoring measures, calculates, and scores application performance as Core Web Vitals and Mobile Vitals. For example, Largest Contentful Paint (LCP) measures loading performance and is benchmarked at 2.5 seconds when the page starts loading.
This example shows a RUM monitor for the LCP of the /cart page on a sample Shop.ist application.
This example monitor warns when the LCP takes 2 seconds to load and alerts when the LCP takes longer than 2.5 seconds to load.
Further Reading
Additional helpful documentation, links, and articles:
