- Essentials
- Getting Started
- Glossary
- Standard Attributes
- Guides
- Agent
- Integrations
- Developers
- Authorization
- DogStatsD
- Custom Checks
- Integrations
- Create an Agent-based Integration
- Create an API Integration
- Create a Log Pipeline
- Integration Assets Reference
- Build a Marketplace Offering
- Create a Tile
- Create an Integration Dashboard
- Create a Monitor Template
- Create a Cloud SIEM Detection Rule
- OAuth for Integrations
- Install Agent Integration Developer Tool
- Service Checks
- IDE Plugins
- Community
- Guides
- OpenTelemetry
- Administrator's Guide
- API
- Datadog Mobile App
- CoScreen
- CoTerm
- Cloudcraft (Standalone)
- In The App
- Dashboards
- Notebooks
- DDSQL Editor
- Reference Tables
- Sheets
- Monitors and Alerting
- Metrics
- Watchdog
- Bits AI
- Software Catalog
- Error Tracking
- Change Tracking
- Service Management
- Actions & Remediations
- Infrastructure
- Cloudcraft
- Resource Catalog
- Universal Service Monitoring
- Hosts
- Containers
- Processes
- Serverless
- Network Monitoring
- Cloud Cost
- Application Performance
- APM
- Continuous Profiler
- Database Monitoring
- Agent Integration Overhead
- Setup Architectures
- Setting Up Postgres
- Setting Up MySQL
- Setting Up SQL Server
- Setting Up Oracle
- Setting Up Amazon DocumentDB
- Setting Up MongoDB
- Connecting DBM and Traces
- Data Collected
- Exploring Database Hosts
- Exploring Query Metrics
- Exploring Query Samples
- Exploring Recommendations
- Troubleshooting
- Guides
- Data Streams Monitoring
- Data Jobs Monitoring
- Digital Experience
- Real User Monitoring
- Product Analytics
- Synthetic Testing and Monitoring
- Continuous Testing
- Software Delivery
- CI Visibility
- CD Visibility
- Test Optimization
- Quality Gates
- DORA Metrics
- Security
- Security Overview
- Cloud SIEM
- Cloud Security Management
- Application Security Management
- Sensitive Data Scanner
- Code Security
- AI Observability
- Log Management
- Observability Pipelines
- Log Management
- Administration
- self_service_actions
Tracer Debug Logs
Automated debug log collection
Automated debug logs are supported for Node.js and .NET only. For other languages, use manual debug log collection instead.
A flare allows you to send necessary troubleshooting information to the Datadog support team, including tracer logs, with sensitive data removed. Flares are useful for troubleshooting issues like high CPU usage, high memory usage, and missing spans.
Prerequisites
- Remote Configuration must be enabled.
- Your API key must be configured for Remote Configuration.
- You must have a supported tracer version:
- Java:
1.26.0or greater - Python:
2.11.0or greater - Node.js:
5.15.0or greater, or4.39.0or greater - .NET:
2.46.0or greater
- Java:
Send a flare
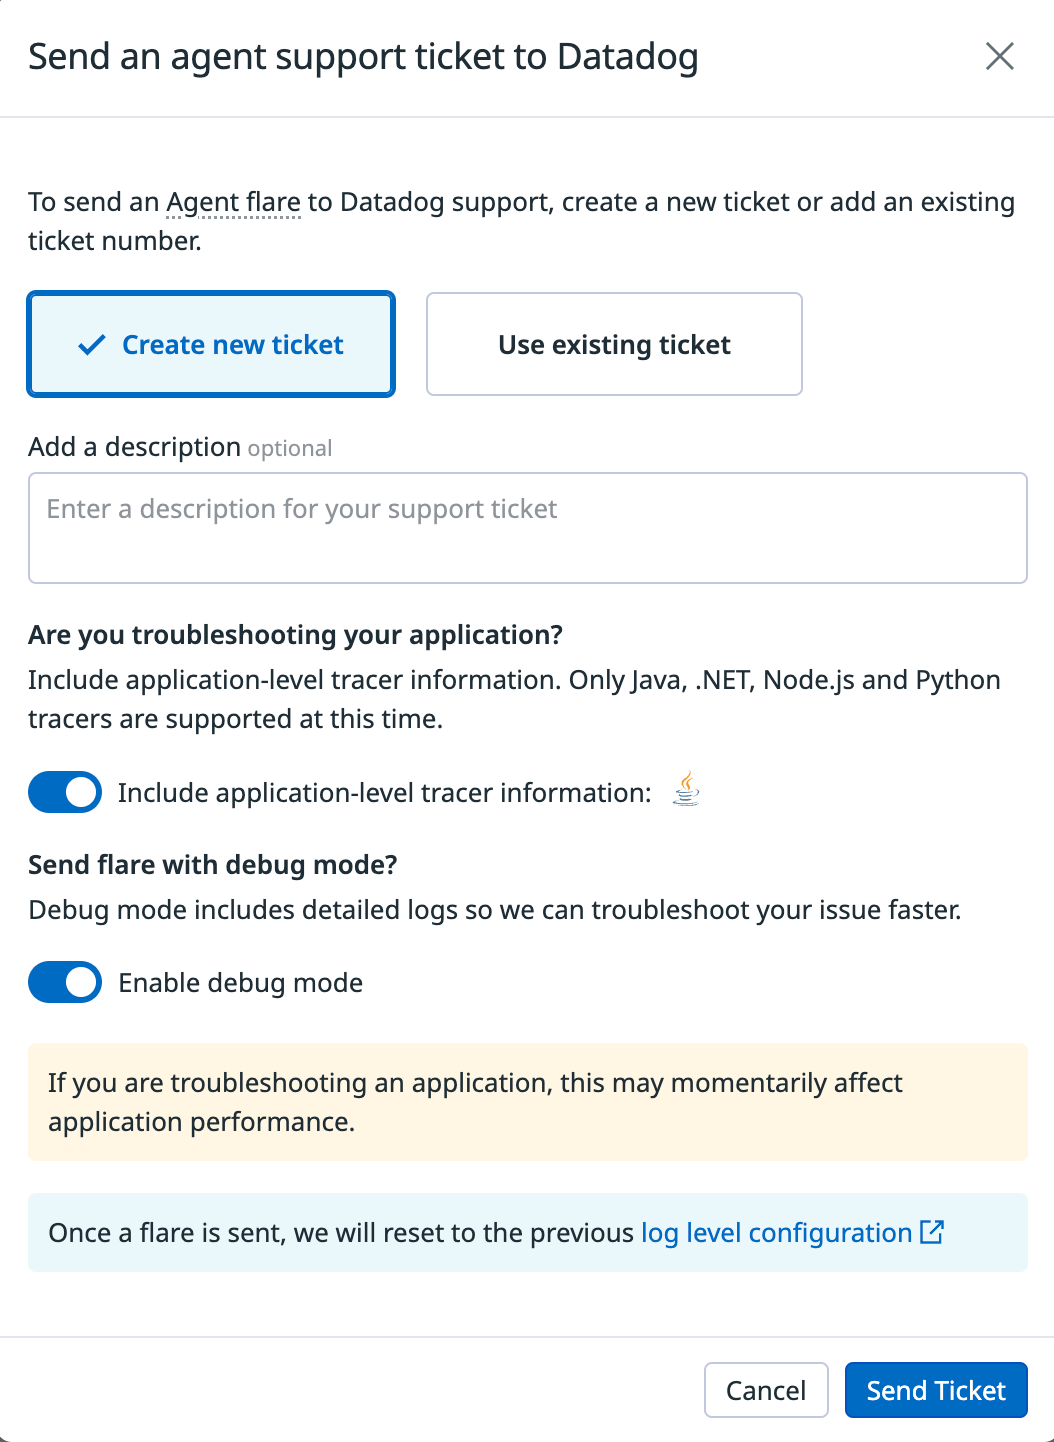
To send a flare from the Datadog site, make sure you’ve enabled Fleet Automation and Remote Configuration on the Agent. To send a remote flare:
- From the Fleet Automation page, select an Agent that requires support.
- Click Support.
- Click Send Support Ticket.
- Provide an existing Zendesk support ticket number. If you don’t provide a ticket number, one is created on your behalf.
- Enable Debug mode to allow Datadog support staff to troubleshoot your issue faster. The log level is reset to its previous configuration after you send the flare.
- If you are troubleshooting your application, enable application tracer level logs to be included in the flare.
- Click Send Ticket.
For example:
Enable debug mode
Use Datadog debug settings to diagnose issues or audit trace data. Datadog does not recommend that you enable debug mode in production systems because it increases the number of events that are sent to your loggers. Use debug mode for debugging purposes only.
Debug mode is disabled by default. To enable it, follow the corresponding language tracer instructions:
To enable debug mode for the Datadog Ruby Tracer, set the environment variable DD_TRACE_DEBUG=true.
Application Logs
By default, all logs are processed by the default Ruby logger. When using Rails, you should see the messages in your application log file.
Datadog client log messages are marked with [ddtrace], so you can isolate them from other messages.
You can override the default logger and replace it with a custom one by using the tracer’s log attribute:
f = File.new("<FILENAME>.log", "w+")           # Log messages should go there
Datadog.configure do |c|
  c.logger.instance = Logger.new(f)                 # Overriding the default tracer
end

Datadog::Tracing.logger.info { "this is typically called by tracing code" }
See the API documentation for more details.
Review debug logs
When debug mode for your tracer is enabled, tracer-specific log messages report how the tracer was initialized and whether traces were sent to the Agent. Debug logs are stored in a separate path depending on your logging configuration. If you enable application-level tracer information, debug logs are also sent in the flare for supported languages. The following log examples show what might appear in your log file.
If there are errors that you don’t understand, or if traces are reported as flushed to Datadog but you cannot see them in the Datadog UI, contact Datadog support and provide the relevant log entries with a flare.
Span is generated:
D, [<YYYY-MM-DD>T16:42:51.147563 #476] DEBUG -- ddtrace: [ddtrace] (/usr/local/bundle/gems/ddtrace-<version>/lib/ddtrace/tracer.rb:371:in `write') Writing 4 spans (enabled: true)

 Name: rack.request
Span ID: <span id>
Parent ID: 0
Trace ID: <trace id>
Type: web
Service: todo
Resource: NotesController#index
Error: 0
Start: <start time>
End: <end time>
Duration: 11985000
Allocations: 1202
Tags: [
   system.pid => 476,
   env => dev,
   language => ruby,
   http.method => GET,
   http.url => /notes,
   http.base_url => http://0.0.0.0:3000,
   http.status_code => 304,
   http.response.headers.x_request_id => <header value>]
Metrics: [
   ..],
Further Reading
Additional helpful documentation, links, and articles:

