Versión de la integración4.0.0
This page is not yet available in Spanish. We are working on its translation.
If you have any questions or feedback about our current translation project,
feel free to reach out to us!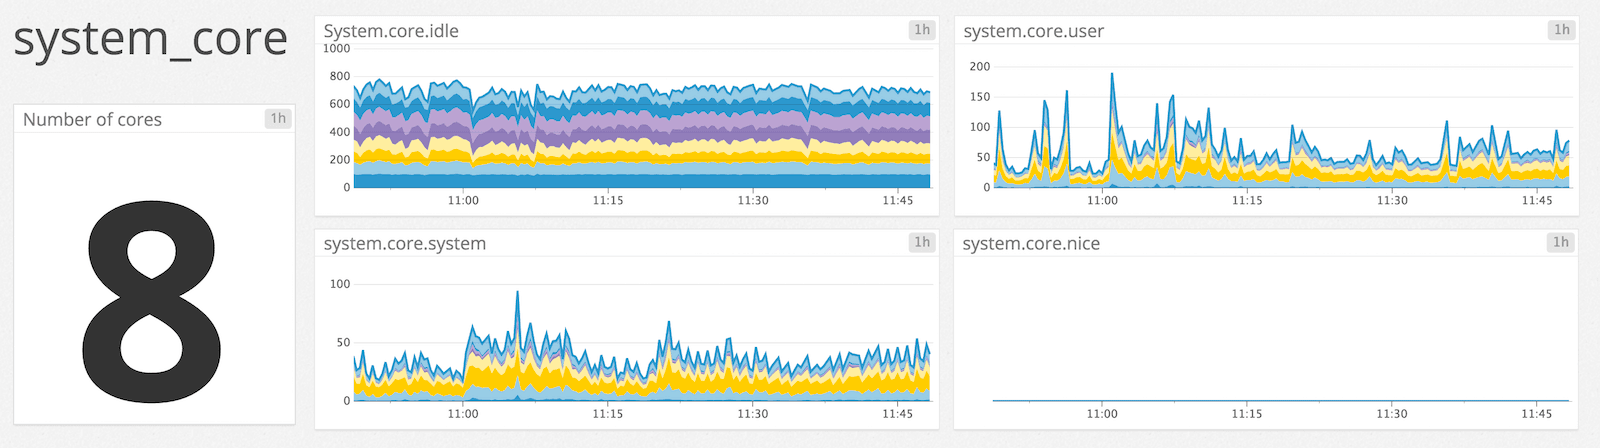
Overview
This check collects the number of CPU cores on a host and CPU times, such as system, user, idle, etc.
Setup
Installation
The System Core check is included in the Datadog Agent package. No additional installation is needed on your server.
Configuration
Edit the system_core.d/conf.yaml file in the conf.d/ folder at the root of your Agent’s configuration directory. See the sample system_core.d/conf.yaml for all available configuration options. Note: At least one entry is required under instances to enable the check, for example:
init_config:

instances:
  - foo: bar
Restart the Agent.
Validation
Run the Agent’s status subcommand and look for system_core under the Checks section.
Data Collected
Metrics
| |
|---|
system.core.count
(gauge) | The number of CPU cores on the host
Shown as core |
system.core.user
(gauge) | The percentage of time a given CPU core has spent in user mode
Shown as percent |
system.core.user.total
(gauge) | The percentage of time the whole CPU has spent in user mode
Shown as percent |
system.core.system
(gauge) | The percentage of time a given CPU core has spent in kernel mode
Shown as percent |
system.core.system.total
(gauge) | The percentage of time the whole CPU has spent in kernel mode
Shown as percent |
system.core.idle
(gauge) | The percentage of time a given CPU core has spent idle
Shown as percent |
system.core.idle.total
(gauge) | The percentage of time the whole CPU has spent idle
Shown as percent |
system.core.nice
(gauge) | [Unix] The percentage of time a given CPU core has spent in niced (prioritized) processes in user mode
Shown as percent |
system.core.nice.total
(gauge) | [Unix] The percentage of time the whole CPU has spent in niced (prioritized) processes in user mode
Shown as percent |
system.core.guest
(gauge) | [Linux] The percentage of time a given CPU core has spent running a virtual CPU for guest operating systems under the control of the Linux kernel
Shown as percent |
system.core.guest.total
(gauge) | [Linux] The percentage of time the whole CPU has spent running a virtual CPU for guest operating systems under the control of the Linux kernel
Shown as percent |
system.core.iowait
(gauge) | [Linux] The percentage of time a given CPU core has spent waiting for I/O to complete
Shown as percent |
system.core.iowait.total
(gauge) | [Linux] The percentage of time the whole CPU has spent waiting for I/O to complete
Shown as percent |
system.core.irq
(gauge) | [Linux, BSD] The percentage of time a given CPU core has spent servicing hardware interrupts
Shown as percent |
system.core.irq.total
(gauge) | [Linux, BSD] The percentage of time the whole CPU has spent servicing hardware interrupts
Shown as percent |
system.core.softirq
(gauge) | [Linux, BSD] The percentage of time a given CPU core has spent servicing software interrupts
Shown as percent |
system.core.softirq.total
(gauge) | [Linux, BSD] The percentage of time the whole CPU has spent servicing software interrupts
Shown as percent |
system.core.guest_nice
(gauge) | [Linux] The percentage of time a given CPU core has spent running a niced guest
Shown as percent |
system.core.guest_nice.total
(gauge) | [Linux] The percentage of time the whole CPU has spent running running a niced guest
Shown as percent |
system.core.steal
(gauge) | [Linux] The percentage of time a given CPU core has spent running a virtual CPU for guest operating systems under the control of the Linux kernel
Shown as percent |
system.core.steal.total
(gauge) | [Linux] The percentage of time a given CPU core has spent running a virtual CPU for guest operating systems under the control of the Linux kernel
Shown as percent |
system.core.interrupt
(gauge) | [Windows] The percentage of time a given CPU core has spent servicing hardware interrupts
Shown as percent |
system.core.interrupt.total
(gauge) | [Windows] The percentage of time the whole CPU has spent servicing hardware interrupts
Shown as percent |
system.core.dpc
(gauge) | [Windows] The percentage of time a given CPU core has spent servicing deferred procedure calls (DPCs)
Shown as percent |
system.core.dpc.total
(gauge) | [Windows] The percentage of time the whole CPU has spent servicing deferred procedure calls (DPCs)
Shown as percent |
system.core.frequency
(gauge) | The frequency or clock speed a given CPU
Shown as megahertz |
Depending on the platform, the check may collect other CPU time metrics, such as system.core.interrupt on Windows, system.core.iowait on Linux, etc.
Events
The System Core check does not include any events.
Service Checks
datadog.agent.up
Returns OK if the Agent is running properly. Alerts are created if the host does not respond.
Statuses: ok, critical
Troubleshooting
Need help? Contact Datadog support.
Windows and high numbers of processors
Due to the way Windows splits processors into groups, metrics
for individual cores collected from this integration may have invalid
values for Windows hosts with high (> 64) numbers of cores for a
portion of the cores.
Note that *.total metrics should still reflect accurate values in
the above situation, and only per-core metrics are affected.
Datadog recommends that users with this type of configuration set up the
Windows Performance Counters integration to track counters
inside the Processor Information. This enables users to get accurate per-core
metrics.