- Principales informations
- Getting Started
- Datadog
- Site Datadog
- DevSecOps
- Serverless for AWS Lambda
- Agent
- Intégrations
- Conteneurs
- Dashboards
- Monitors
- Logs
- Tracing
- Profileur
- Tags
- API
- Service Catalog
- Session Replay
- Continuous Testing
- Surveillance Synthetic
- Incident Management
- Database Monitoring
- Cloud Security Management
- Cloud SIEM
- Application Security Management
- Workflow Automation
- CI Visibility
- Test Visibility
- Intelligent Test Runner
- Code Analysis
- Learning Center
- Support
- Glossary
- Standard Attributes
- Guides
- Agent
- Intégrations
- OpenTelemetry
- Développeurs
- Authorization
- DogStatsD
- Checks custom
- Intégrations
- Create an Agent-based Integration
- Create an API Integration
- Create a Log Pipeline
- Integration Assets Reference
- Build a Marketplace Offering
- Create a Tile
- Create an Integration Dashboard
- Create a Recommended Monitor
- Create a Cloud SIEM Detection Rule
- OAuth for Integrations
- Install Agent Integration Developer Tool
- Checks de service
- IDE Plugins
- Communauté
- Guides
- API
- Application mobile
- CoScreen
- Cloudcraft
- In The App
- Dashboards
- Notebooks
- DDSQL Editor
- Alertes
- Infrastructure
- Métriques
- Watchdog
- Bits AI
- Service Catalog
- API Catalog
- Error Tracking
- Service Management
- Infrastructure
- Universal Service Monitoring
- Conteneurs
- Sans serveur
- Surveillance réseau
- Cloud Cost
- Application Performance
- APM
- Profileur en continu
- Database Monitoring
- Agent Integration Overhead
- Setup Architectures
- Configuration de Postgres
- Configuration de MySQL
- Configuration de SQL Server
- Setting Up Oracle
- Setting Up MongoDB
- Connecting DBM and Traces
- Données collectées
- Exploring Database Hosts
- Explorer les métriques de requête
- Explorer des échantillons de requêtes
- Dépannage
- Guides
- Data Streams Monitoring
- Data Jobs Monitoring
- Digital Experience
- RUM et Session Replay
- Product Analytics
- Surveillance Synthetic
- Continuous Testing
- Software Delivery
- CI Visibility
- CD Visibility
- Test Visibility
- Exécuteur de tests intelligent
- Code Analysis
- Quality Gates
- DORA Metrics
- Securité
- Security Overview
- Cloud SIEM
- Cloud Security Management
- Application Security Management
- AI Observability
- Log Management
- Pipelines d'observabilité
- Log Management
- Administration
Getting Started with Session Replay
Cette page n'est pas encore disponible en français, sa traduction est en cours.
Si vous avez des questions ou des retours sur notre projet de traduction actuel, n'hésitez pas à nous contacter.
Si vous avez des questions ou des retours sur notre projet de traduction actuel, n'hésitez pas à nous contacter.
Overview
Session Replay is a visual tool that recreates user sessions from your applications, giving you a detailed, video-like view of how customers actually interact with your product. Session replay enriches traditional, quantitative data—such as click counts, bounce rates, and page view metrics—with the qualitative context you need to analyze your users’ actions.
This page walks you through getting started with Session Replay in Datadog. If you haven’t already, create a Datadog account.
Configure Session Replays
Session Replay is available for browser applications and mobile apps. The examples in this guide demonstrate using Session Replay with a browser app.
To start collecting data for Session Replay:
- Set up Datadog RUM Browser Monitoring by creating a RUM application (ensure you toggle Session Replay Enabled to access replay recordings).
- Generate a Client Token.
- Initialize the RUM Browser SDK by inserting the configuration code generated when you create the RUM application into your application source.
Until Datadog starts receiving data, your application appears as pending on the RUM Applications page.
For more detailed instructions on collecting Session Replay data, follow the RUM setup documentation for your application. For Session Replay setup on mobile apps, see Mobile Session Replay.
Find particular Session Replays
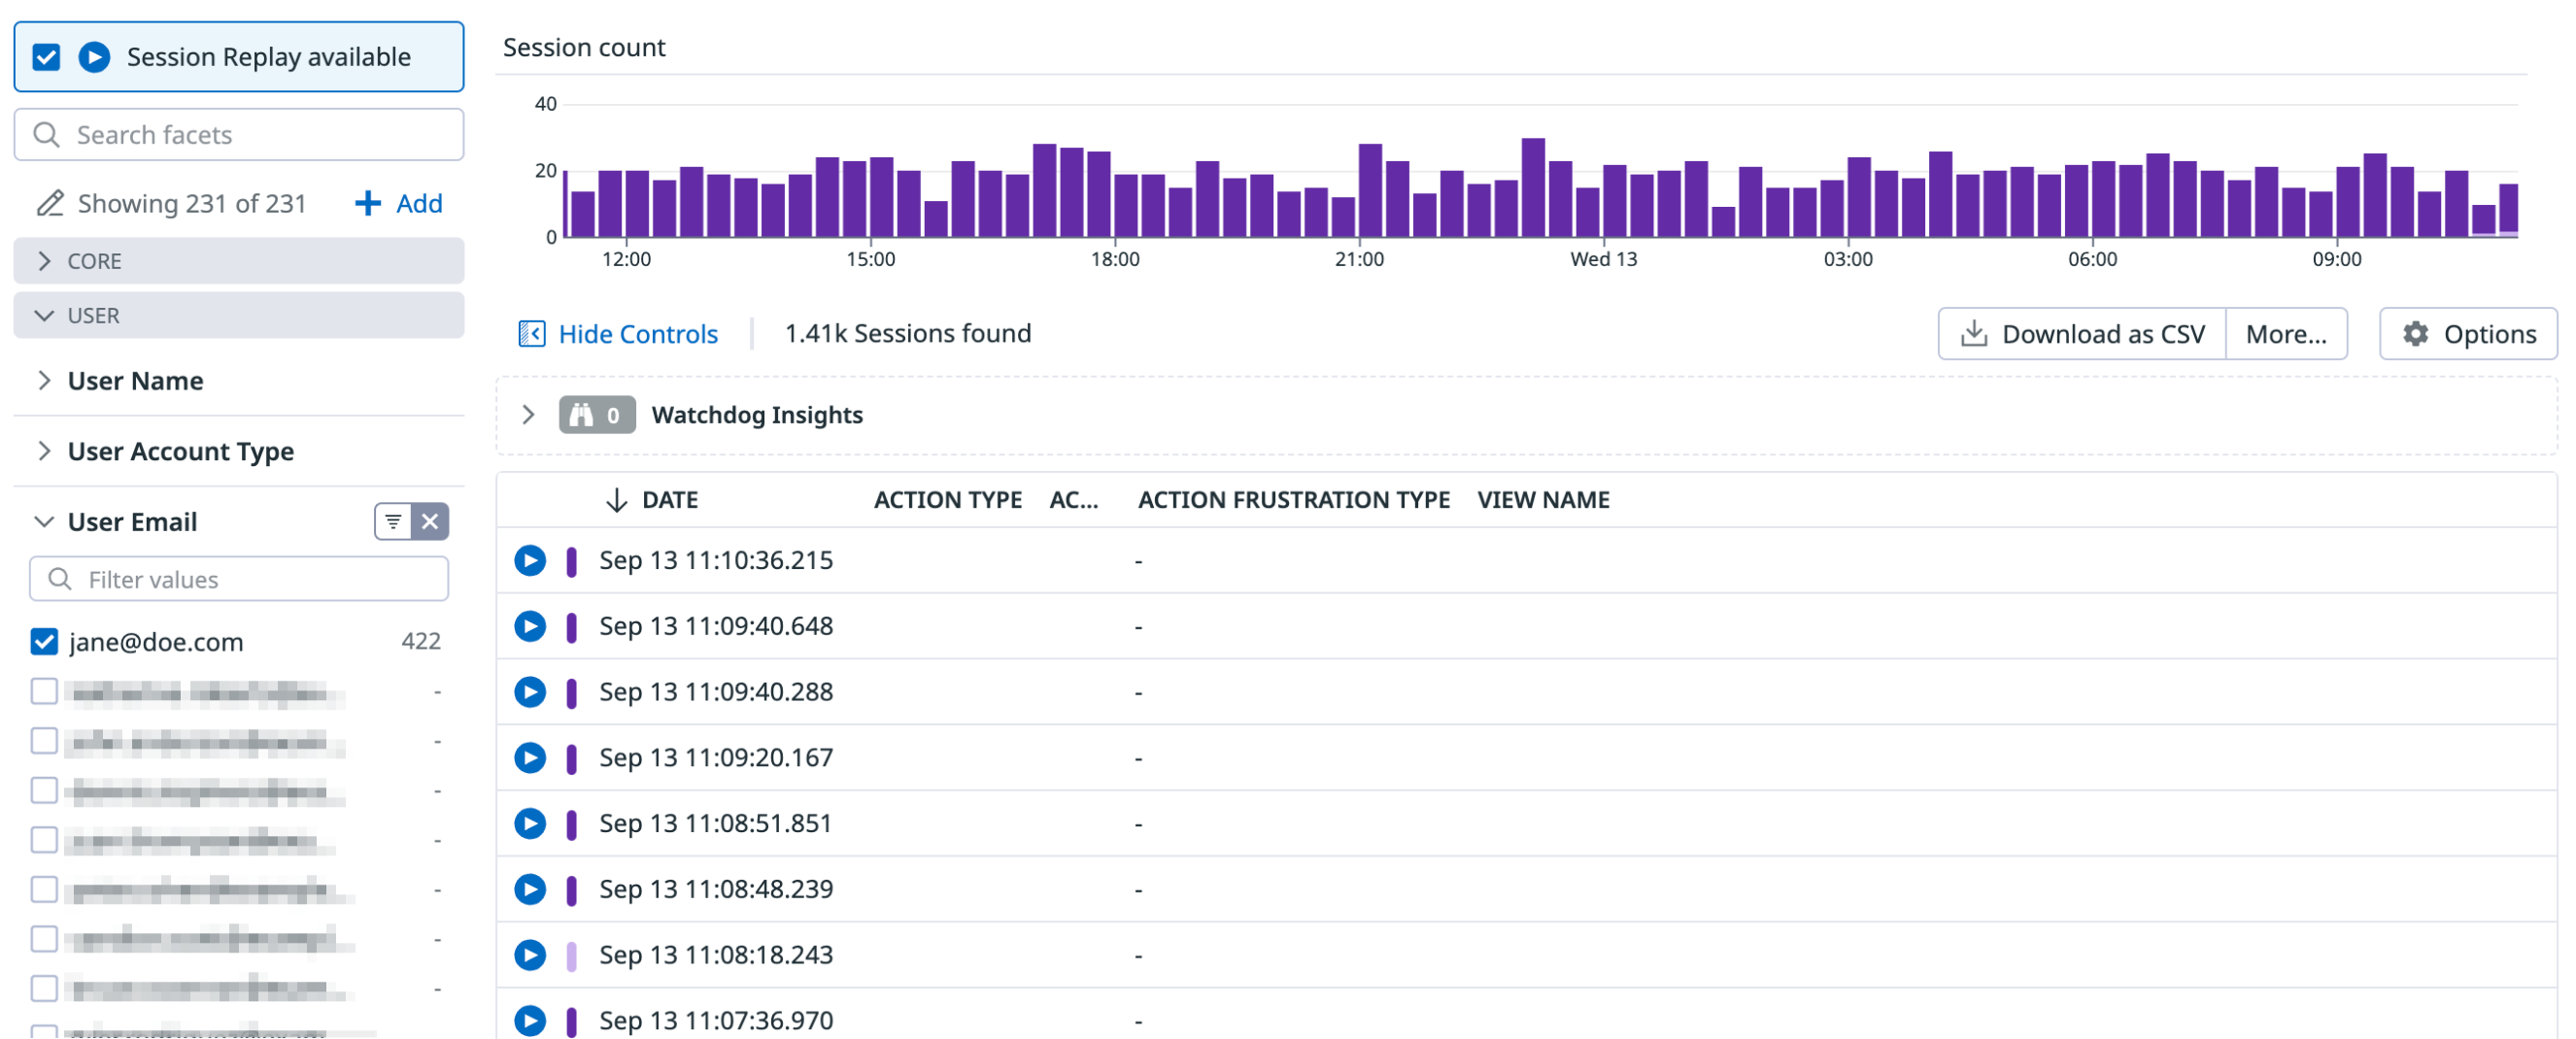
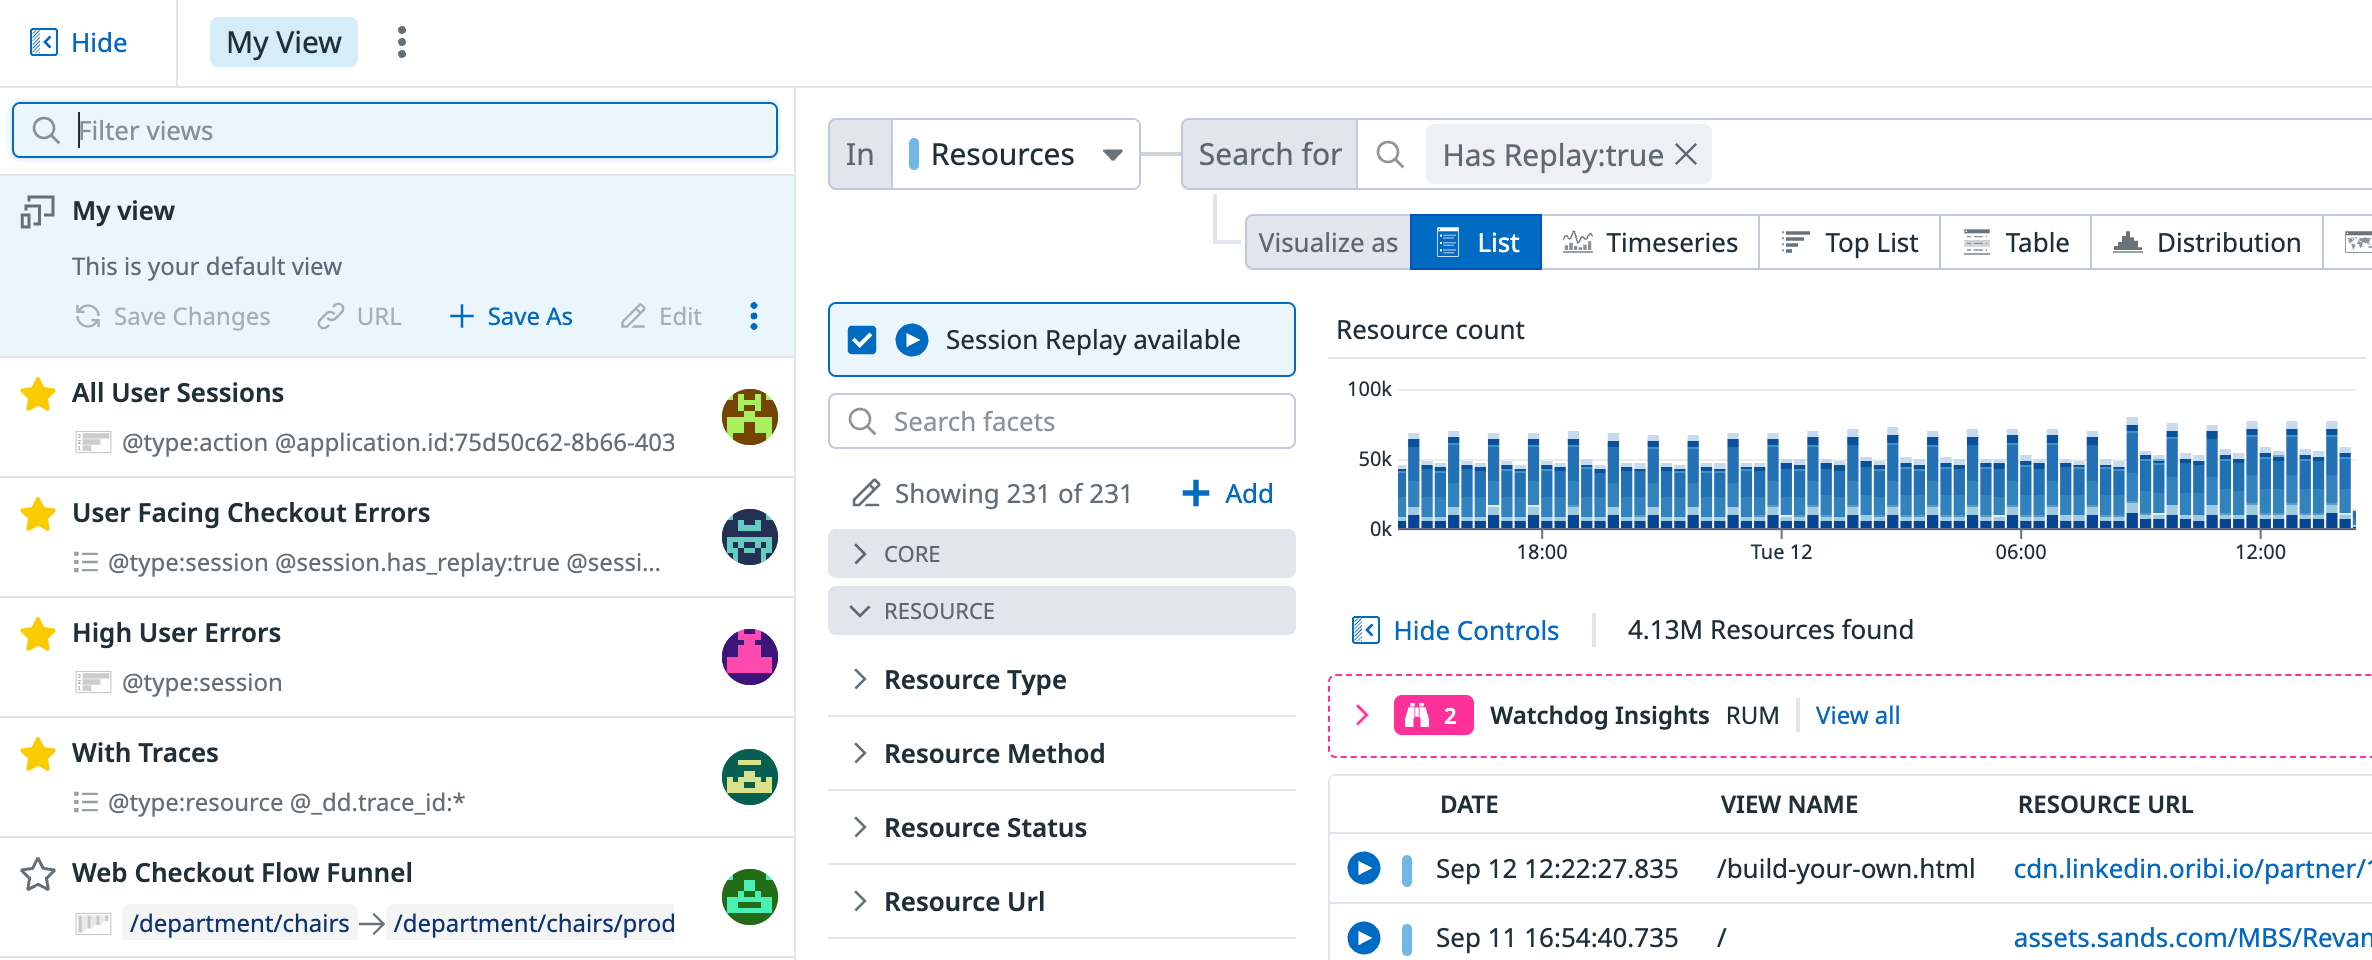
Once you’re collecting Session Replay data, navigate to the RUM Explorer and select Session Replay available to see all sessions with a replay attached to it. You can visualize this data as a List, Timeseries, or other format.
Suppose you’ve been told that a customer experienced issues with your application on a mobile device. You can filter Sessions using facets. In this case, filtering by facet is helpful in searching for specific information, such as a particular user or device type.
Maybe you’ve created a Saved View that shows you all sessions that contain a specific error that your application generates. Bringing up this view is helpful when you know where the issue lies and want to see session replays of users encountering it.
Examine a user journey
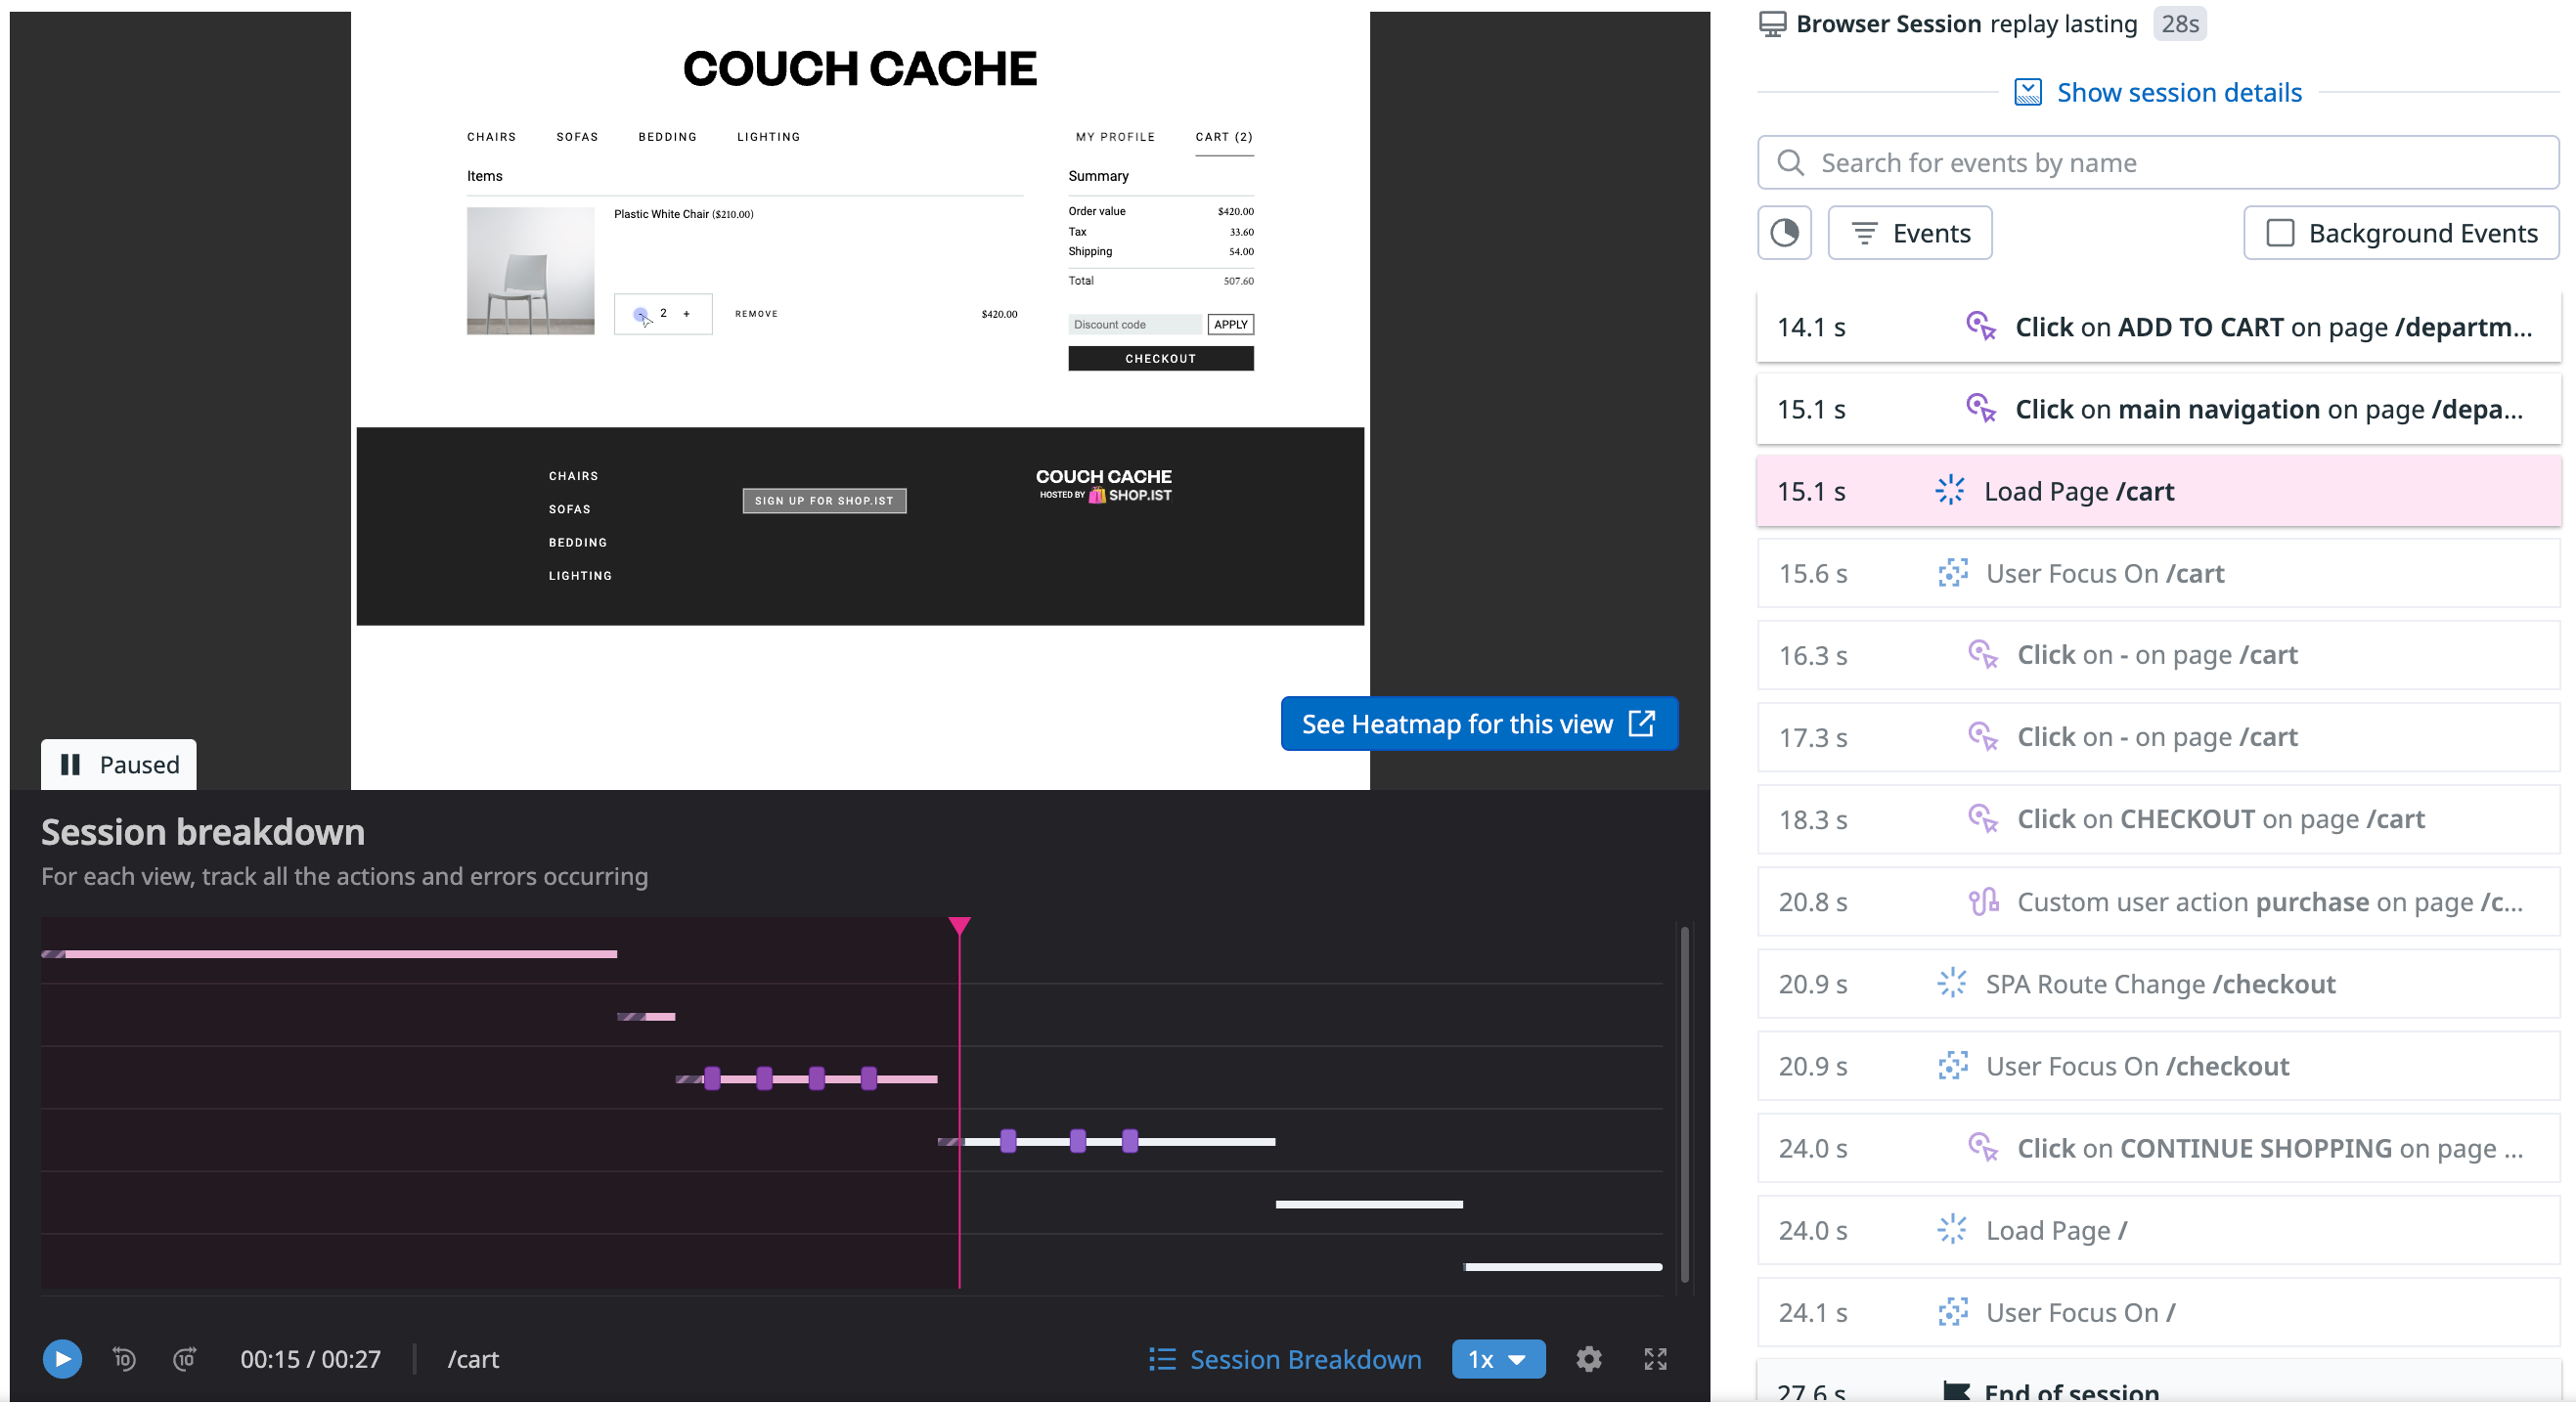
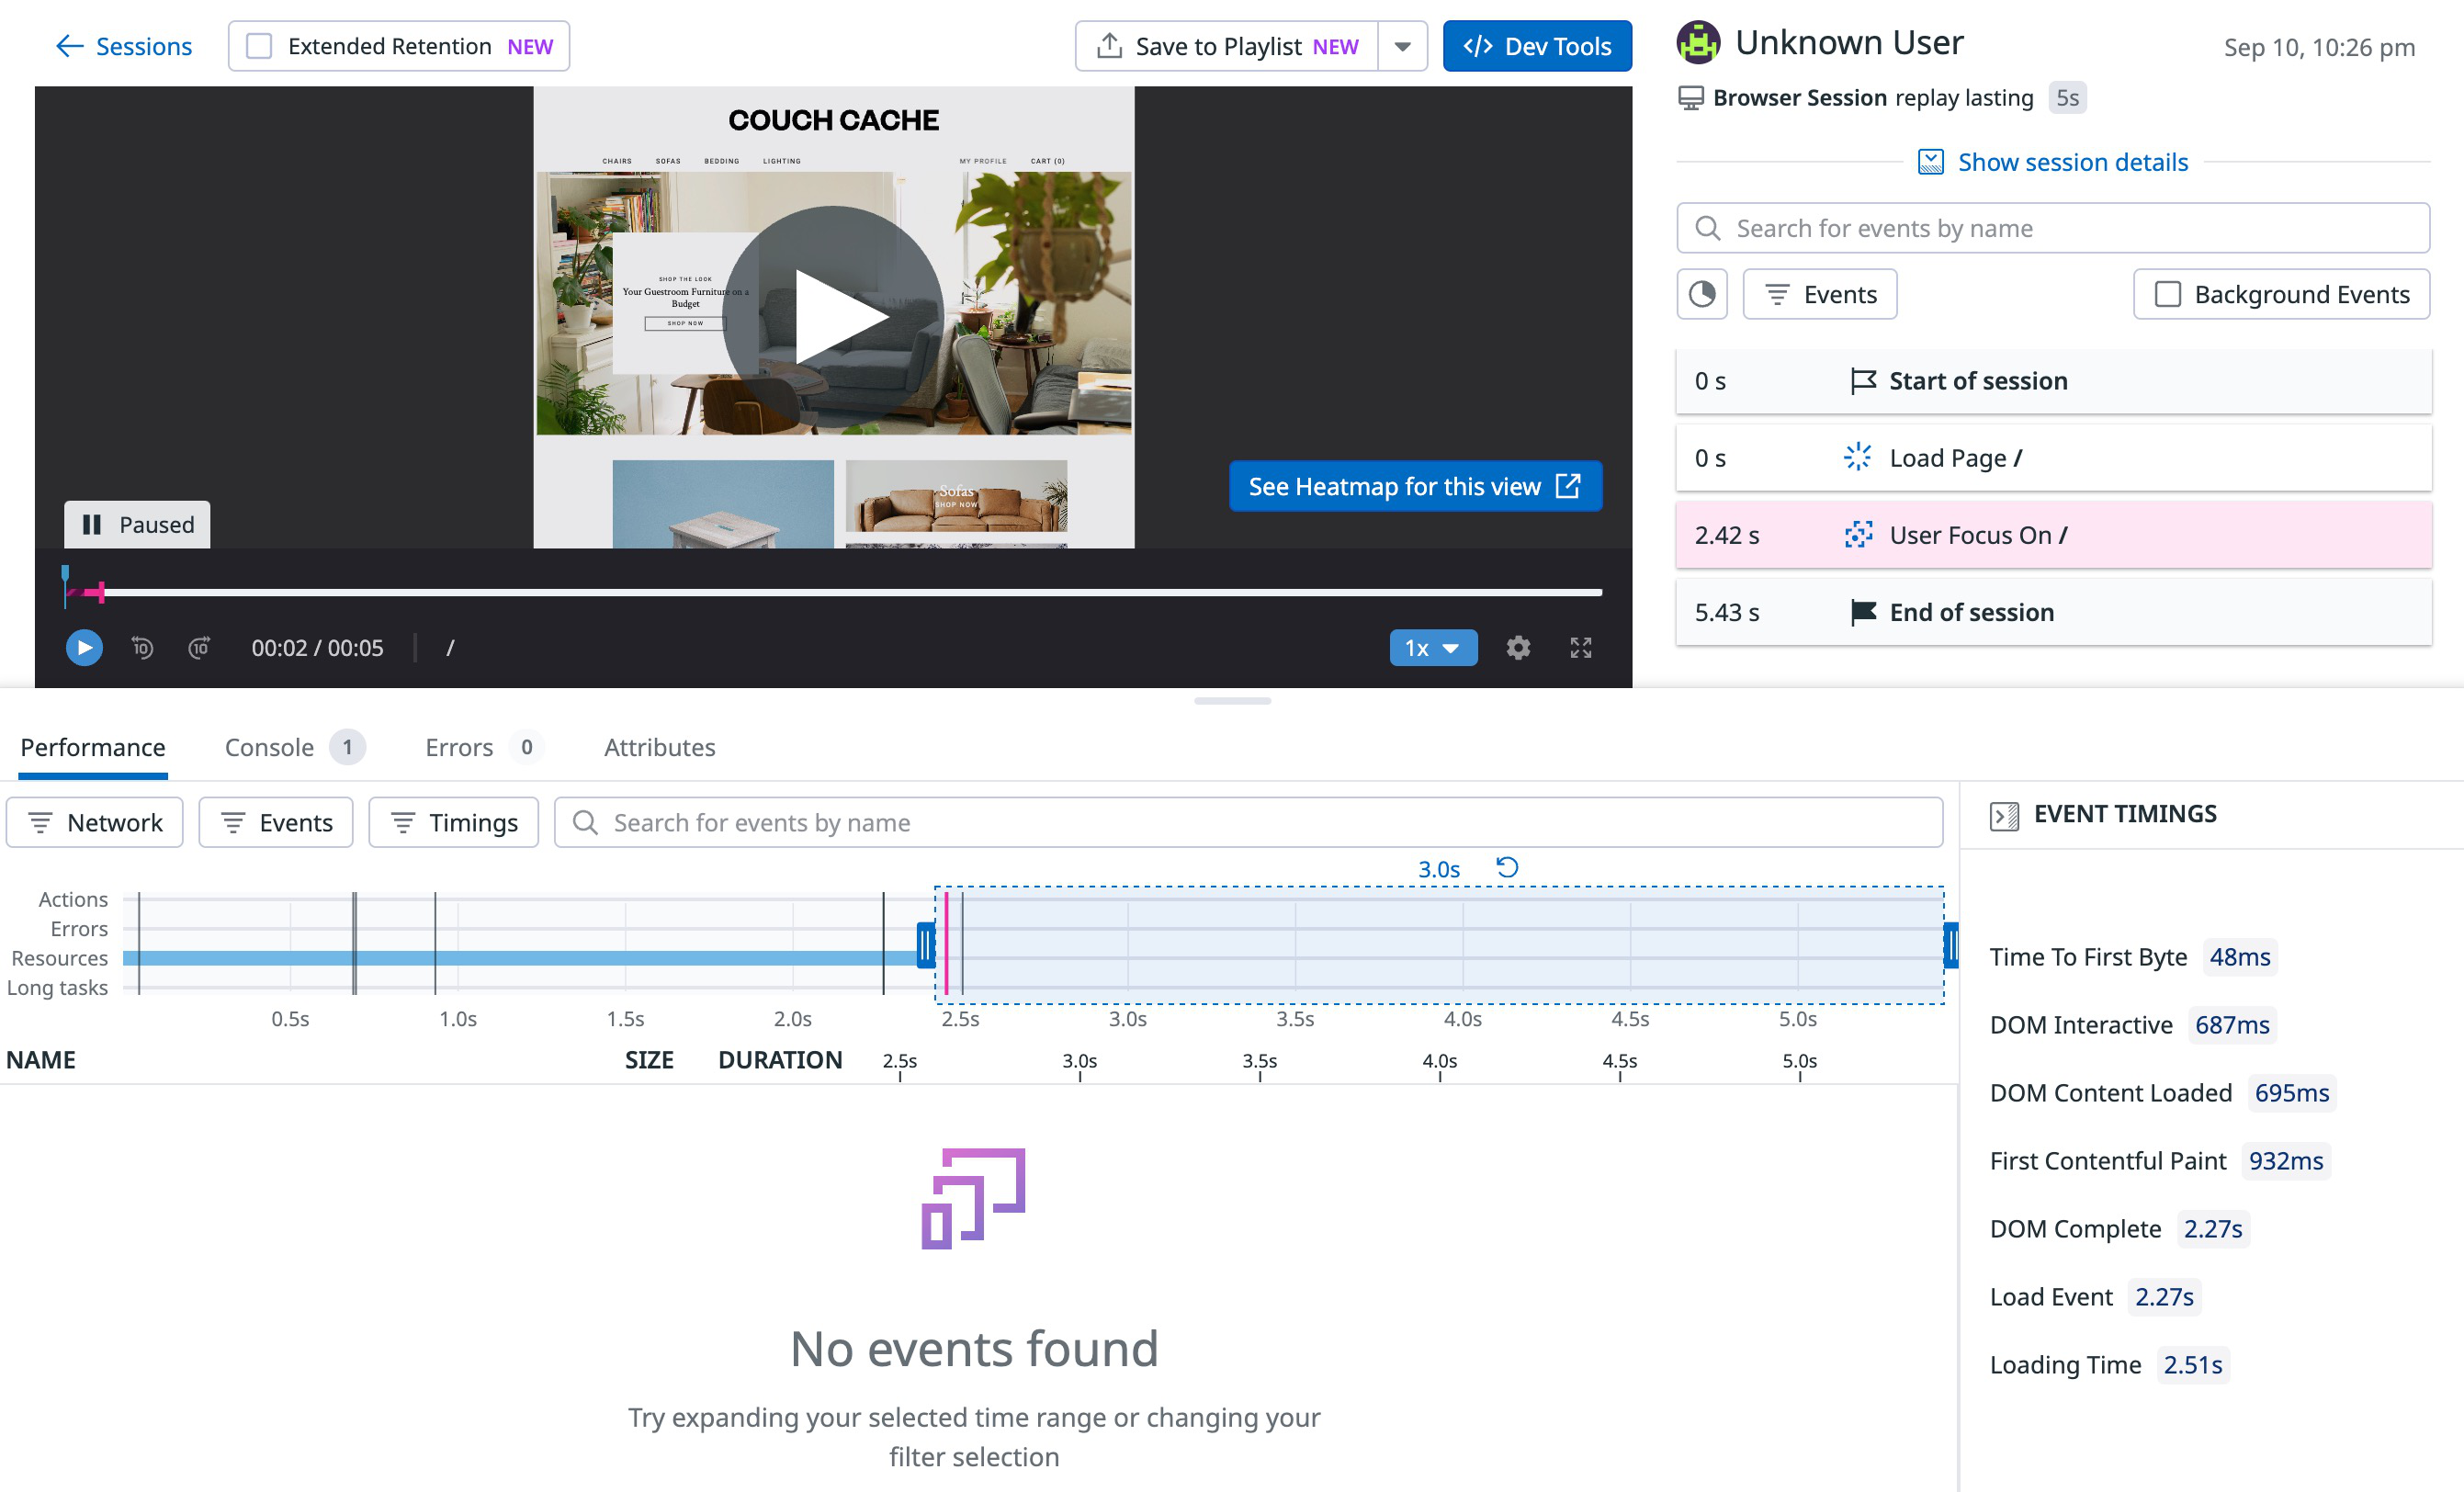
The session replay looks like a video on the left, with standard video navigation tools. Start the replay from the beginning by clicking play, and watch everything that a particular user did.
The User Journey is an event timeline on the right side of the page. You can navigate to any moment in the user journey by clicking on an event in the list. You can also track all the actions and errors occurring for each view by clicking Session Breakdown.
Select Events to filter the user journey list by the following event types:
- View
- Action
- Error
- Frustration Signal
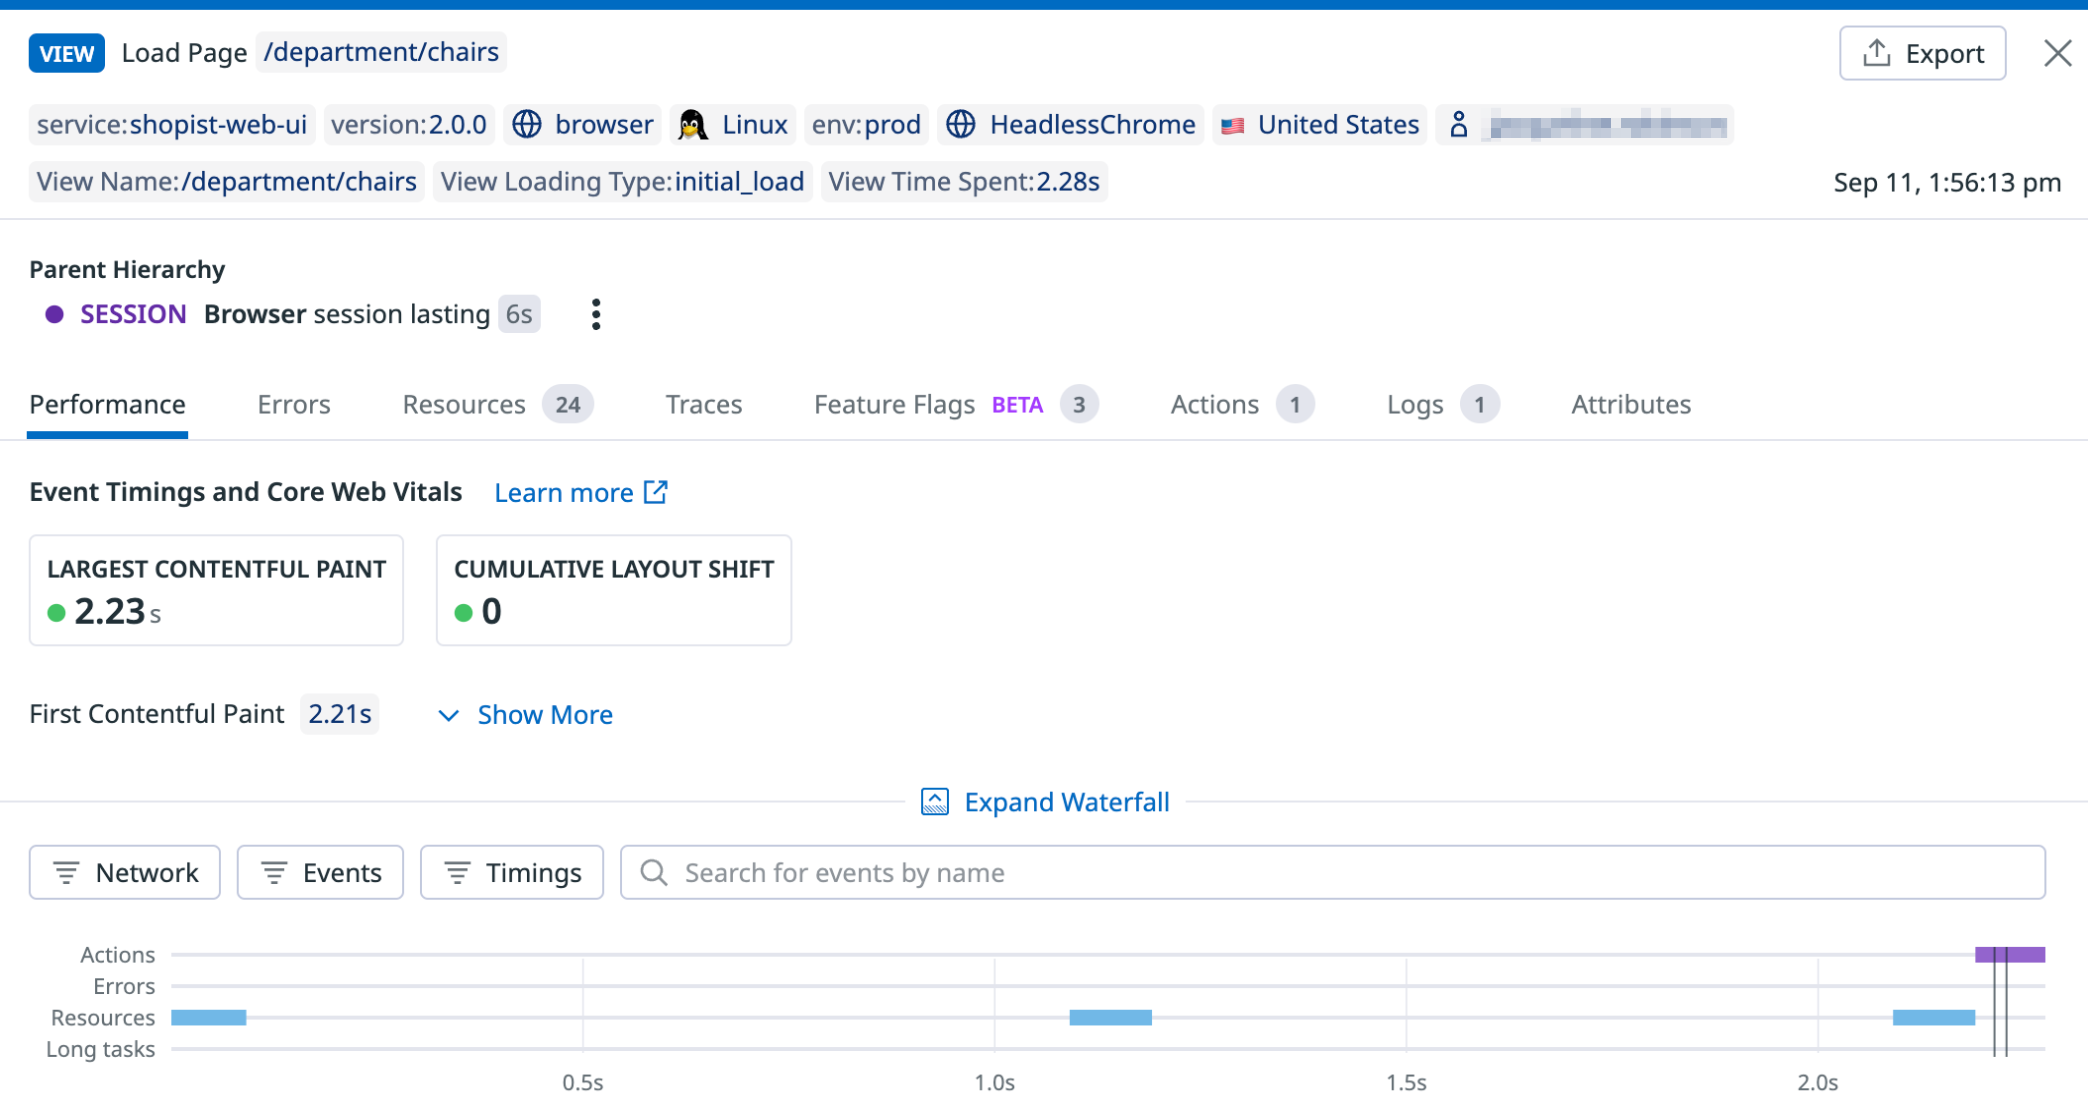
While hovering over a particular time or view in the user journey, select Details to examine Core Web Vitals and other pertinent information, without leaving the replay.
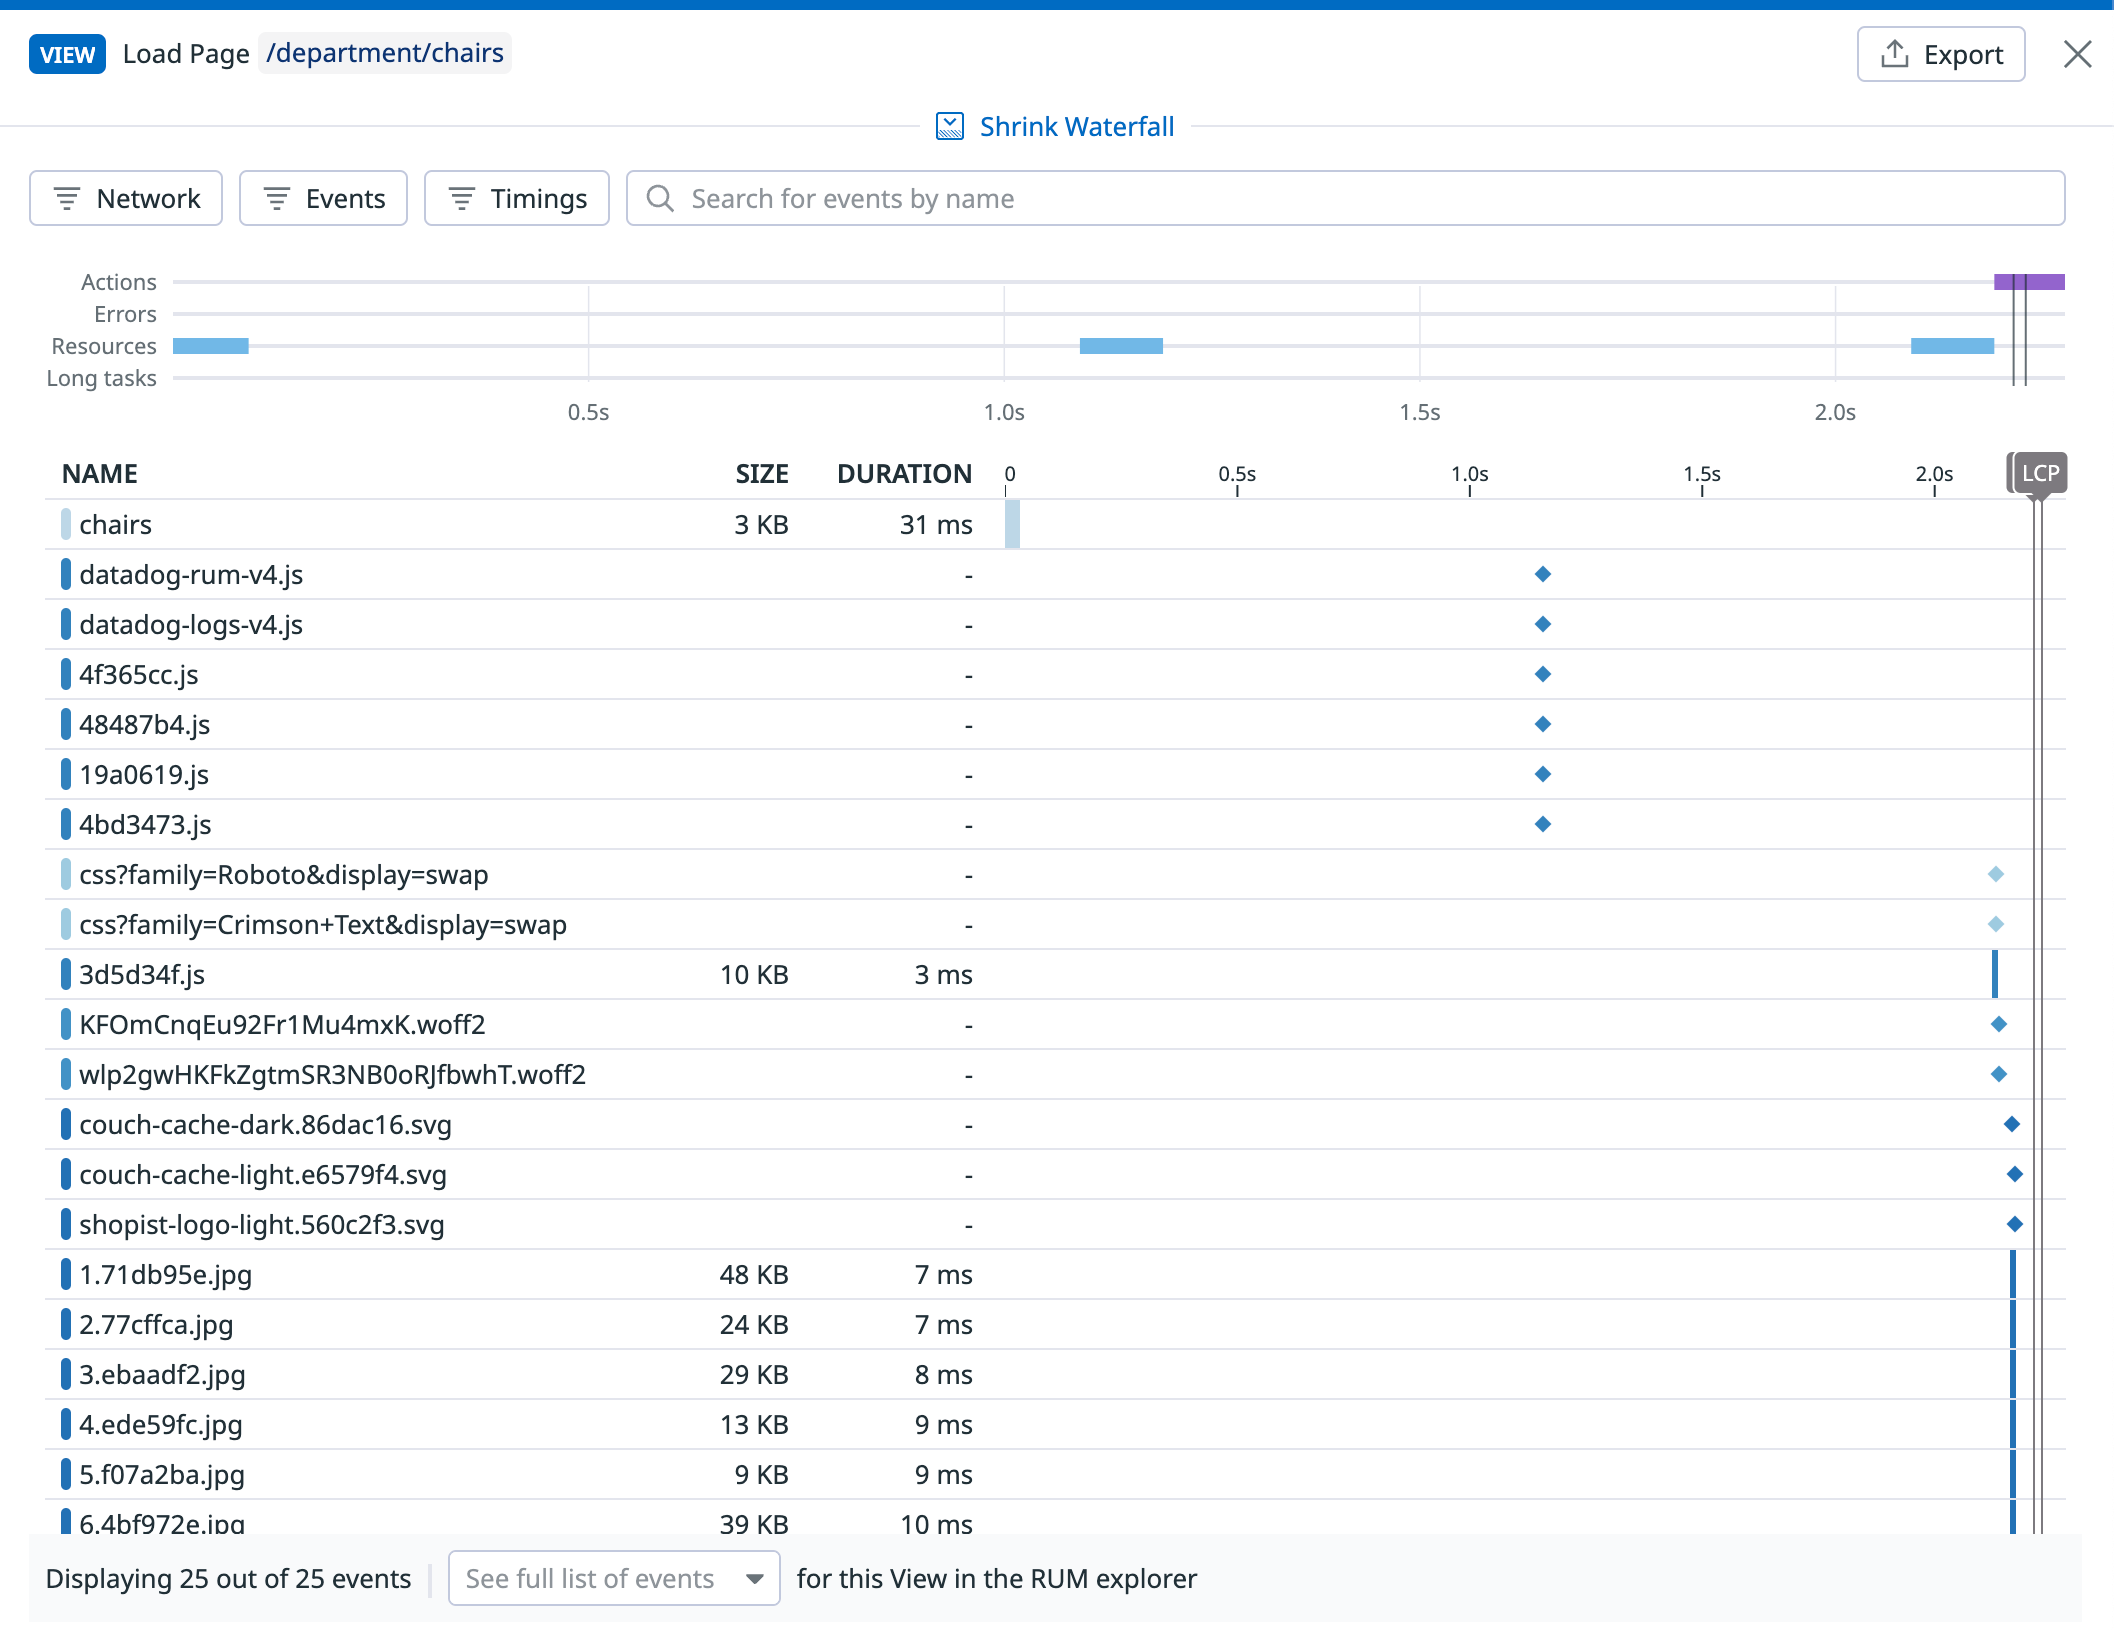
From the Details page, you can expand the waterfall view for more detailed information.
Troubleshoot using Developer Tools
Open Session Replay’s browser developer tools to explore your application’s performance, console logs, errors, and application or user attributes associated with the current replay.
Pivot to correlated data
Session Replay integrates with your application’s metrics, traces, and logs to give you helpful context for debugging issues. Using APM and Error Tracking alongside Session Replay enables you to investigate the root cause of user-facing issues, regardless of where they originate in your stack.
Investigating request performance with APM traces
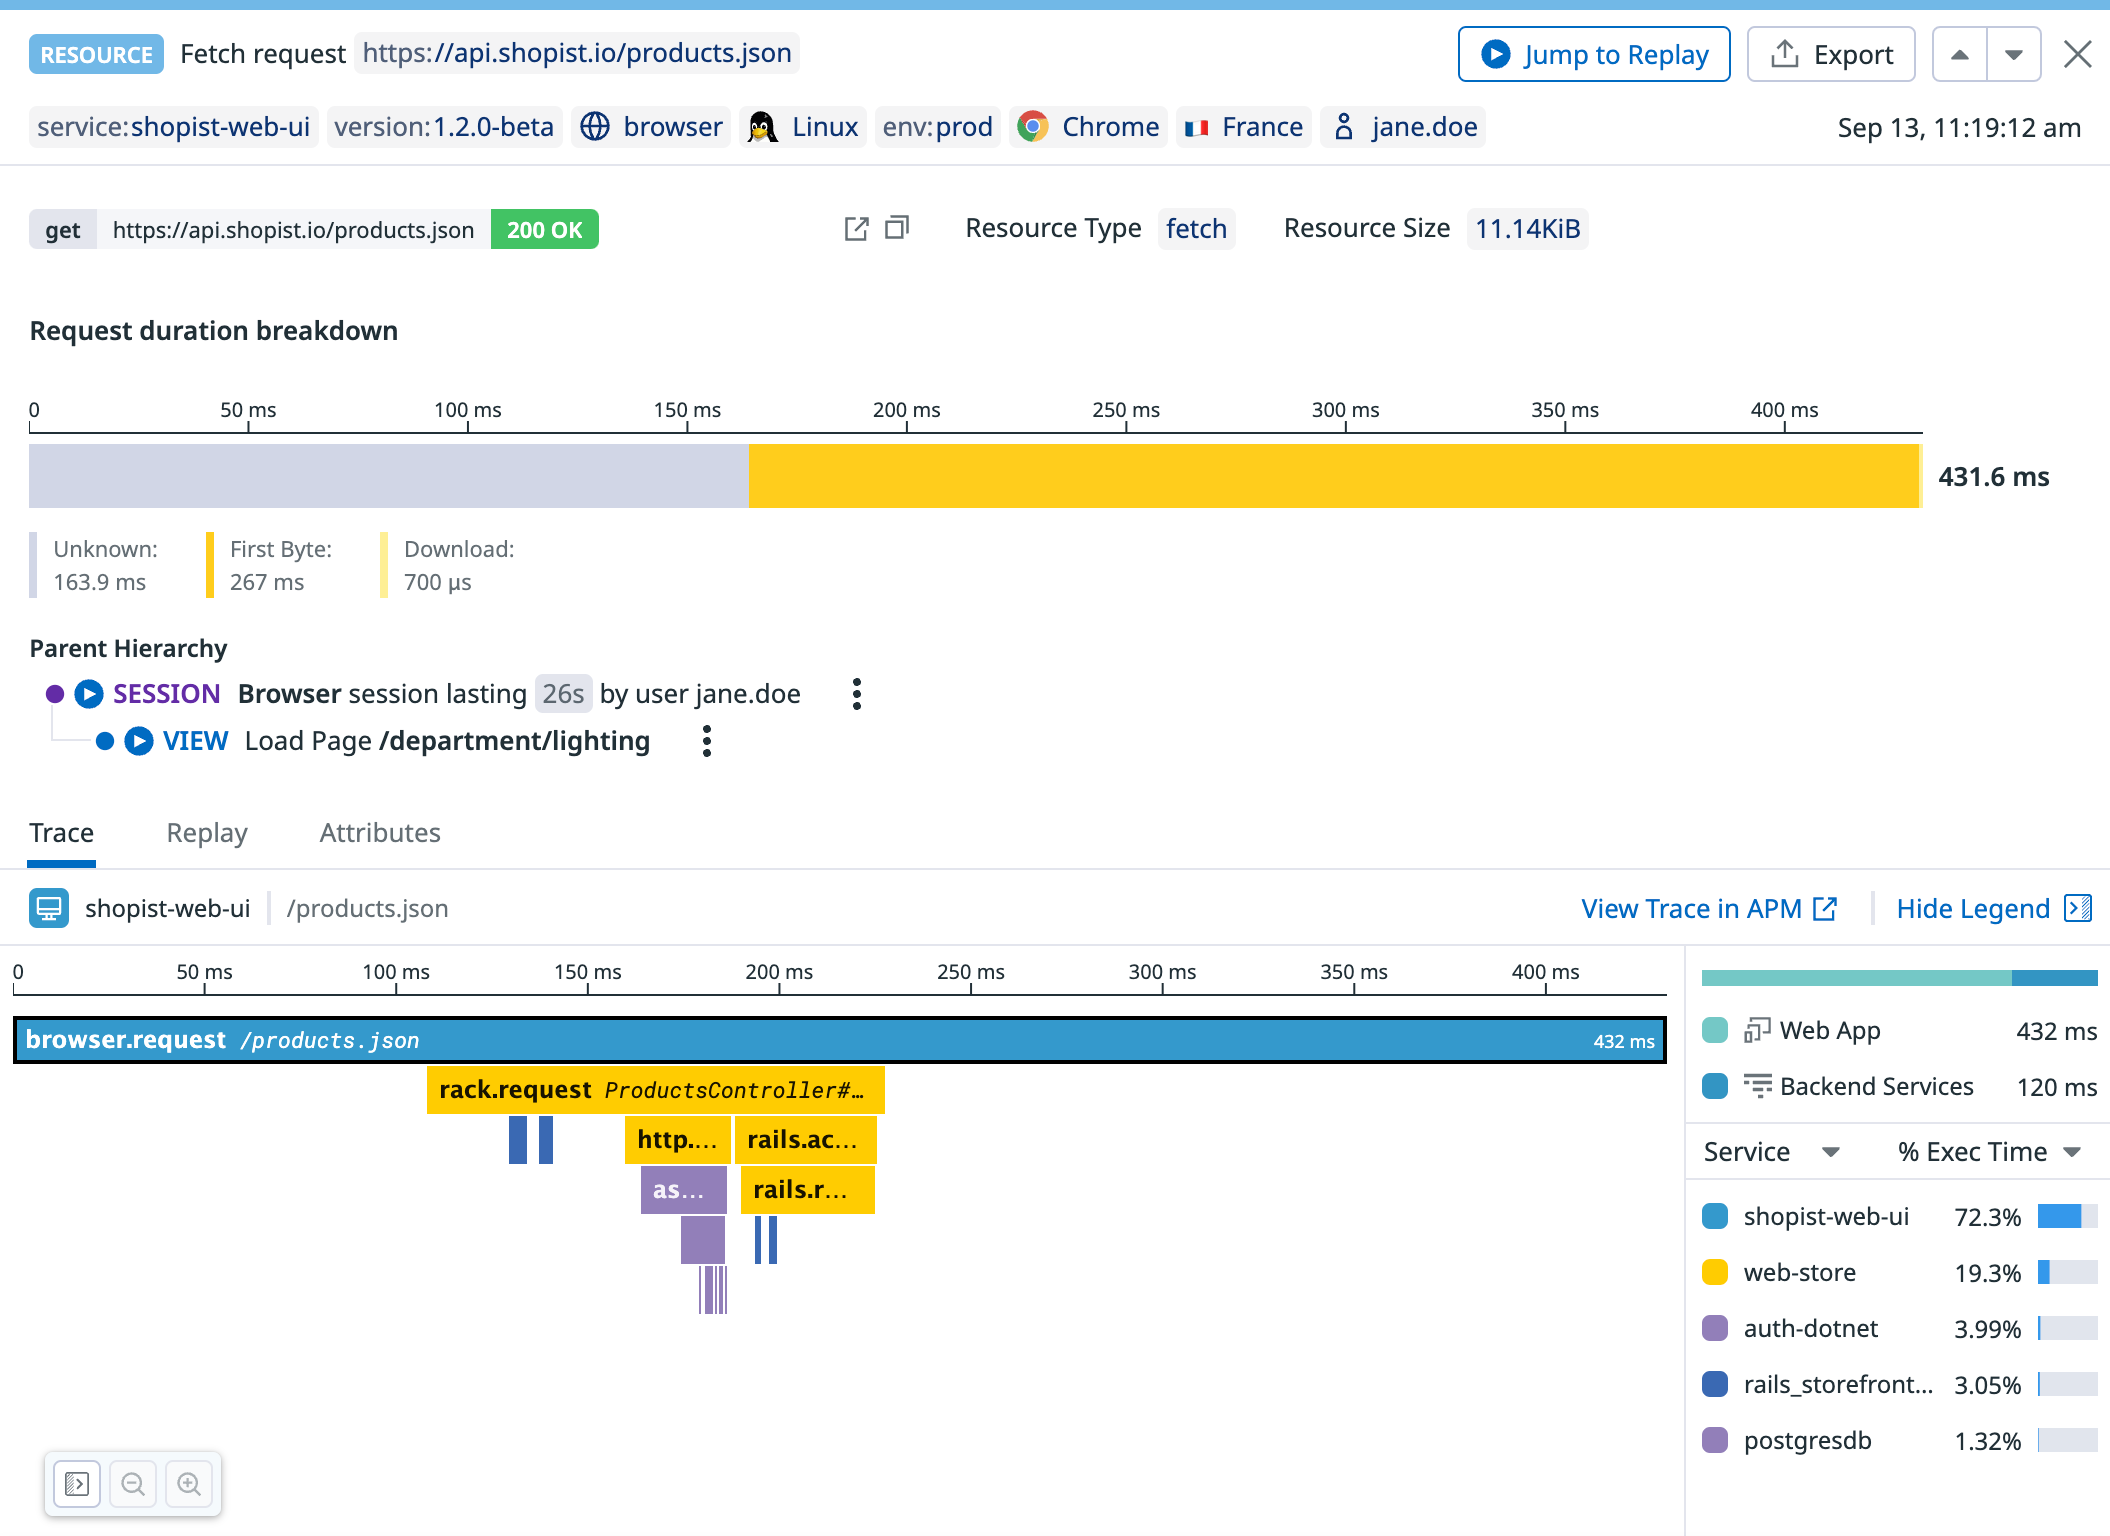
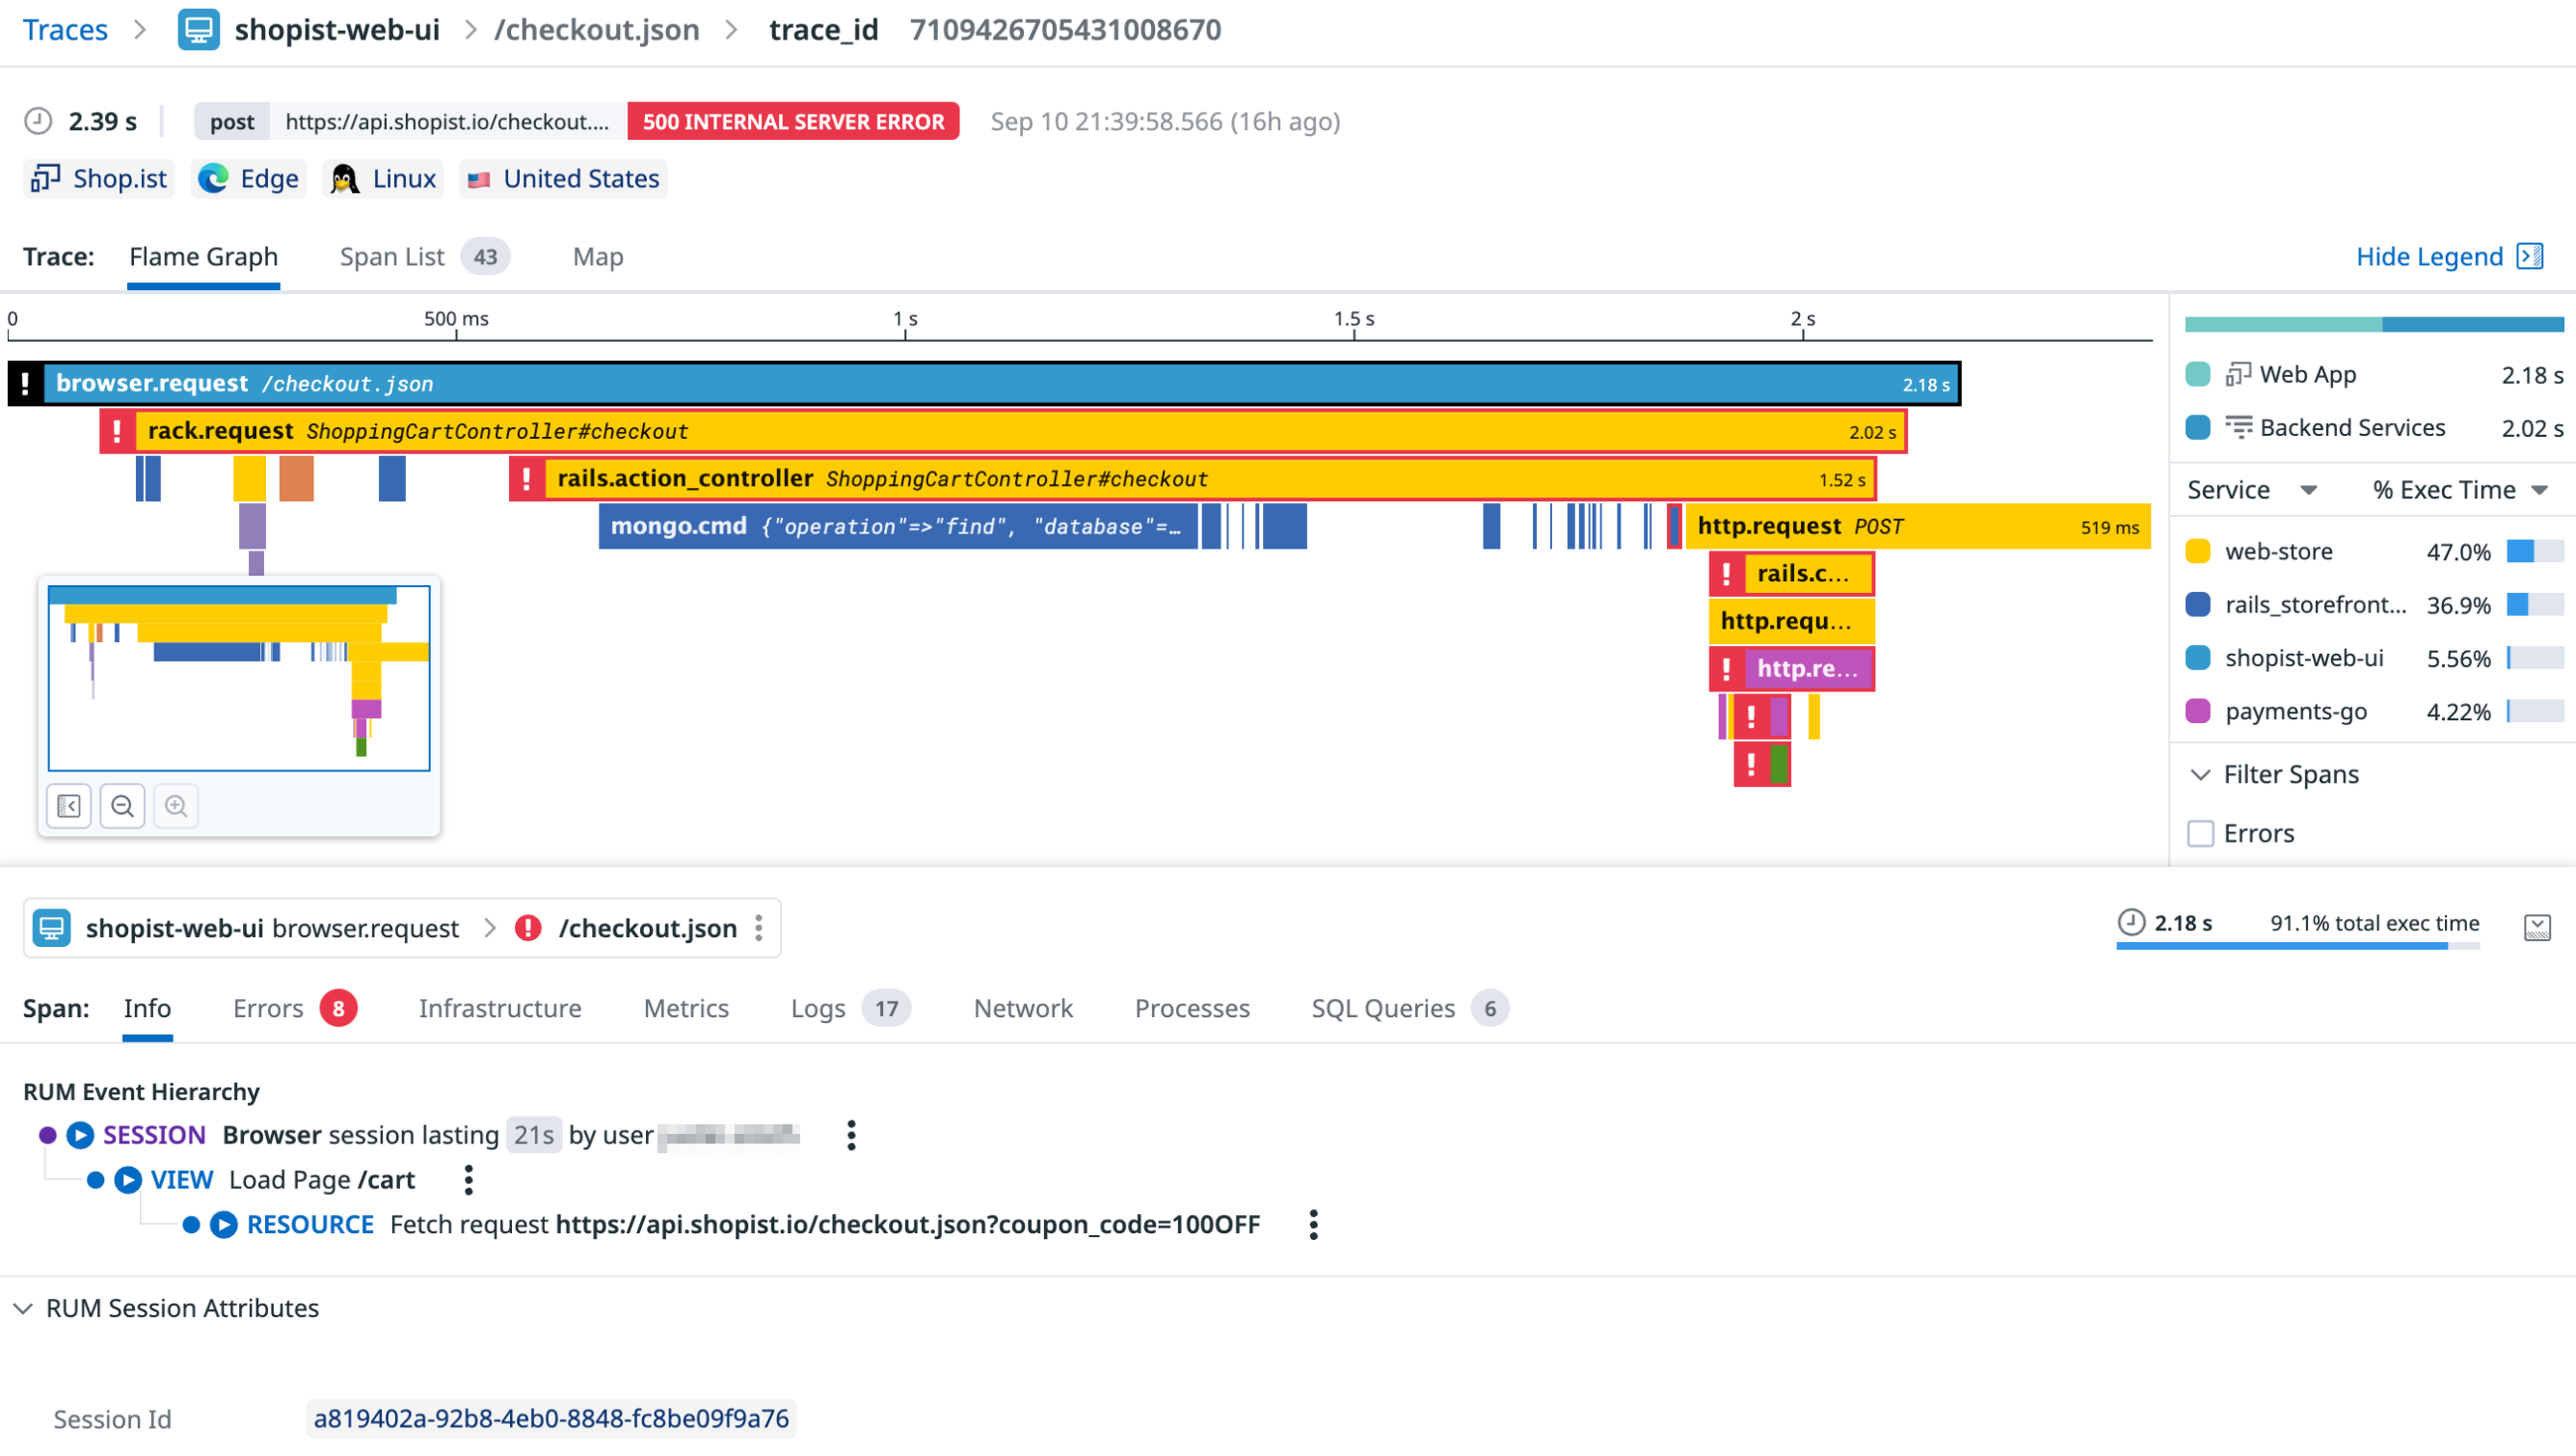
The APM traces associated with a session replay give you end-to-end visibility across frontend and backend issues, and see how code and infrastructure are impacting your user experience. Having full-stack traces can be helpful if you’re unsure whether an error is occurring on the frontend or backend of your application.
Select a replay with traces to view the browser request, as well as all the backend dependencies and services called upon to fulfill the request in a specific page.
Select View Trace in APM to see more detailed information, including errors and logs associated with the trace.
Investigating errors with Error Tracking
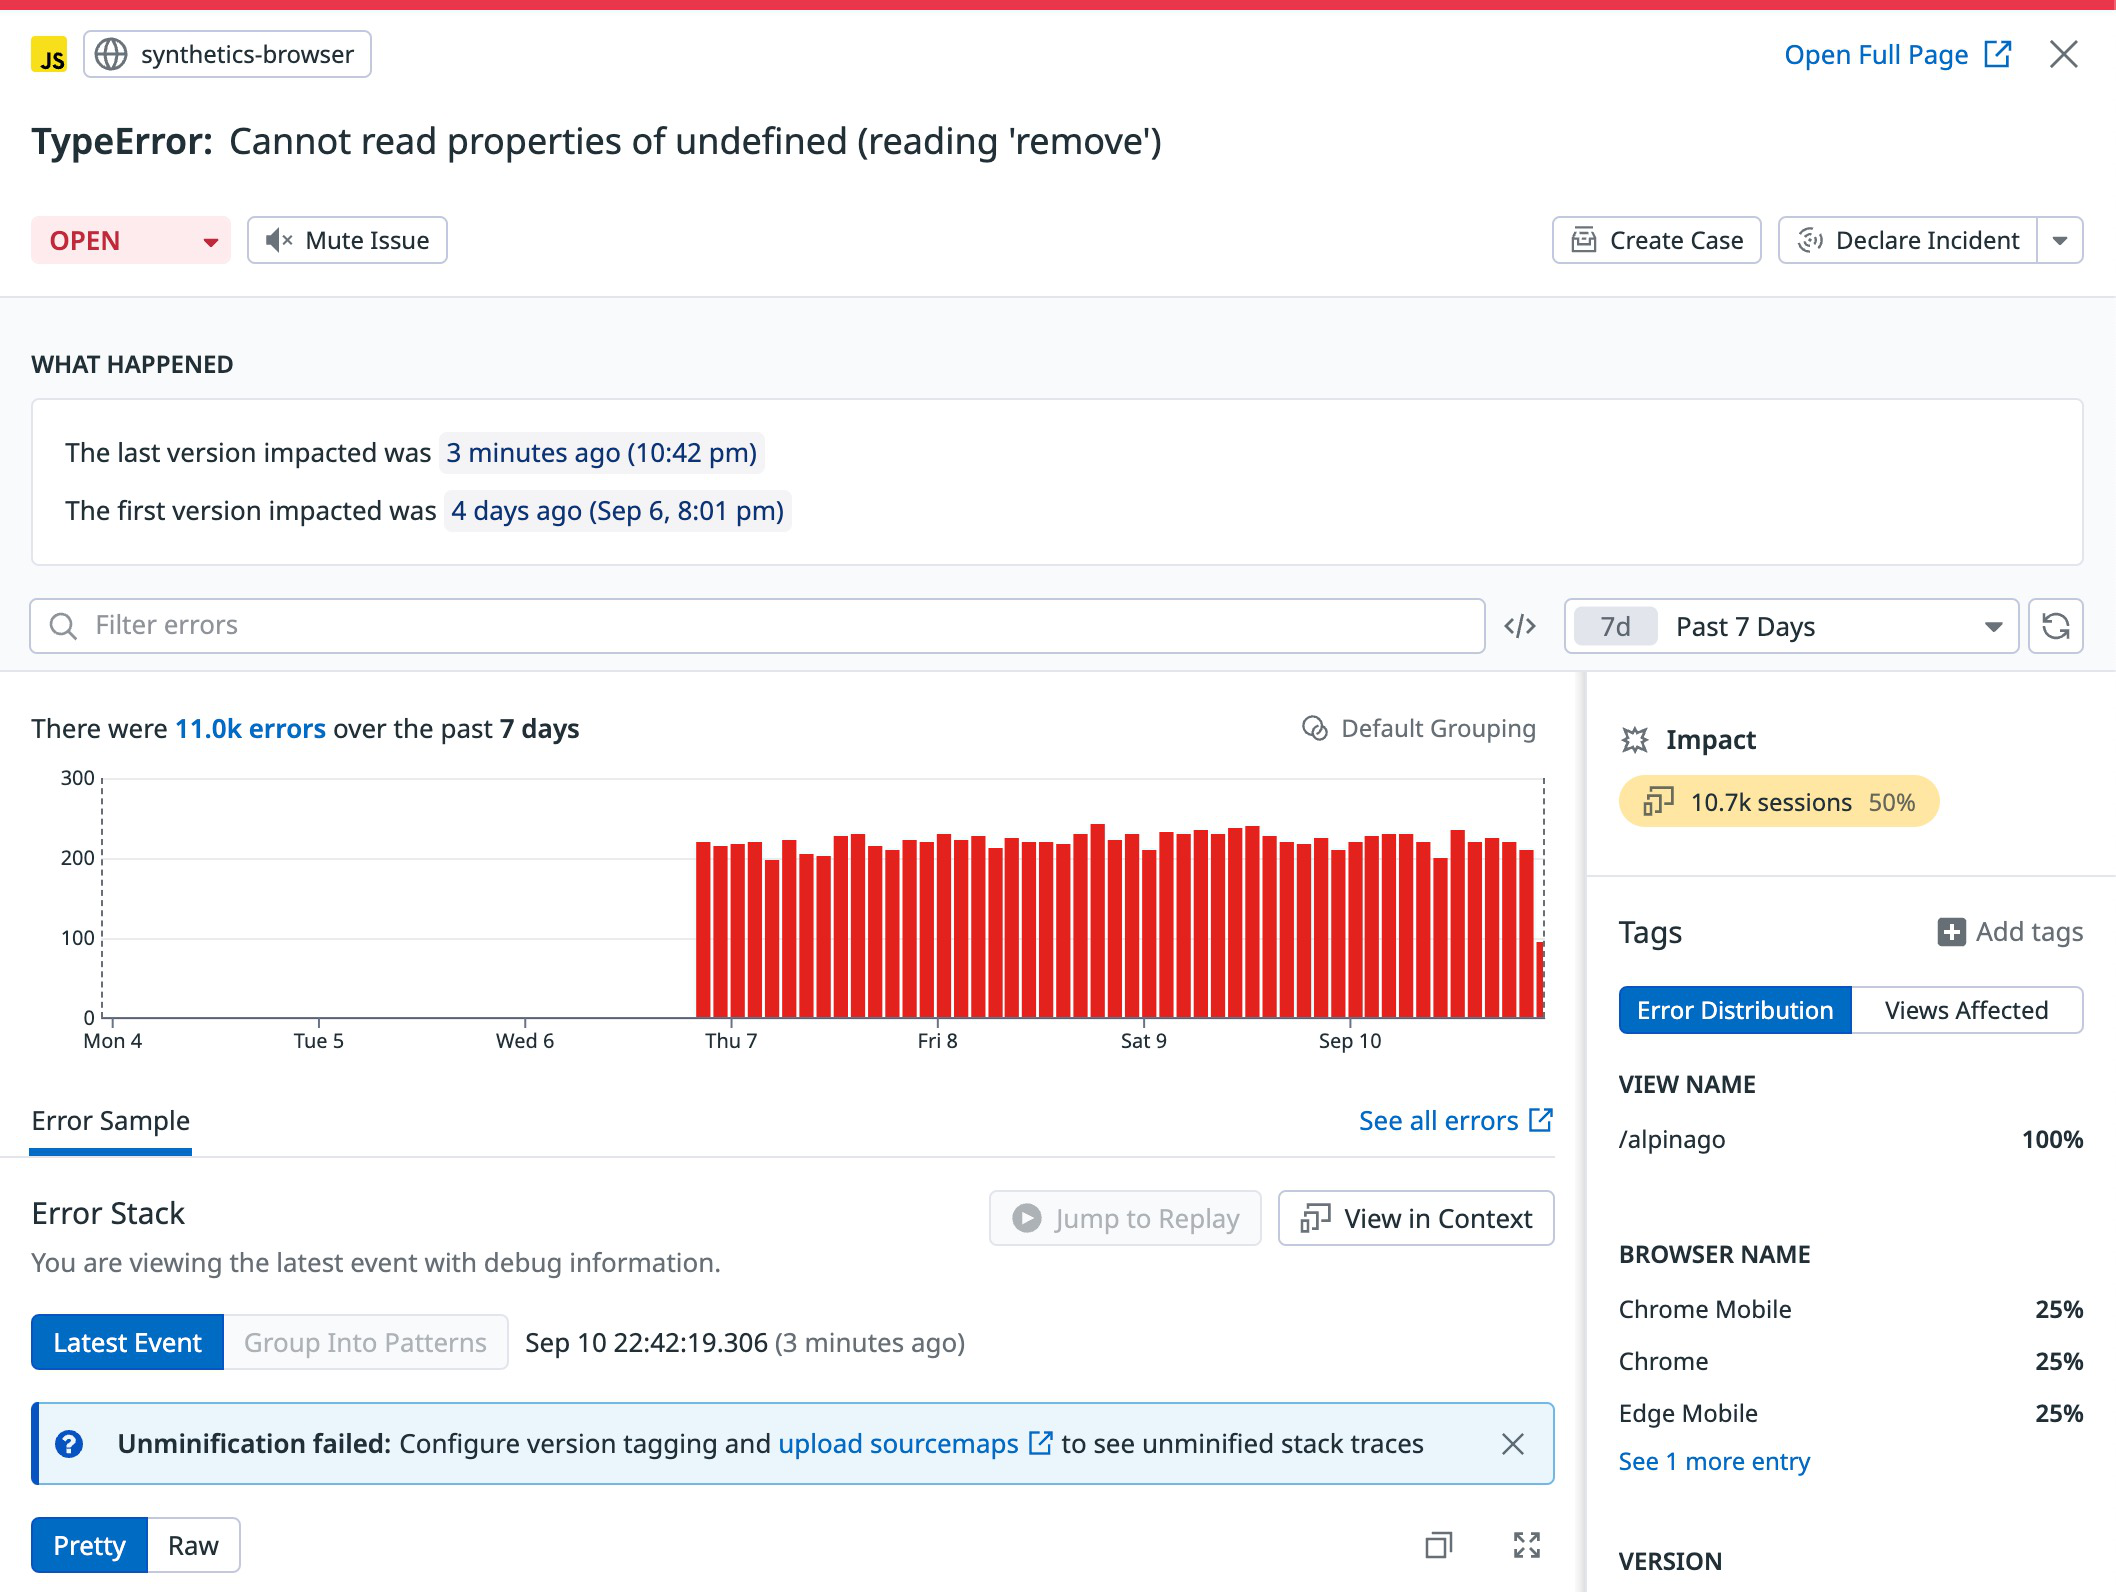
Error Tracking is helpful in debugging issues and getting to the root cause. You can receive alerts for an error occurring, see the exact line of code that caused it, and pivot to view a user session that encountered the error.
In the Errors tab, select an error to see the time the error occurred and the message. Click Issue in error tracking to see more detail and attributes associated with the session.
What’s next?
Create Synthetic browser tests from Session Replays
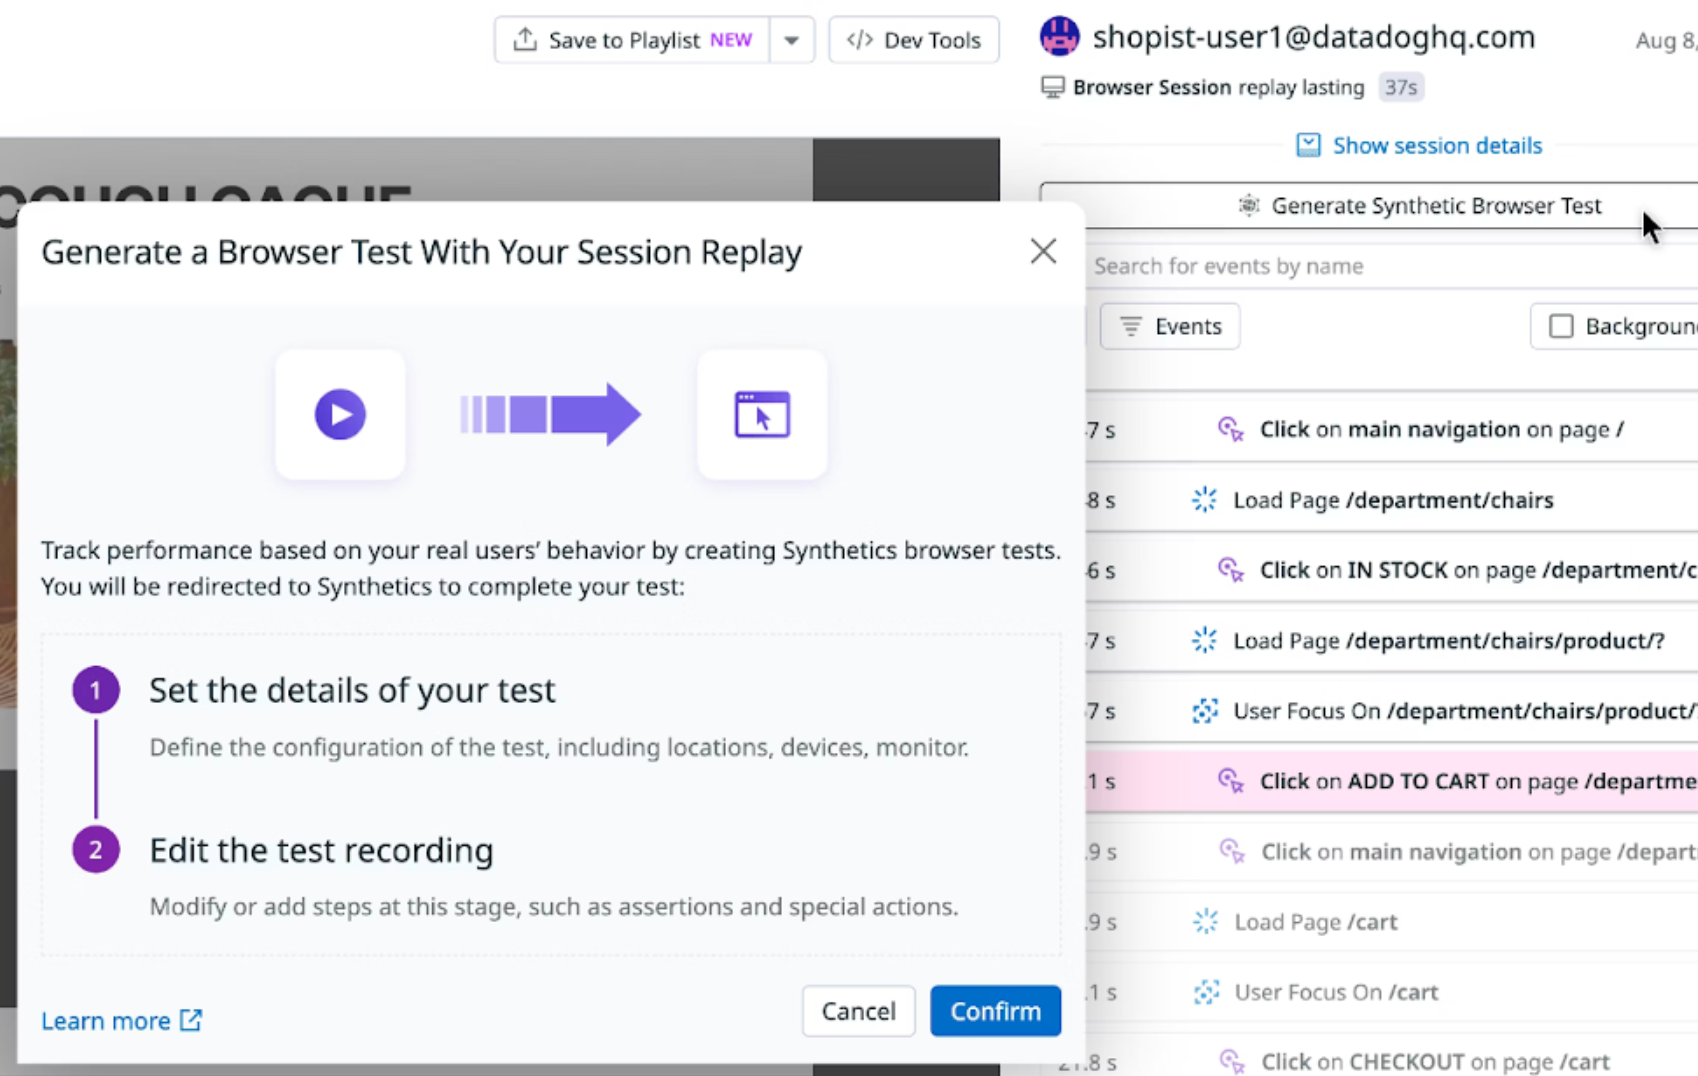
You can create a synthetic browser test from the exact sequence of steps your users went through in a Session Replay. Datadog runs synthetic tests on an automated schedule you define, to simulate user behavior, reporting failing tests to you without your users having to encounter the problem again.
To capture a session replay in a synthetic browser test, click Generate Synthetic Browser Test above the event timeline.
For more information about managing, running, and interpreting test results, read Synthetic Browser Tests.
Share with your team
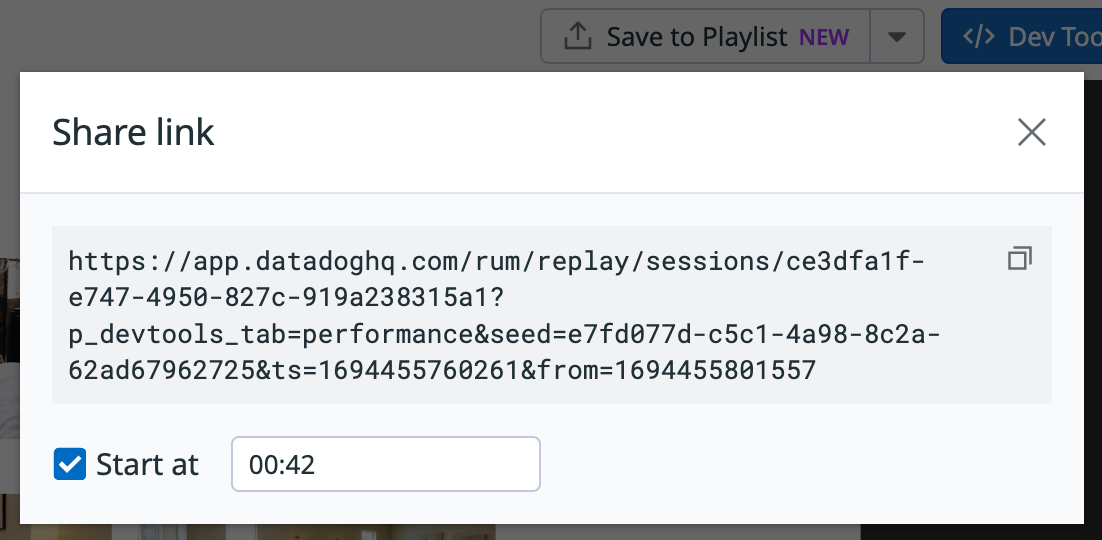
You can share the replay with your team by selecting the Share dropdown at the top of the page. You can start the replay at a specific time, to direct your team’s attention to a particular time and view of the Replay.
Further Reading
Documentation, liens et articles supplémentaires utiles:

