- 重要な情報
- はじめに
- Datadog
- Datadog サイト
- DevSecOps
- AWS Lambda のサーバーレス
- エージェント
- インテグレーション
- コンテナ
- ダッシュボード
- アラート設定
- ログ管理
- トレーシング
- プロファイラー
- タグ
- API
- Service Catalog
- Session Replay
- Continuous Testing
- Synthetic モニタリング
- Incident Management
- Database Monitoring
- Cloud Security Management
- Cloud SIEM
- Application Security Management
- Workflow Automation
- CI Visibility
- Test Visibility
- Intelligent Test Runner
- Code Analysis
- Learning Center
- Support
- 用語集
- Standard Attributes
- ガイド
- インテグレーション
- エージェント
- OpenTelemetry
- 開発者
- 認可
- DogStatsD
- カスタムチェック
- インテグレーション
- Create an Agent-based Integration
- Create an API Integration
- Create a Log Pipeline
- Integration Assets Reference
- Build a Marketplace Offering
- Create a Tile
- Create an Integration Dashboard
- Create a Recommended Monitor
- Create a Cloud SIEM Detection Rule
- OAuth for Integrations
- Install Agent Integration Developer Tool
- サービスのチェック
- IDE インテグレーション
- コミュニティ
- ガイド
- API
- モバイルアプリケーション
- CoScreen
- Cloudcraft
- アプリ内
- Service Management
- インフラストラクチャー
- アプリケーションパフォーマンス
- APM
- Continuous Profiler
- データベース モニタリング
- Data Streams Monitoring
- Data Jobs Monitoring
- Digital Experience
- Software Delivery
- CI Visibility (CI/CDの可視化)
- CD Visibility
- Test Visibility
- Intelligent Test Runner
- Code Analysis
- Quality Gates
- DORA Metrics
- セキュリティ
- セキュリティの概要
- Cloud SIEM
- クラウド セキュリティ マネジメント
- Application Security Management
- AI Observability
- ログ管理
- Observability Pipelines(観測データの制御)
- ログ管理
- 管理
コスト詳細
概要
Cost Summary and Cost Chargebacks help you understand your estimated month-to-date, projected end-of-month, and historical Datadog costs. Cost data is available for the past 15 months.
下部組織や製品ごとにコストを細分化することで、
- ソースに応じてコストを割り当てることができます
- コストの追跡状況を把握できます
権限
Roles with Billing Read (billing_read) and Usage Read (usage_read) permissions can view the Cost Summary and Cost Chargebacks data. Users with the Datadog Admin role have these permissions by default.
コストサマリー
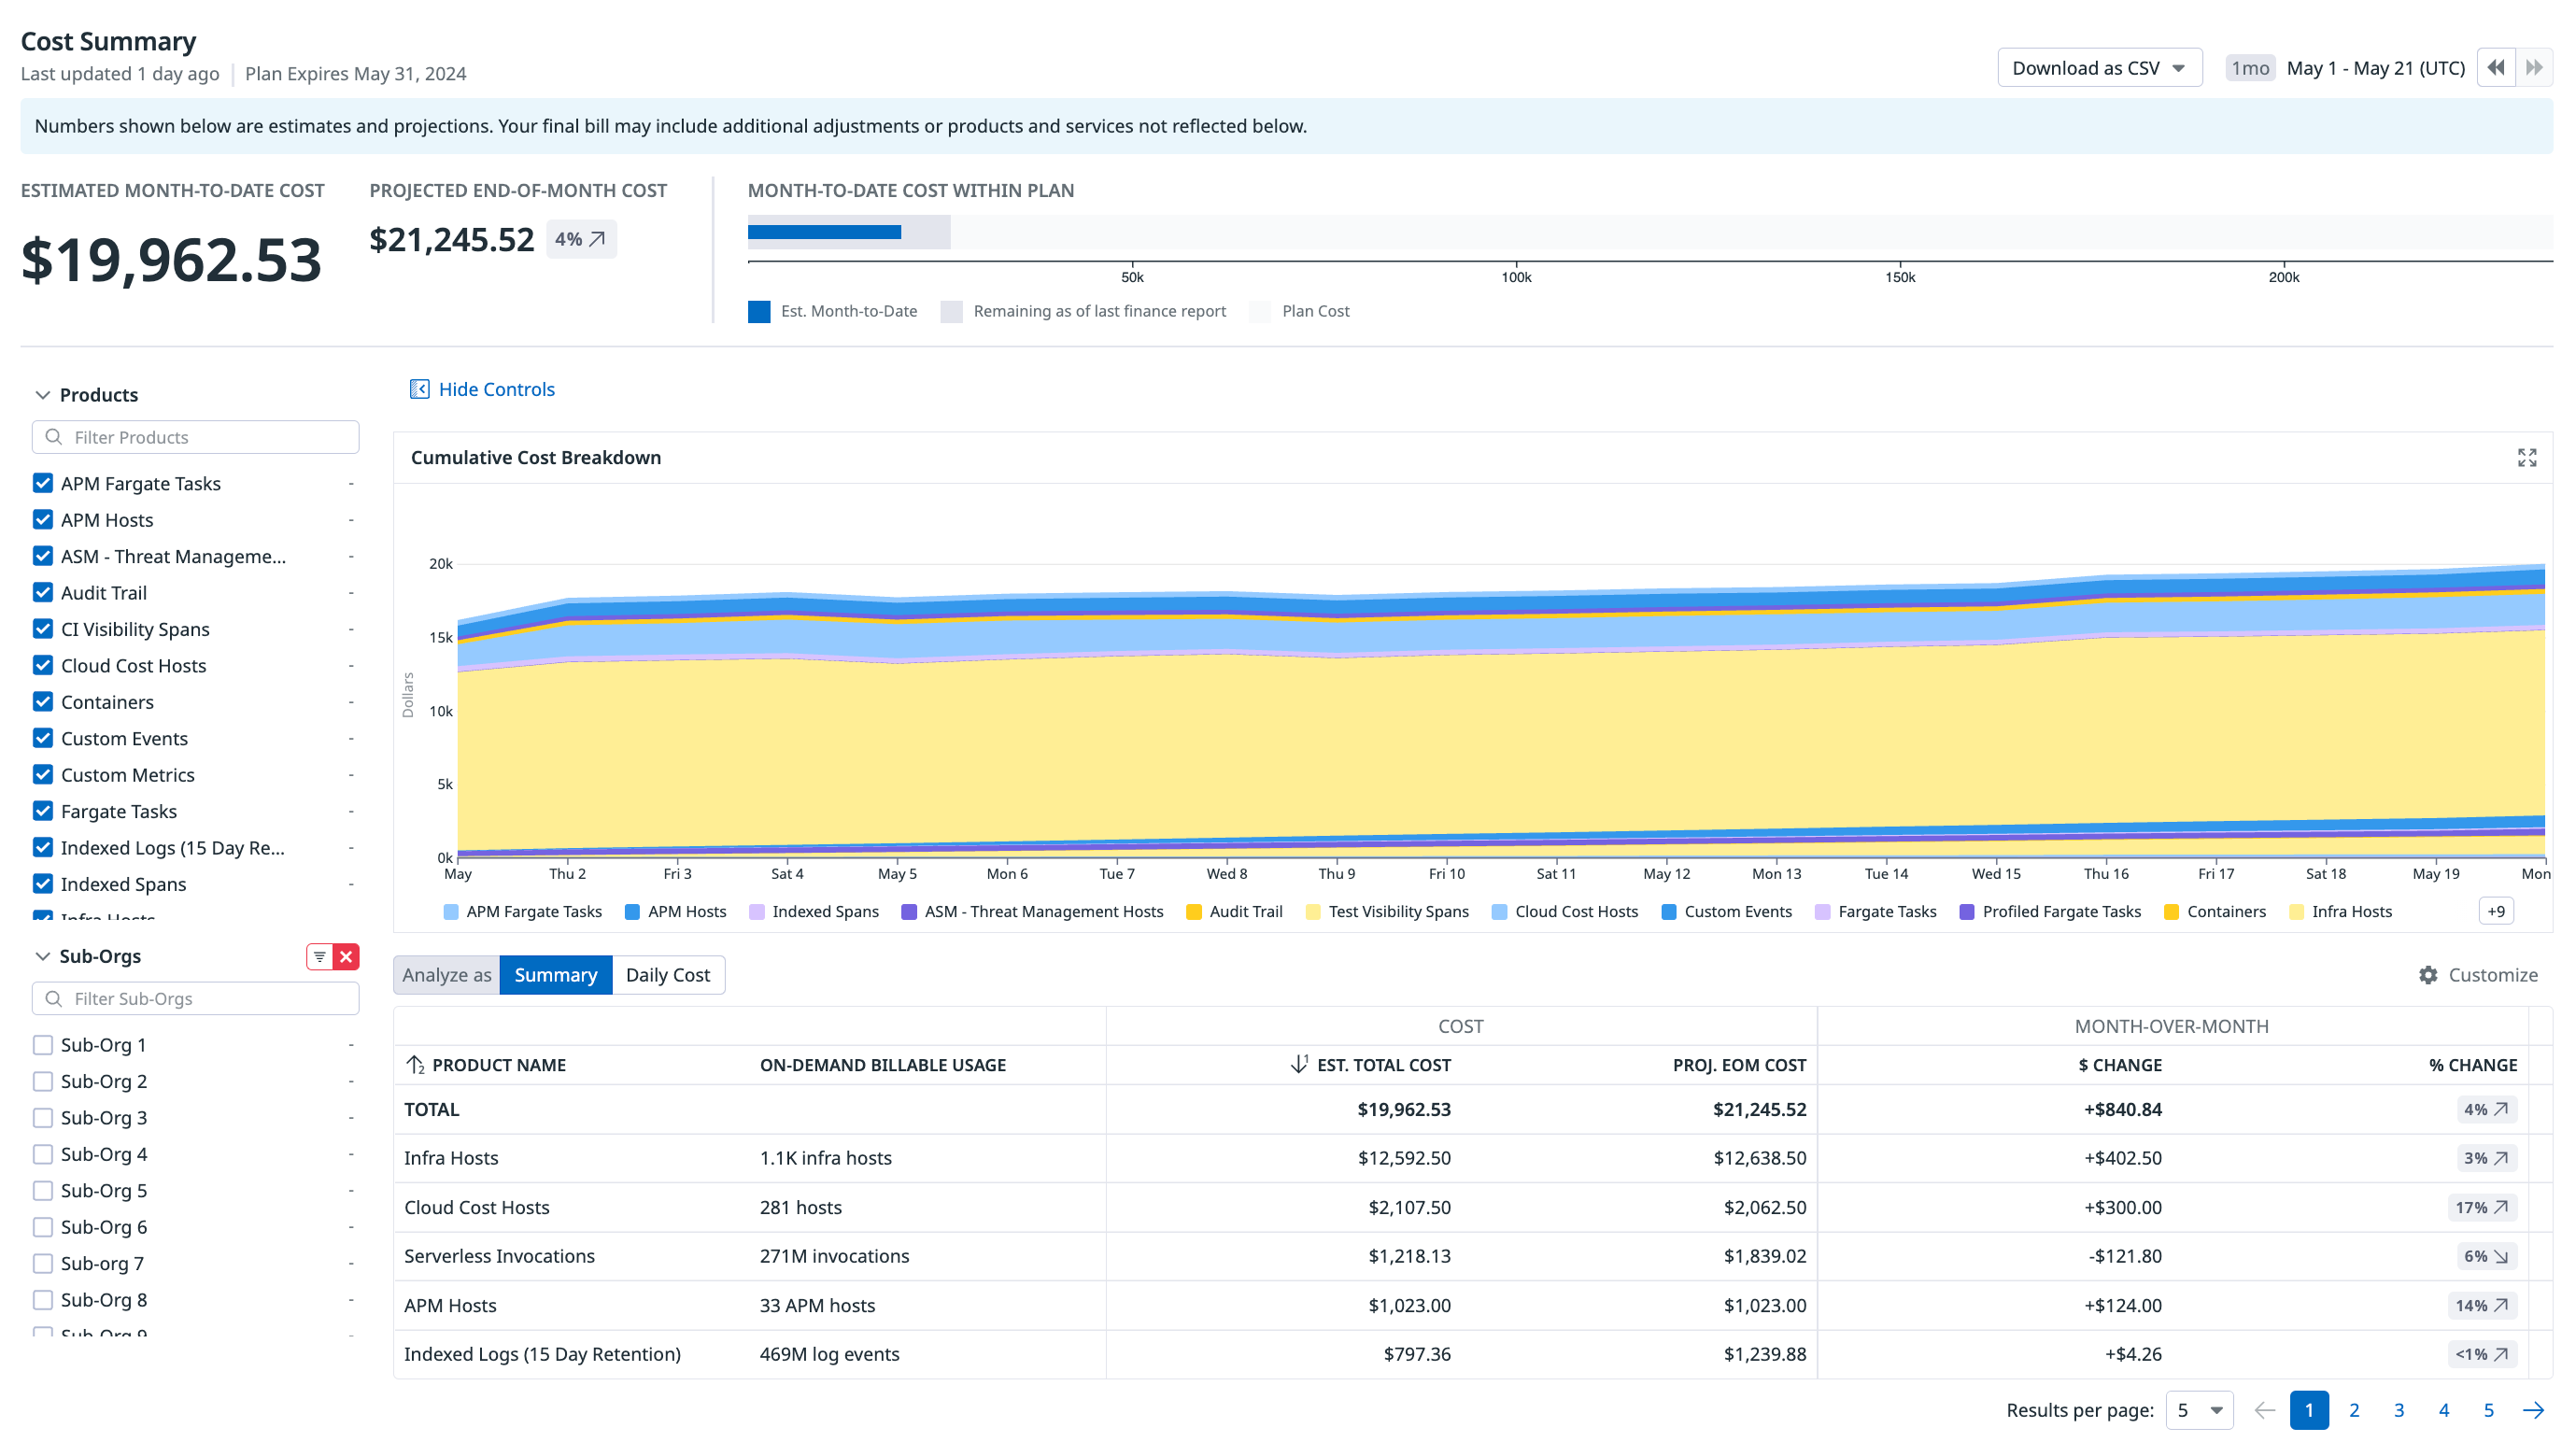
コストサマリーを使用して
- View estimated month-to-date and projected end-of-month costs
- View historical costs
- 製品または下部組織ごとにフィルターをかけてコストをグループ化します
- View month-over-month % and $ cost changes
- 月内のコスト動向を表示します
- 累積前日比コストを表示します
Projected Costs (parent organization)
Projected end-of-month costs are calculated by applying the current month’s projected usage data against your contracted rates. Projections are available around the 12th of the month and are updated daily. Projected end-of-month costs may change over time, depending on your usage throughout the month. Because the costs are a prediction, the amount may differ from your finalized monthly cost.
Cost Summary (parent organization)
The cost summary functionality changes according to your Datadog usage as a single organization or a multi-organization. As a multi-organization, you can view estimated, projected, and historical costs for the parent organization and each sub-organization.
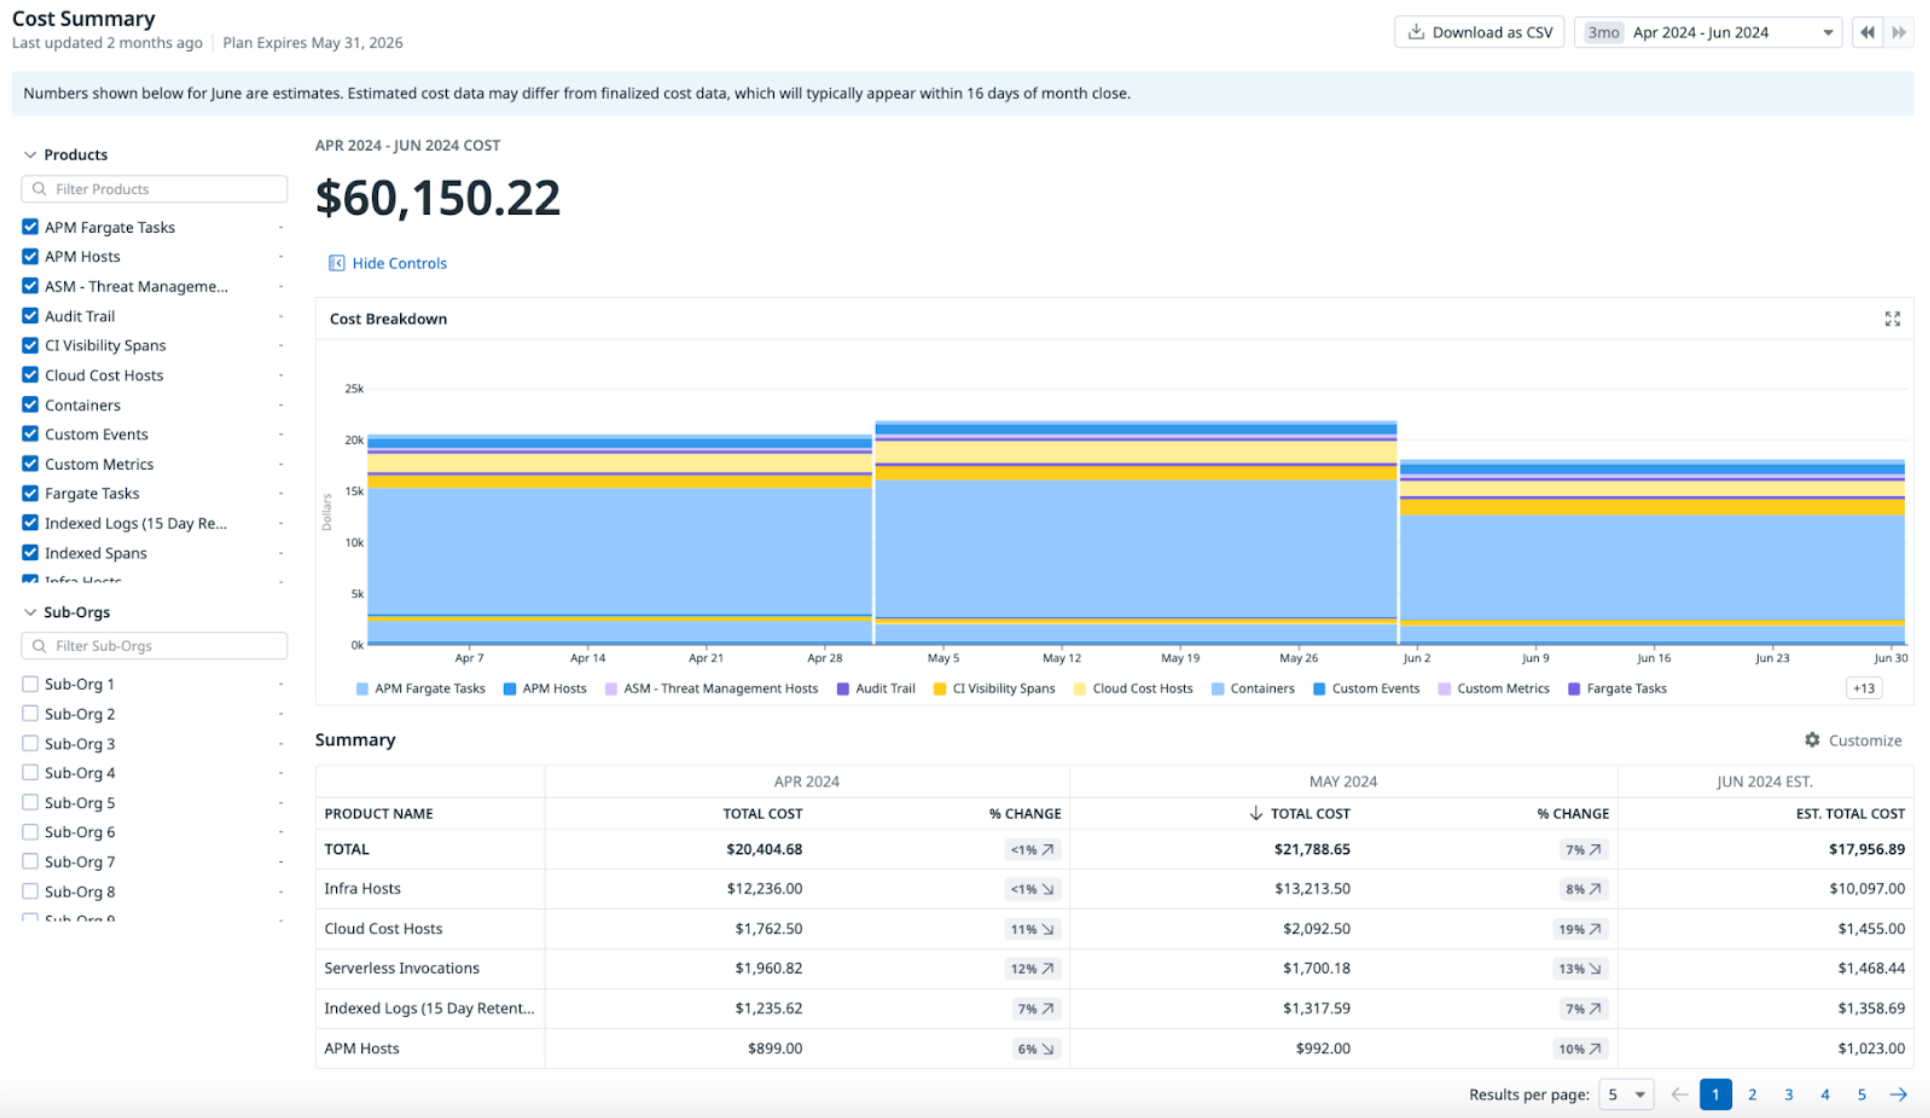
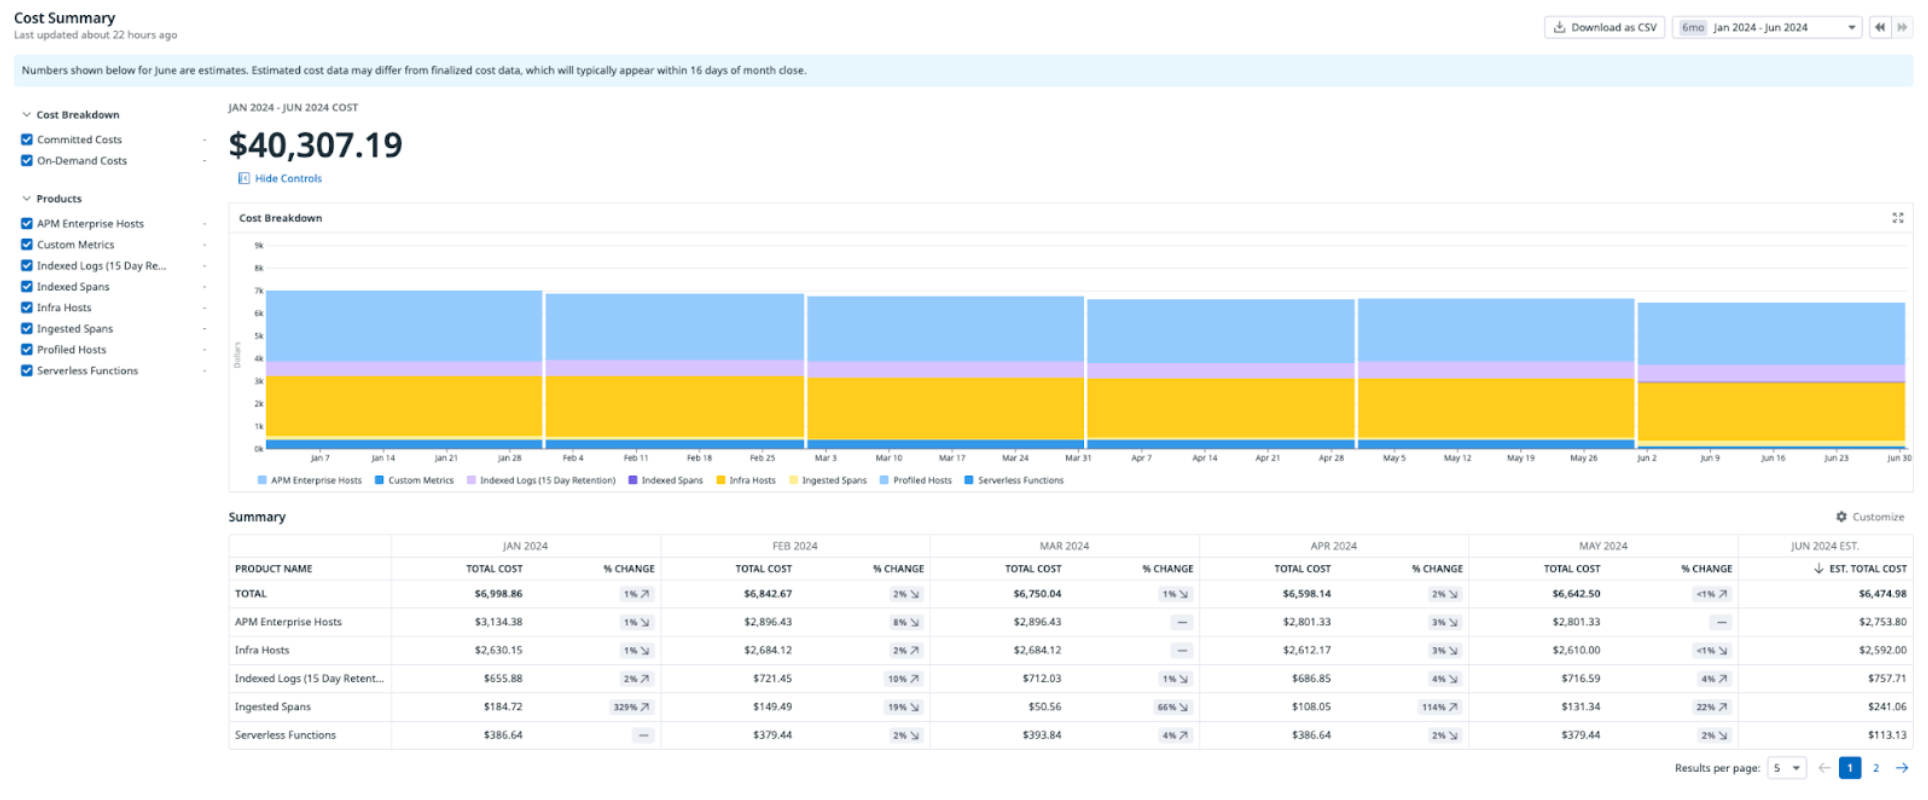
View historical costs by toggling back to previous months, or use the date dropdown to view costs over 1,3, 6 or 12 months.
- 親組織にログインした状態で、Plan & Usage に移動します。
- Usage タブをクリックします。
- 複数組織の場合は、Overall タブが選択されていることを確認します。
表示とフィルター
Use the search facets at the left to filter the cost by Products, Sub-Orgs or Cost Breakdown. Use the Daily Cost tab to see how the cumulative day-over-day costs have changed within the current month.
ダウンロード
To download the data as a comma separated value file, click Download as CSV. Data is available for the current month and pre-defined prior months. Use the Cost Type field to distinguish between the records:
- Projected: Data is available for the current month.
- Estimated MTD: Data is available from the first of the month to the current date. If historical cost data is not yet available for the prior month, estimated cost data also displays for the prior month.
- Historical: Data is available after month close, which is approximately 16 days after the end of the month.
To query estimated cost data through the API, see Get estimated cost across your account. To query projected cost data through the API, see Get projected cost across your account.
Cost Summary (sub-organization)
この機能はベータ版です。アクセスをリクエストし、お客様の組織がこの機能の基準を満たしていることを確認するには、アカウント担当者またはカスタマーサポートにお問い合わせください。
下部組織は、自分の組織のコストのみを表示することができます。この制限により、所有権が分散され、親組織に広範な管理者権限を付与する必要がなくなります。
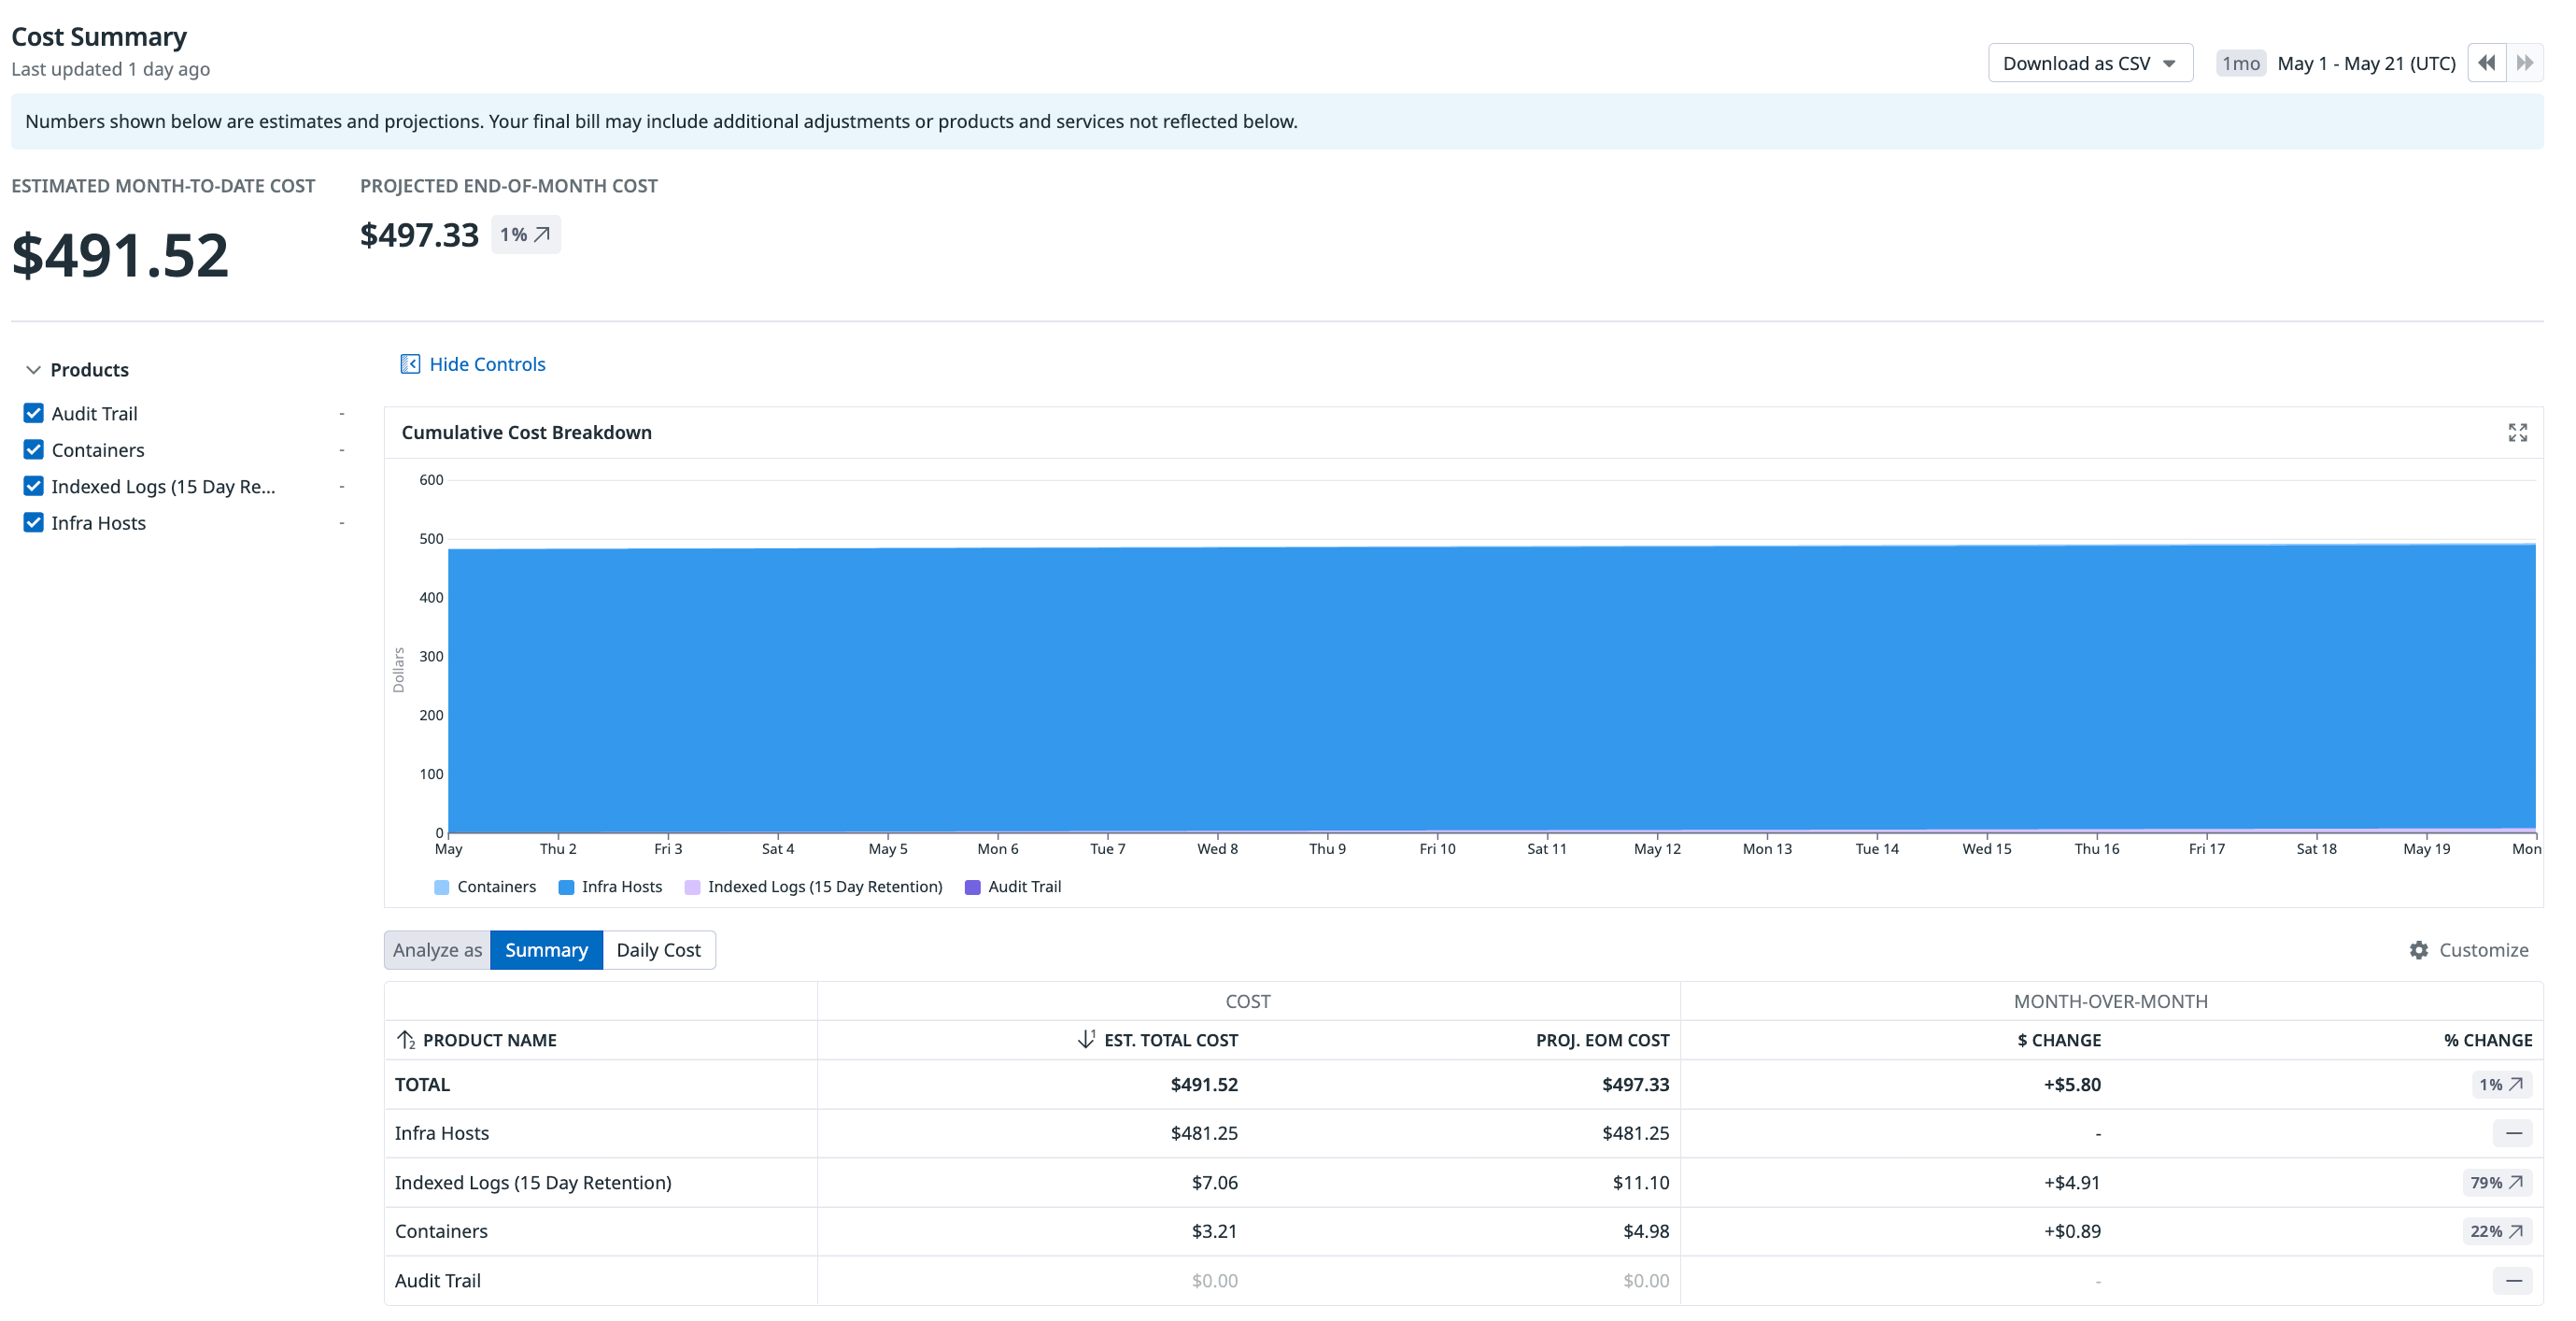
View historical costs by toggling back to previous months, or use the date dropdown to view costs over 1,3, 6 or 12 months.
- サブ組織にログインした状態で、Plan & Usage に移動します。
- Usage タブをクリックします。
- Overall タブが選択されていることを確認します。
表示とフィルター
Use the search facets at the left to filter the cost by Products or Cost Breakdown. Use the Daily Cost tab to see how the cumulative day-over-day costs have changed within the current month.
ダウンロード
カンマ区切りの値ファイルとしてデータをダウンロードするには、Download as CSV をクリックします。
コストチャージバック
コストチャージバックを使用して
- 複数組織の月間推定コストと過去のコストを表示します
- 各下部組織にコストを属性化します
Cost chargebacks are derived by:
- Calculating the sub-organization usage ratio. This is done by dividing usage per sub-organization by the total parent organization usage.
- Applying the sub-organization usage ratio against the parent organization costs, providing the cost chargebacks per sub-organization.
過去のコストチャージバック
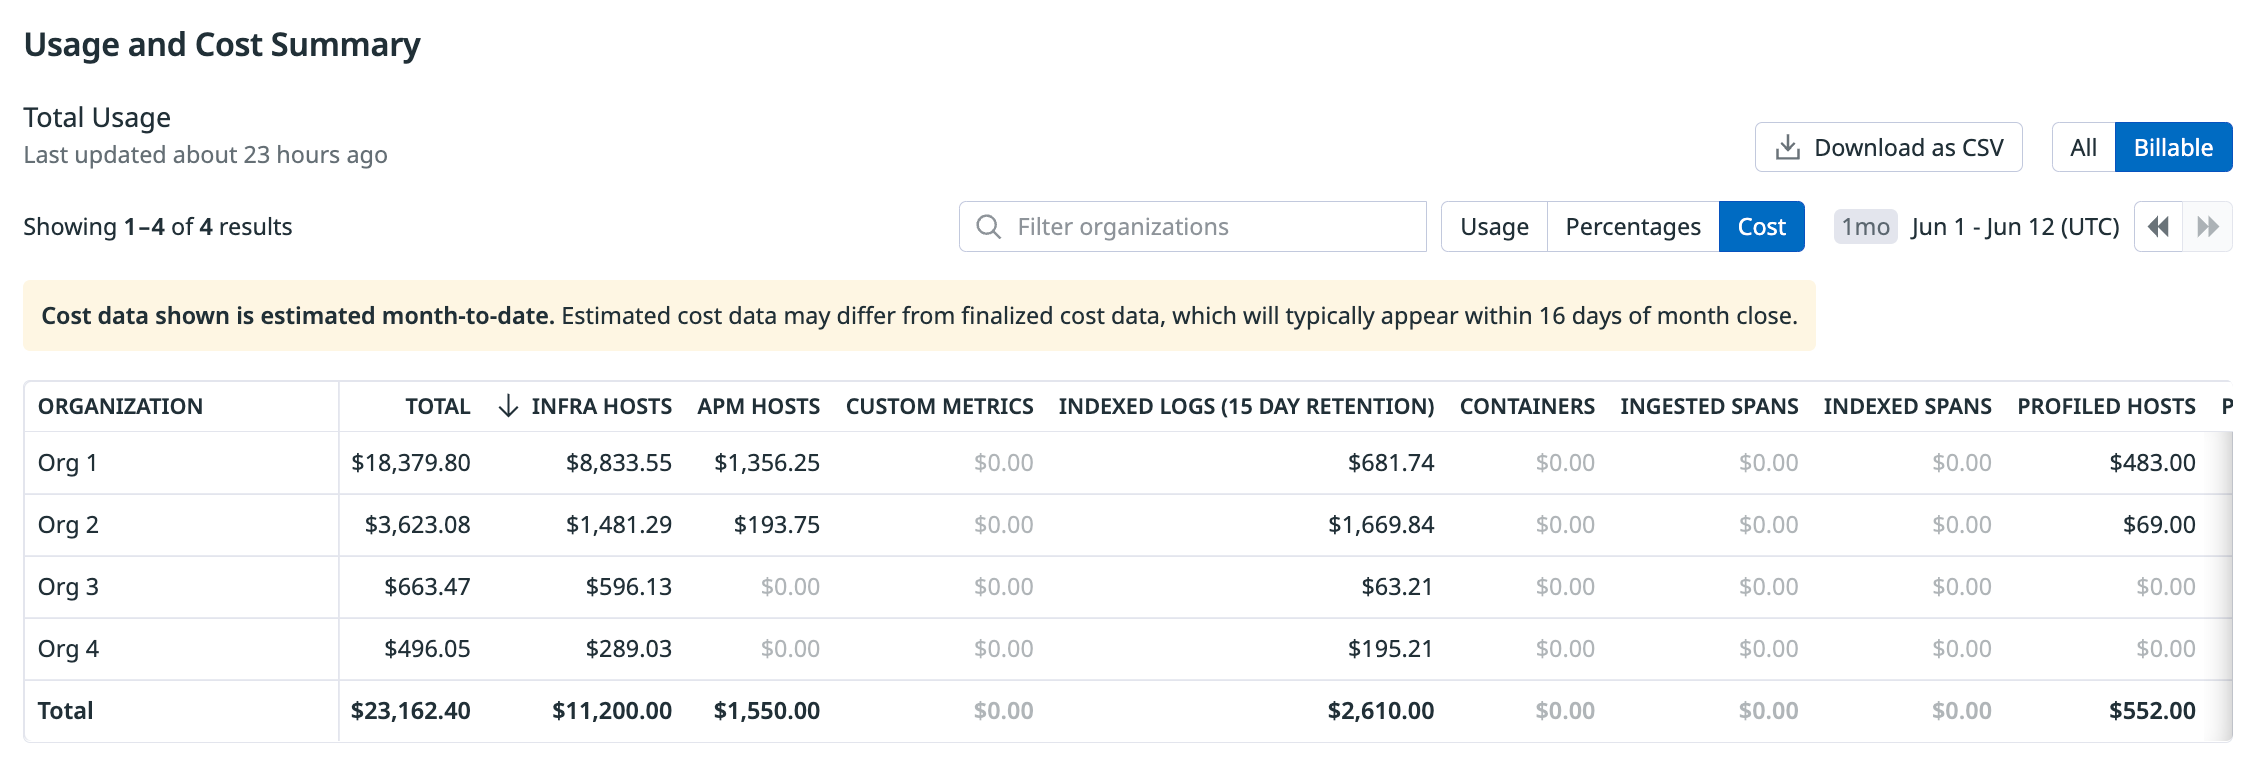
親組織から、製品別、下部組織別に集計された最終的な過去のコストを表示します。
- 親組織にログインした状態で、Plan & Usage に移動します。
- Usage タブを選択します。
- Individual Organizations をクリックします。
- Billable と Cost トグルが選択されていることを確認します。
- 請求が完了した前月を表示するには、日付セレクタを使用します。
注: データは月末締めの約 16 日後に入手可能になります。
推定コストチャージバック
親組織から、製品別、下部組織別に集計された推定コストを表示します。
推定コストデータは当月分です。前月の履歴コストデータがまだない場合は、前月の推定コストデータも表示されます。
- 親組織にログインした状態で、Plan & Usage に移動します。
- Select the Usage tab.
- Individual Organizations をクリックします。
- Billable と Cost トグルが選択されていることを確認します。
- 日付セレクタに当月または前月が表示されていることを確認します。
ダウンロード
- 過去または推定のコストチャージバックデータをカンマ区切りの値ファイルとしてダウンロードするには、Download as CSV をクリックします。
- API を使用して過去のコストチャージバックデータを照会するには、アカウント全体で過去のコストを取得するを参照してください。
- API を使用して推定コストチャージバックデータを照会するには、アカウント全体で見積コストを取得するを参照してください。
請求集計がコスト変動に与える影響
Datadog の当月請求予定額は月によって異なります。各製品の請求に使用される集計の種類によって、コストがどのように影響されるかが決まります。最適な視覚化については、コスト サマリー機能チャートをご覧ください。各 Products フィルターには、製品名の横に関連する請求集計方法が含まれています。
パーセンタイルおよび平均使用量請求
月間使用量の下位 99 パーセントの最大カウント (ハイウォーターマーク) で請求される製品には、インフラストラクチャーホストおよび APM ホストが含まれます。月間平均で請求される製品には、カスタムメトリクスと Fargate タスクが含まれます。これら 2 つのタイプの製品については、コストは月を通して比較的安定していると予想されます。ただし、使用量が大幅に急増または減少した場合は、コストは変動する可能性があります。
使用量請求の合計
月間使用量の合計で請求される製品には、インデックス化ログと取り込みログが含まれます。これらのタイプの製品については、使用量の変化に応じてコストが増減することが予想されます。
参考資料
お役に立つドキュメント、リンクや記事:
