- Essentials
- Getting Started
- Datadog
- Datadog Site
- DevSecOps
- Serverless for AWS Lambda
- Agent
- Integrations
- Containers
- Dashboards
- Monitors
- Logs
- APM Tracing
- Profiler
- Tags
- API
- Service Catalog
- Session Replay
- Continuous Testing
- Synthetic Monitoring
- Incident Management
- Database Monitoring
- Cloud Security Management
- Cloud SIEM
- Application Security Management
- Workflow Automation
- CI Visibility
- Test Visibility
- Test Impact Analysis
- Code Analysis
- Learning Center
- Support
- Glossary
- Standard Attributes
- Guides
- Agent
- Integrations
- OpenTelemetry
- Developers
- Authorization
- DogStatsD
- Custom Checks
- Integrations
- Create an Agent-based Integration
- Create an API Integration
- Create a Log Pipeline
- Integration Assets Reference
- Build a Marketplace Offering
- Create a Tile
- Create an Integration Dashboard
- Create a Recommended Monitor
- Create a Cloud SIEM Detection Rule
- OAuth for Integrations
- Install Agent Integration Developer Tool
- Service Checks
- IDE Plugins
- Community
- Guides
- Administrator's Guide
- API
- Datadog Mobile App
- CoScreen
- Cloudcraft
- In The App
- Dashboards
- Notebooks
- DDSQL Editor
- Sheets
- Monitors and Alerting
- Infrastructure
- Metrics
- Watchdog
- Bits AI
- Service Catalog
- API Catalog
- Error Tracking
- Service Management
- Infrastructure
- Application Performance
- APM
- Continuous Profiler
- Database Monitoring
- Data Streams Monitoring
- Data Jobs Monitoring
- Digital Experience
- Real User Monitoring
- Product Analytics
- Synthetic Testing and Monitoring
- Continuous Testing
- Software Delivery
- CI Visibility
- CD Visibility
- Test Optimization
- Code Analysis
- Quality Gates
- DORA Metrics
- Security
- Security Overview
- Cloud SIEM
- Cloud Security Management
- Application Security Management
- AI Observability
- Log Management
- Observability Pipelines
- Log Management
- Administration
Downtimes
Overview
Schedule downtimes for system shutdowns, off-line maintenance, or upgrades without triggering your monitors. Downtimes silence all monitors’ alerts and notifications, but do not prevent monitor states transitions.
Setup
Create a downtime schedule
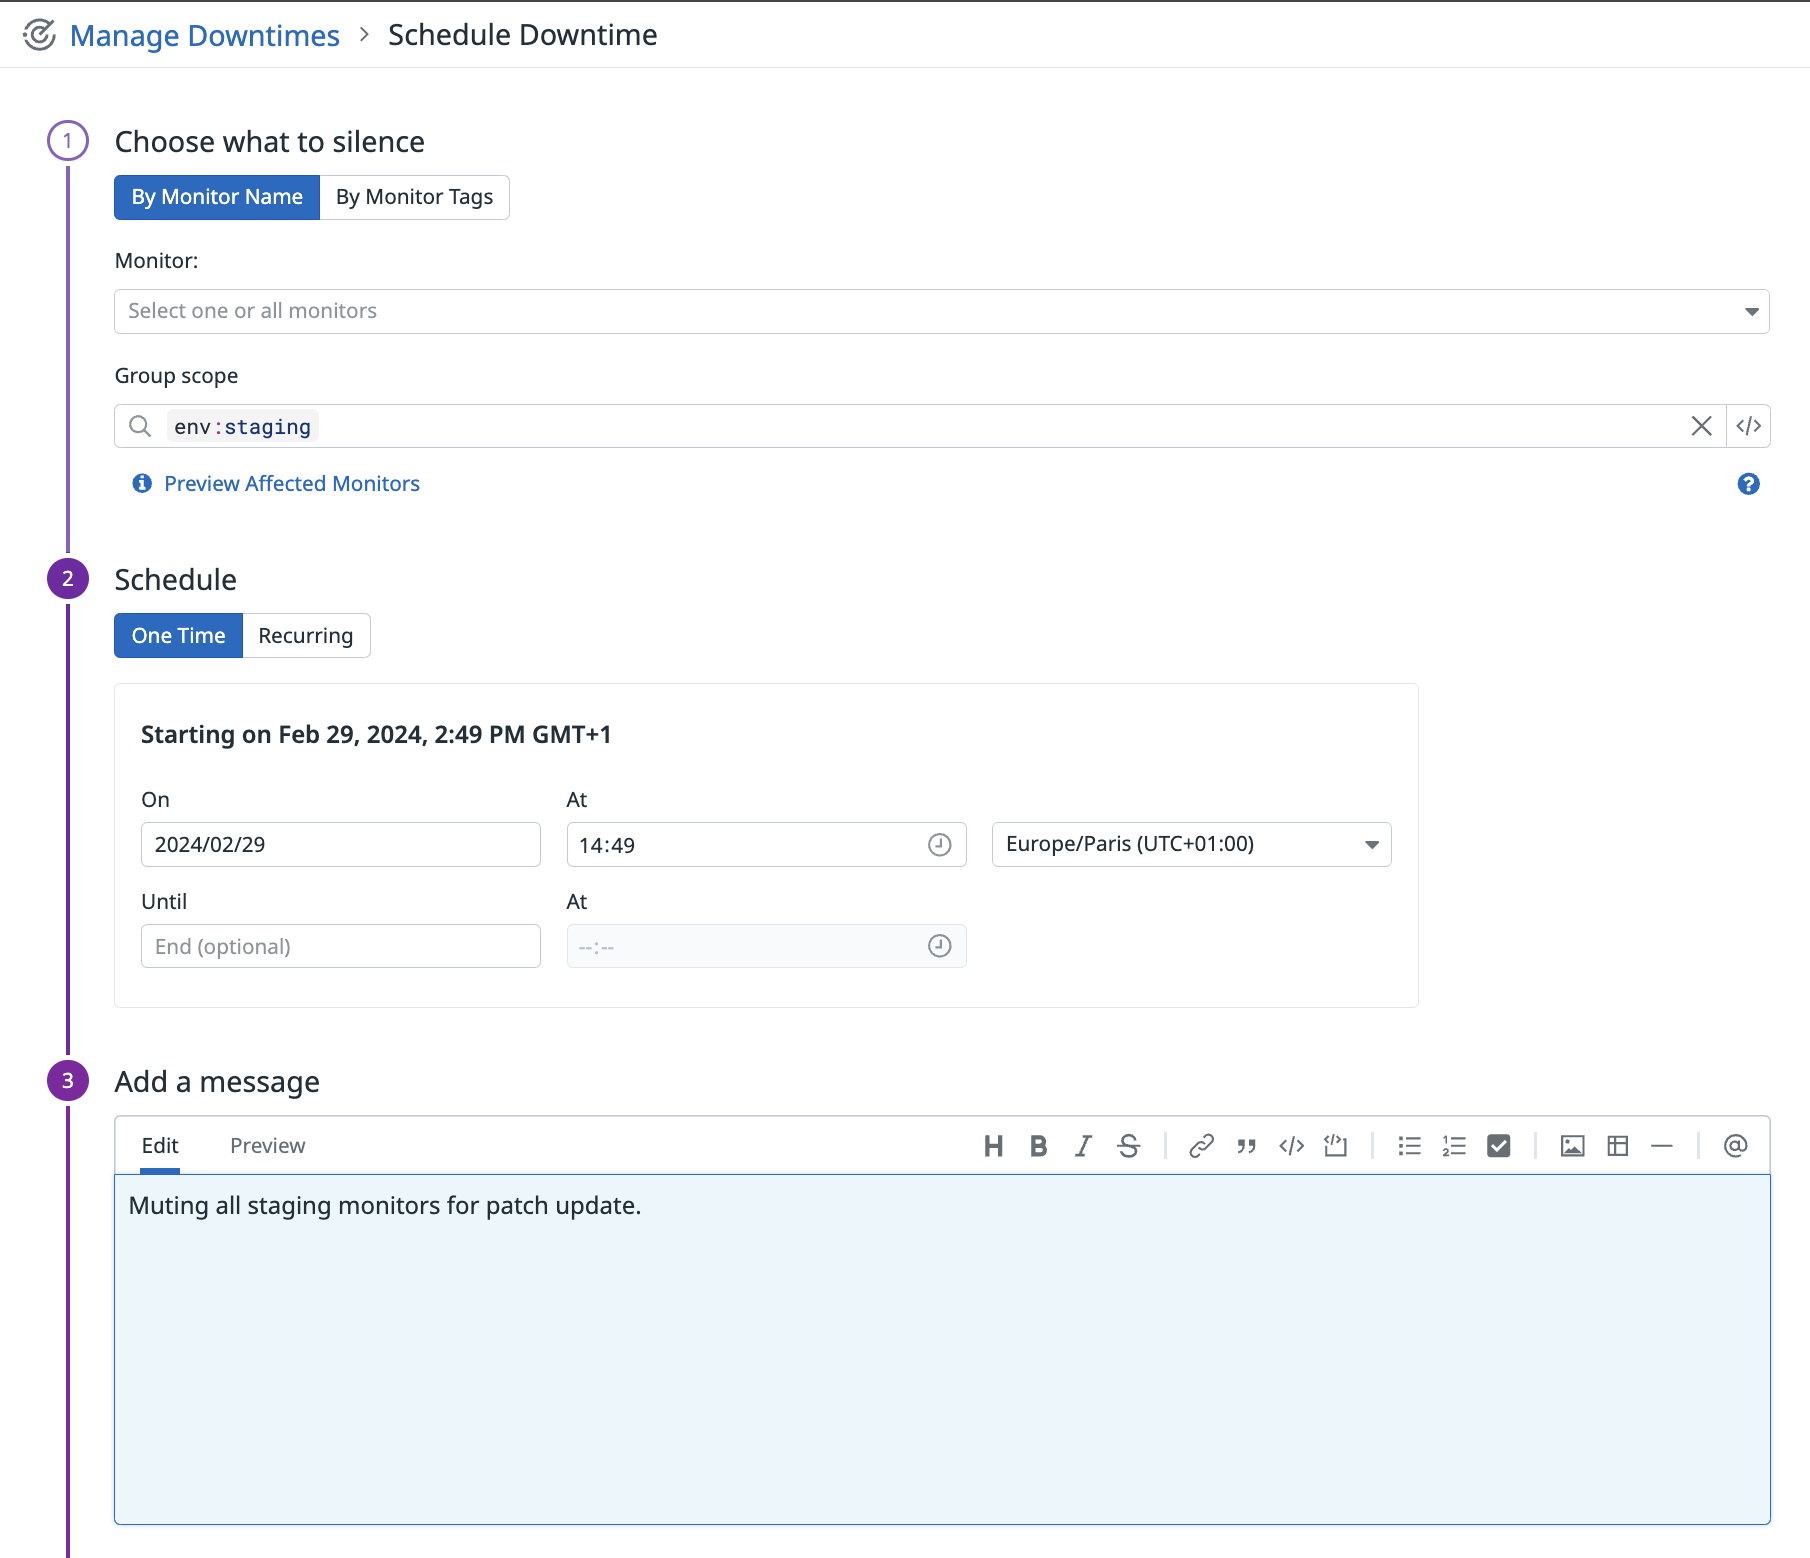
To schedule a monitor downtime in Datadog navigate to the Manage Downtimes page. Then, click the Schedule Downtime button in the upper right.
To mute an individual monitor, click the Mute button at the top of the monitor status page. This creates a downtime schedule for that particular monitor.
Choose what to silence
Apply downtime schedules to specific monitors by name or to a broad range of monitors by monitor tags. Apply additional filters through the Group scope. Click Preview affected monitors to see the monitors included. For more examples and use cases see Scoping downtimes schedules.
Note: Any monitor created or edited after the downtime is scheduled is automatically included in the downtime if it matches the scope.
Search or use the dropdown menu to choose which monitors to silence. If the field is left empty, all monitors are silenced by default. You can also select a scope to constrain your downtime to a specific host, device, or arbitrary tag. Only monitors that have ALL selected scopes are silenced.
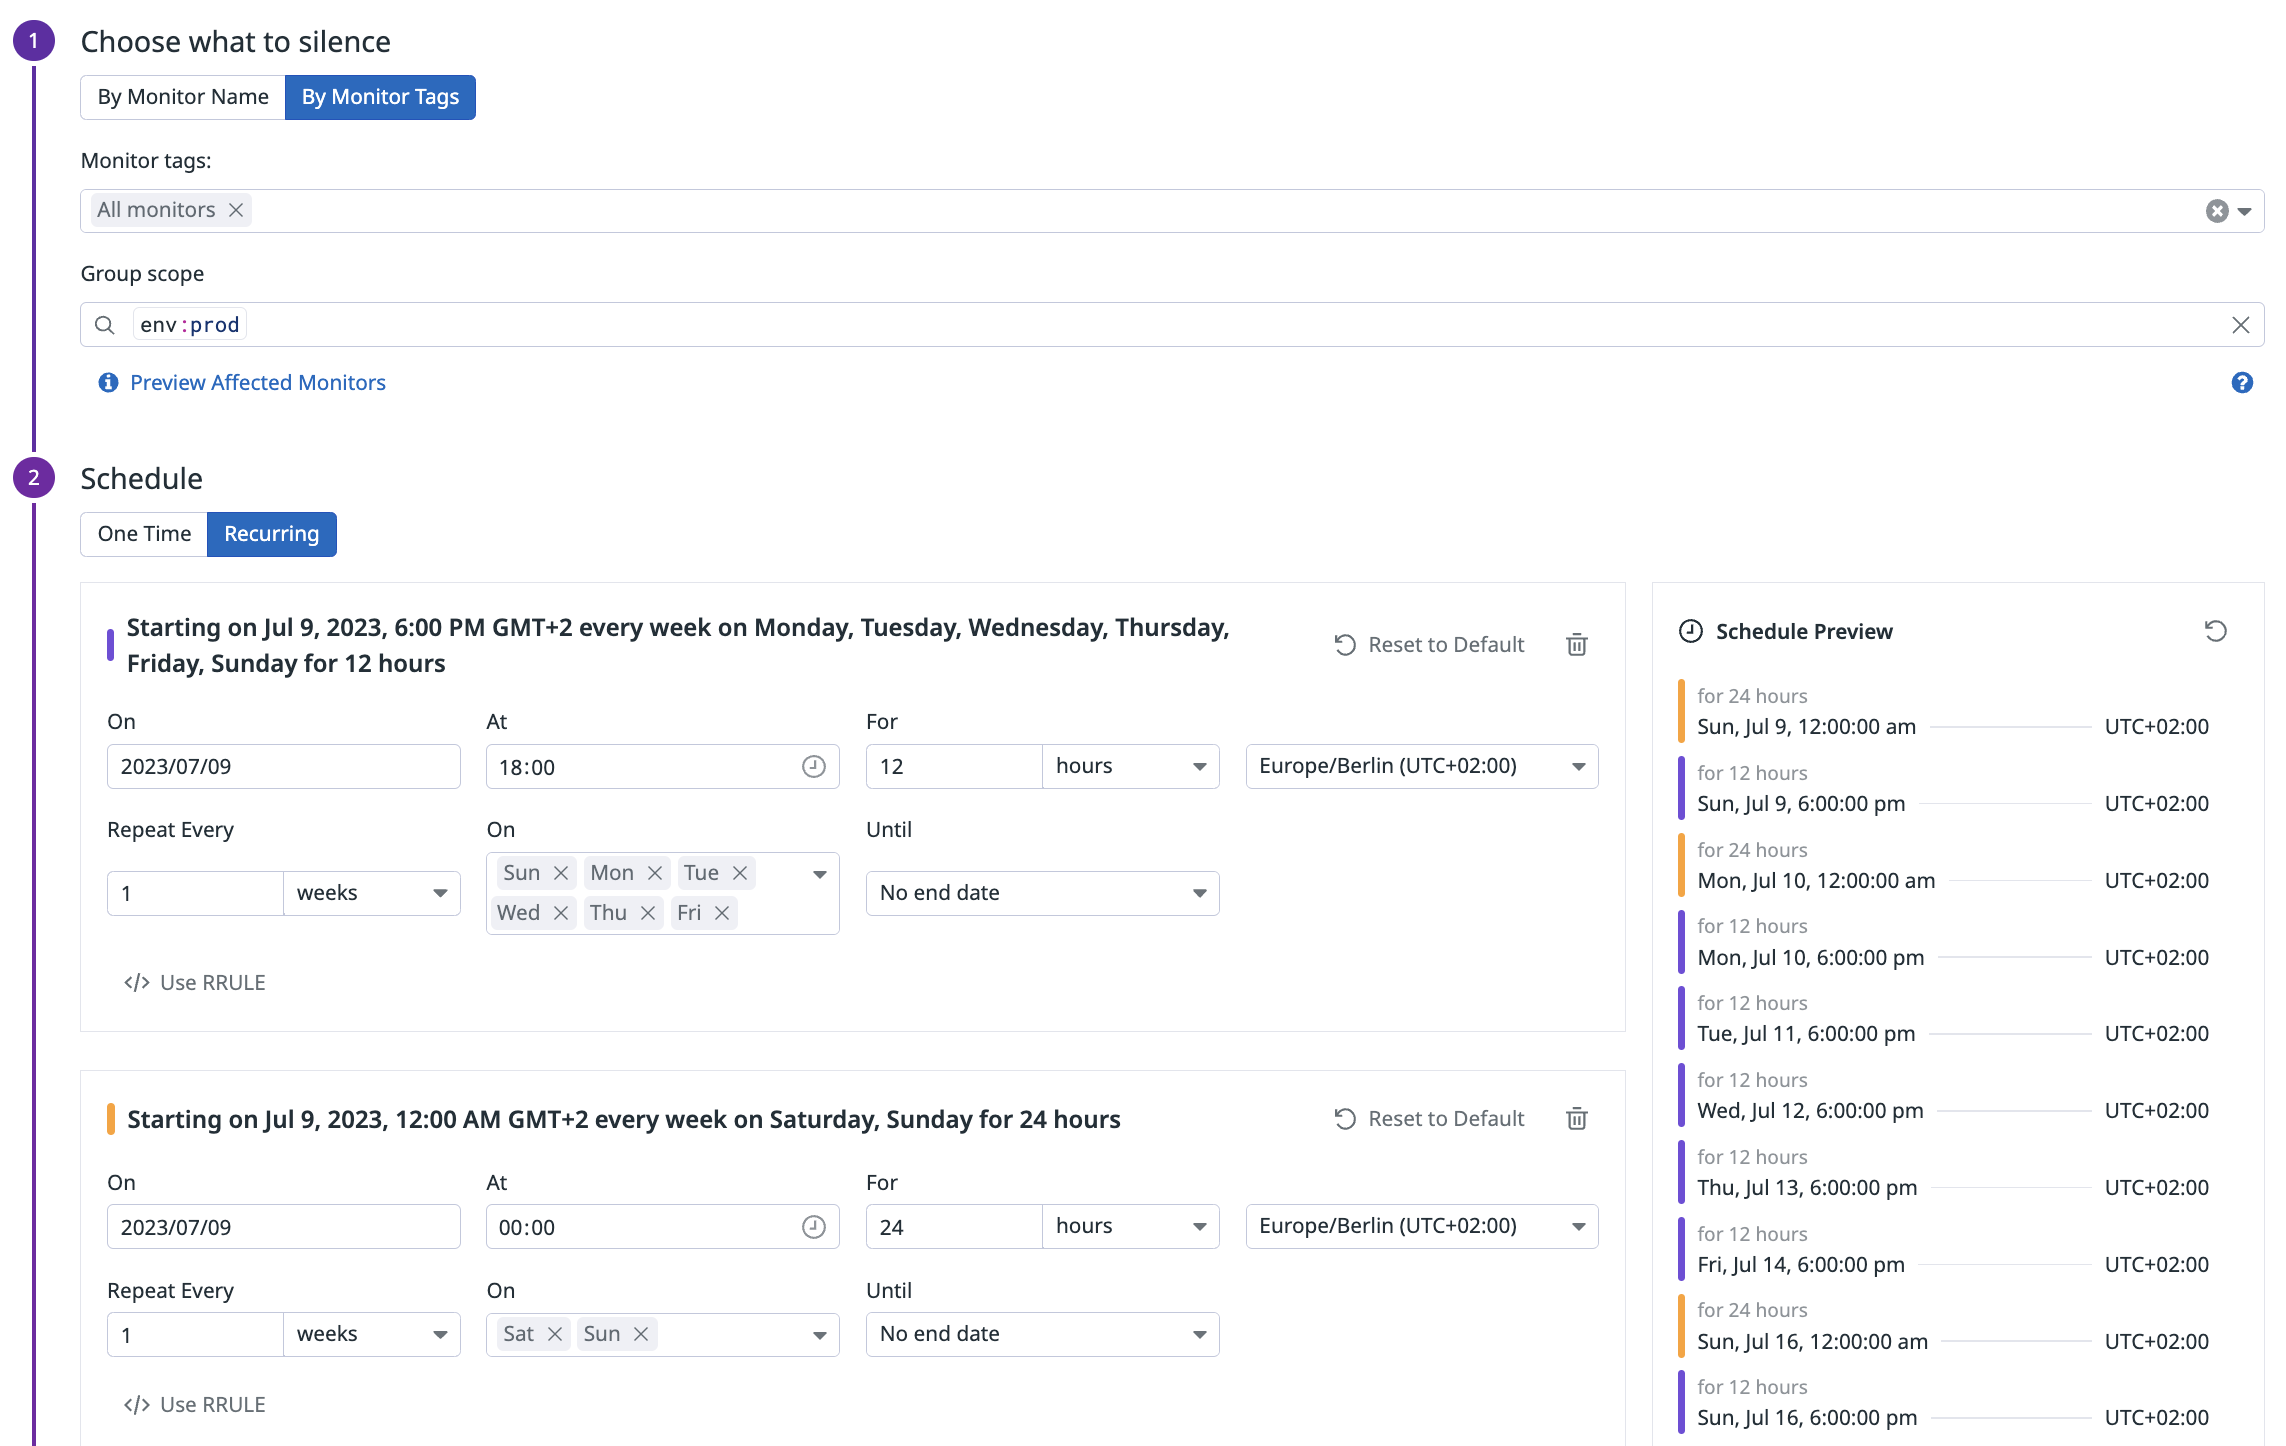
Schedule a downtime based on one or more monitor tags. The maximum number of tags that can be selected for a single downtime is 32. Each tag can be at most 256 characters long. Only monitors that have ALL selected tags are silenced. You can also select scopes for additional constraints.
Downtime scope
Use group scope to apply additional filters to your downtime and have more control over which monitors to mute. The group scope of a downtime is matched after the monitor specific target. If you target multiple monitors by using monitor tags, it finds monitors that are tagged before it matches the group scope.
For instance, you have a monitor that looks at the average latency of all your services. You are planning on running an upgrade on the web-store service and are anticipating slow requests and potential errors.
You would like to make sure that service:web-store related notifications are muted and other critical alerts for the remaining services are delivered as usual. Enter service:web-store in the Downtime’s group scope after selecting the monitor targets.
Note: this also works with groups that have multiple dimensions, for example service and host. Creating a Downtime on service:web-store would mute all groups that include said service, for example service:web-store,host:a or service:web-store,host:b.
Downtime scope syntax
The Downtime scope query follows the same common Search Syntax that many other products across the platform support. To include all groups in the scope of a Downtime, type * for the Group scope. Further examples of group scopes include:
| Downtime group scope | Explanation |
|---|---|
service:web-store | Mutes all notifications about the web-store service. |
service:web-store AND env:dev | Mutes all notifications about the web-store service running on the dev environment. |
env:(dev OR staging) | Mutes any notification related to either the dev or staging environment. |
service:web-store AND env:(dev OR staging) | Mutes any notification related to the web-store service running in either the dev or staging environment. |
host:authentication-* | Mutes any notification that relates to a host whose name is prefixed with authentication-. |
host:*-prod-cluster | Mutes any notification that relates to a host whose name is suffixed with -prod-cluster. |
host:*-prod-cluster | Mutes any notification that relates to a host whose name is suffixed with -prod-cluster. |
service:webstore AND -env:prod | Mutes any notification about the web-store service that is not running on the prod environment. |
Downtime scope limitations
There are a few limitations that are not supported which include:
- More than two levels of nesting, such as
team:app AND (service:auth OR (service:graphics-writer AND (env:prod OR (type:metric AND status:ok)))), are not supported. At most, Downtimes accept two levels of nesting. Use separate Downtimes instead to break down the logic. - Negation is only supported for key/value pairs and tags with
OR. For example,-key:valueand-key(A OR B). Scopes such as-service:(A AND B),service:(-A OR -B), or-service(A B)are not supported. - Top level ORs are not supported. For example,
service:A OR service:Bis valid, butservice:A OR host:Xdoes not work. AnORbetween two different top level tags requires two separate Downtimes. - Keyless tags, such as
prod AND service:(A or B)or justprod, aren’t supported. Tags need to have a key, in this case for exampleenv:prod. - Question mark wildcards:
service:auth?are not supported. Use*instead if you need to use wildcards. - Invalid characters within the key:
en&v:prodis not a valid Downtime scope and will be rejected.
Set a downtime schedule
One Time
Set a one time downtime by entering the start date, time, and time zone. Optionally, set an end date and time.
Recurring
Recurring downtimes are useful for recurring maintenance windows. Set a recurring downtime by entering the start date, time, time zone, repeat, and duration. Optionally, specify an end date or number of occurrences.
When a single downtime of a recurring downtime ends, the single downtime is cancelled and a new downtime is created with the same constraints and updated start and end times.
Note: The original creator is associated with all the newly created downtimes.
Use recurrence rules (RRULEs) to define downtimes schedules. Use the official RRULE generator as a tool to generate recurring rules. A common use case is to use RRULES to define downtimes on specific days of the month, for example, on the third Monday of each month. For more use cases on recurrence, see the guide to Suppress alerts with Downtimes.
Note: Attributes specifying the duration in RRULE are not supported (for example, DTSTART, DTEND, DURATION).
Notifications
Add a message
Enter a message to alert your team about this downtime. The message field allows standard markdown formatting and Datadog’s @-notification syntax. See the Notifications page for more information on formatting options.
Configure notifications and automations
Configure notifications and automations by specifying team members or sending the message to a service integration. Datadog sends notifications to the specified destinations whenever the downtime is scheduled, started, cancelled, or expired. These audit notifications allows your team to be aware of the downtimes in your system.
Disable first recovery notification
By default, Datadog sends a recovery notification for monitors that trigger before a downtime and end up recovering during a downtime. This is useful when using third party integrations to automatically close opened incidents. Selecting the checkbox mutes these notifications.
The option to disable the first recovery notification is additive between multiple downtimes. For example, if multiple downtimes overlap and mute the same monitor, the first recovery notification is muted if at least one downtime checked the option to disable it.
Note: This option mutes the first recovery notification. If a monitor proceeds to trigger and recover again during a downtime, then the corresponding notifications are always muted, regardless of this option’s settings.
Manage
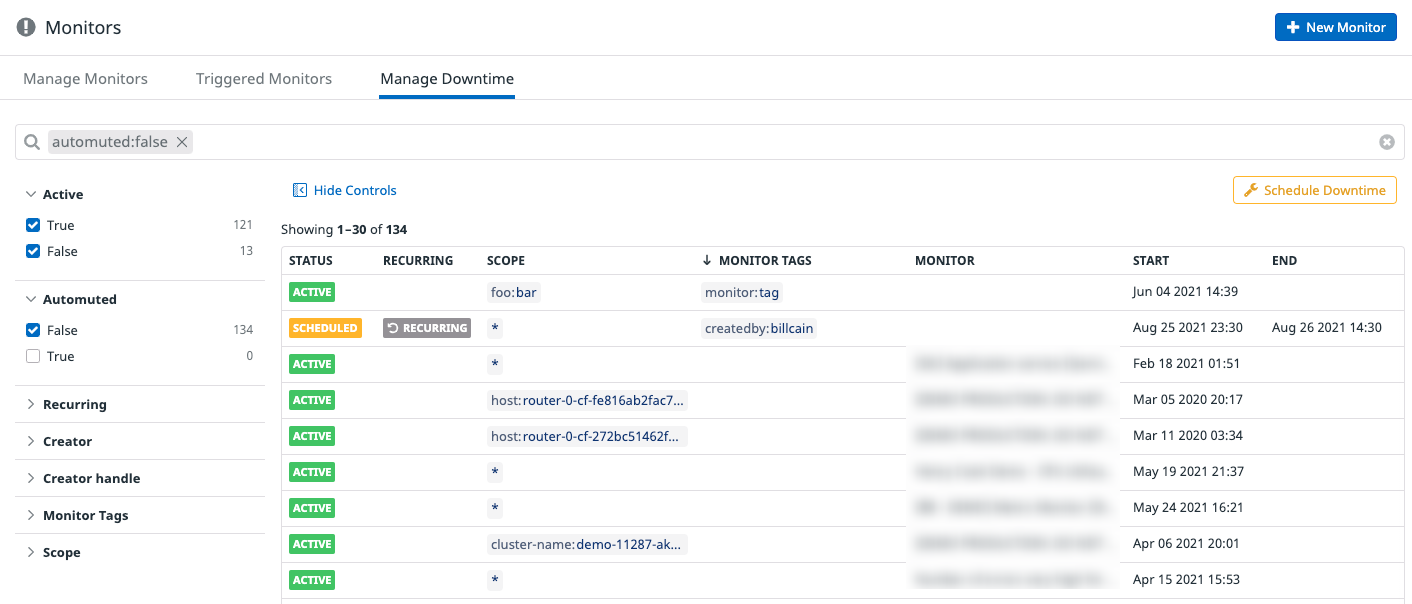
The Manage Downtimes page displays the list of active and scheduled downtimes. Select a downtime to view details, edit, or delete it. Details include its creator, its scope, and a list of the monitors it applies to.
Use the facets panel and the search bar to filter the list on the Creator, the Scope, Monitor Tags, or Active, Automuted, Recurring parameters.
History
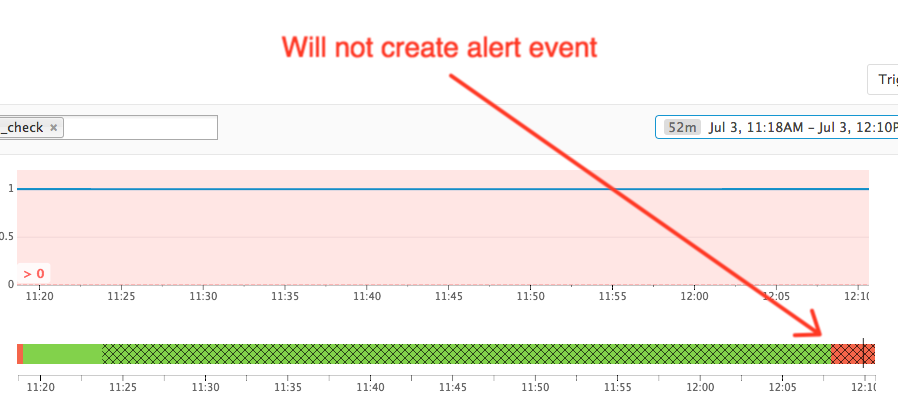
Downtime history is viewable on the Monitor Status page as overlaid on the group transition history, and the Events explorer by searching for tags:audit downtime, or a specific downtime by ID with tags:audit downtime_id:<DOWNTIME_ID>.
Muting
Monitors trigger events when they change between possible states: ALERT, WARNING, RESOLVED, and NO DATA. When a monitor is muted or has a scheduled downtime, transitions from RESOLVED to another state do not trigger events or notifications.
Note: Muting or un-muting a monitor from the monitor status page does not delete scheduled downtimes associated with the monitor. To edit or delete a downtime, use the Manage Downtimes page or the API.
Expiration
By default, if a monitor is in an alert-worthy state (ALERT, WARNING, or NO DATA) when a downtime expires, the monitor triggers a new notification. This applies to monitors that change state during downtime (such as from OK to ALERT, WARNING, or NO DATA), and to monitors that already have an alert-worthy state when downtime begins. If a downtime is manually canceled, notifications are not sent, even if the monitor has entered an alert-worthy state.
To override the default behavior, specify which notifications should be sent at the end of downtimes with the options in the Configure notifications and automations section. For downtimes created with the API, the default behavior is to exclude the Is cancelled option.
Example 1: If a monitor is in an alert state before downtime starts and continues for the duration of downtime:
- During downtime, notifications for this alert are suppressed.
- The monitor remains in an alert state (because the conditions are still met).
- The downtime ends.
- The alert conditions are still met, so a notification is sent.
Example 2: If a monitor is in an alert state before a downtime commences and recovers during that downtime:
- The state transitions from
ALERTtoOK. - The recovery notification is sent during the downtime, but only for the first recovery during that downtime.
Monitor report
All alerted states are included on the weekly monitor report even if the monitor is in a downtime.
Auto-muting
Datadog can proactively mute monitors related to the manual shutdown of certain cloud workloads. The following scenarios of auto-muting for shutdown are supported:
- Amazon EC2 instances and instance termination by AWS autoscaling based on host statuses from the CloudWatch API.
- Google Compute Engine (GCE) instances and instance termination triggered by GCE autoscaling based on host statuses from the GCE API.
- Azure VMs, whether the shutdown was triggered manually or by Azure autoscaling, based on health statuses available through the Azure Resource Health API.
Further Reading
Additional helpful documentation, links, and articles:


