- 重要な情報
- はじめに
- Datadog
- Datadog サイト
- DevSecOps
- AWS Lambda のサーバーレス
- エージェント
- インテグレーション
- コンテナ
- ダッシュボード
- アラート設定
- ログ管理
- トレーシング
- プロファイラー
- タグ
- API
- Service Catalog
- Session Replay
- Continuous Testing
- Synthetic モニタリング
- Incident Management
- Database Monitoring
- Cloud Security Management
- Cloud SIEM
- Application Security Management
- Workflow Automation
- CI Visibility
- Test Visibility
- Intelligent Test Runner
- Code Analysis
- Learning Center
- Support
- 用語集
- Standard Attributes
- ガイド
- インテグレーション
- エージェント
- OpenTelemetry
- 開発者
- 認可
- DogStatsD
- カスタムチェック
- インテグレーション
- Create an Agent-based Integration
- Create an API Integration
- Create a Log Pipeline
- Integration Assets Reference
- Build a Marketplace Offering
- Create a Tile
- Create an Integration Dashboard
- Create a Recommended Monitor
- Create a Cloud SIEM Detection Rule
- OAuth for Integrations
- Install Agent Integration Developer Tool
- サービスのチェック
- IDE インテグレーション
- コミュニティ
- ガイド
- API
- モバイルアプリケーション
- CoScreen
- Cloudcraft
- アプリ内
- Service Management
- インフラストラクチャー
- アプリケーションパフォーマンス
- APM
- Continuous Profiler
- データベース モニタリング
- Data Streams Monitoring
- Data Jobs Monitoring
- Digital Experience
- Software Delivery
- CI Visibility (CI/CDの可視化)
- CD Visibility
- Test Visibility
- Intelligent Test Runner
- Code Analysis
- Quality Gates
- DORA Metrics
- セキュリティ
- セキュリティの概要
- Cloud SIEM
- クラウド セキュリティ マネジメント
- Application Security Management
- AI Observability
- ログ管理
- Observability Pipelines(観測データの制御)
- ログ管理
- 管理
リソースステータス画面
リソースは、特定のサービス(通常は個々のエンドポイントまたはクエリ)に対する特定のアクションです。リソースの詳細については、APM を開始するをご覧ください。リソースごとに、APM は以下をカバーするダッシュボードページを自動的に生成します。
- 主要なヘルスメトリクス
- このサービスに関連付けられているすべてのモニターのモニターステータス
- このサービスに関連付けられているすべてのリソースのメトリクスのリスト
すぐに使えるグラフ
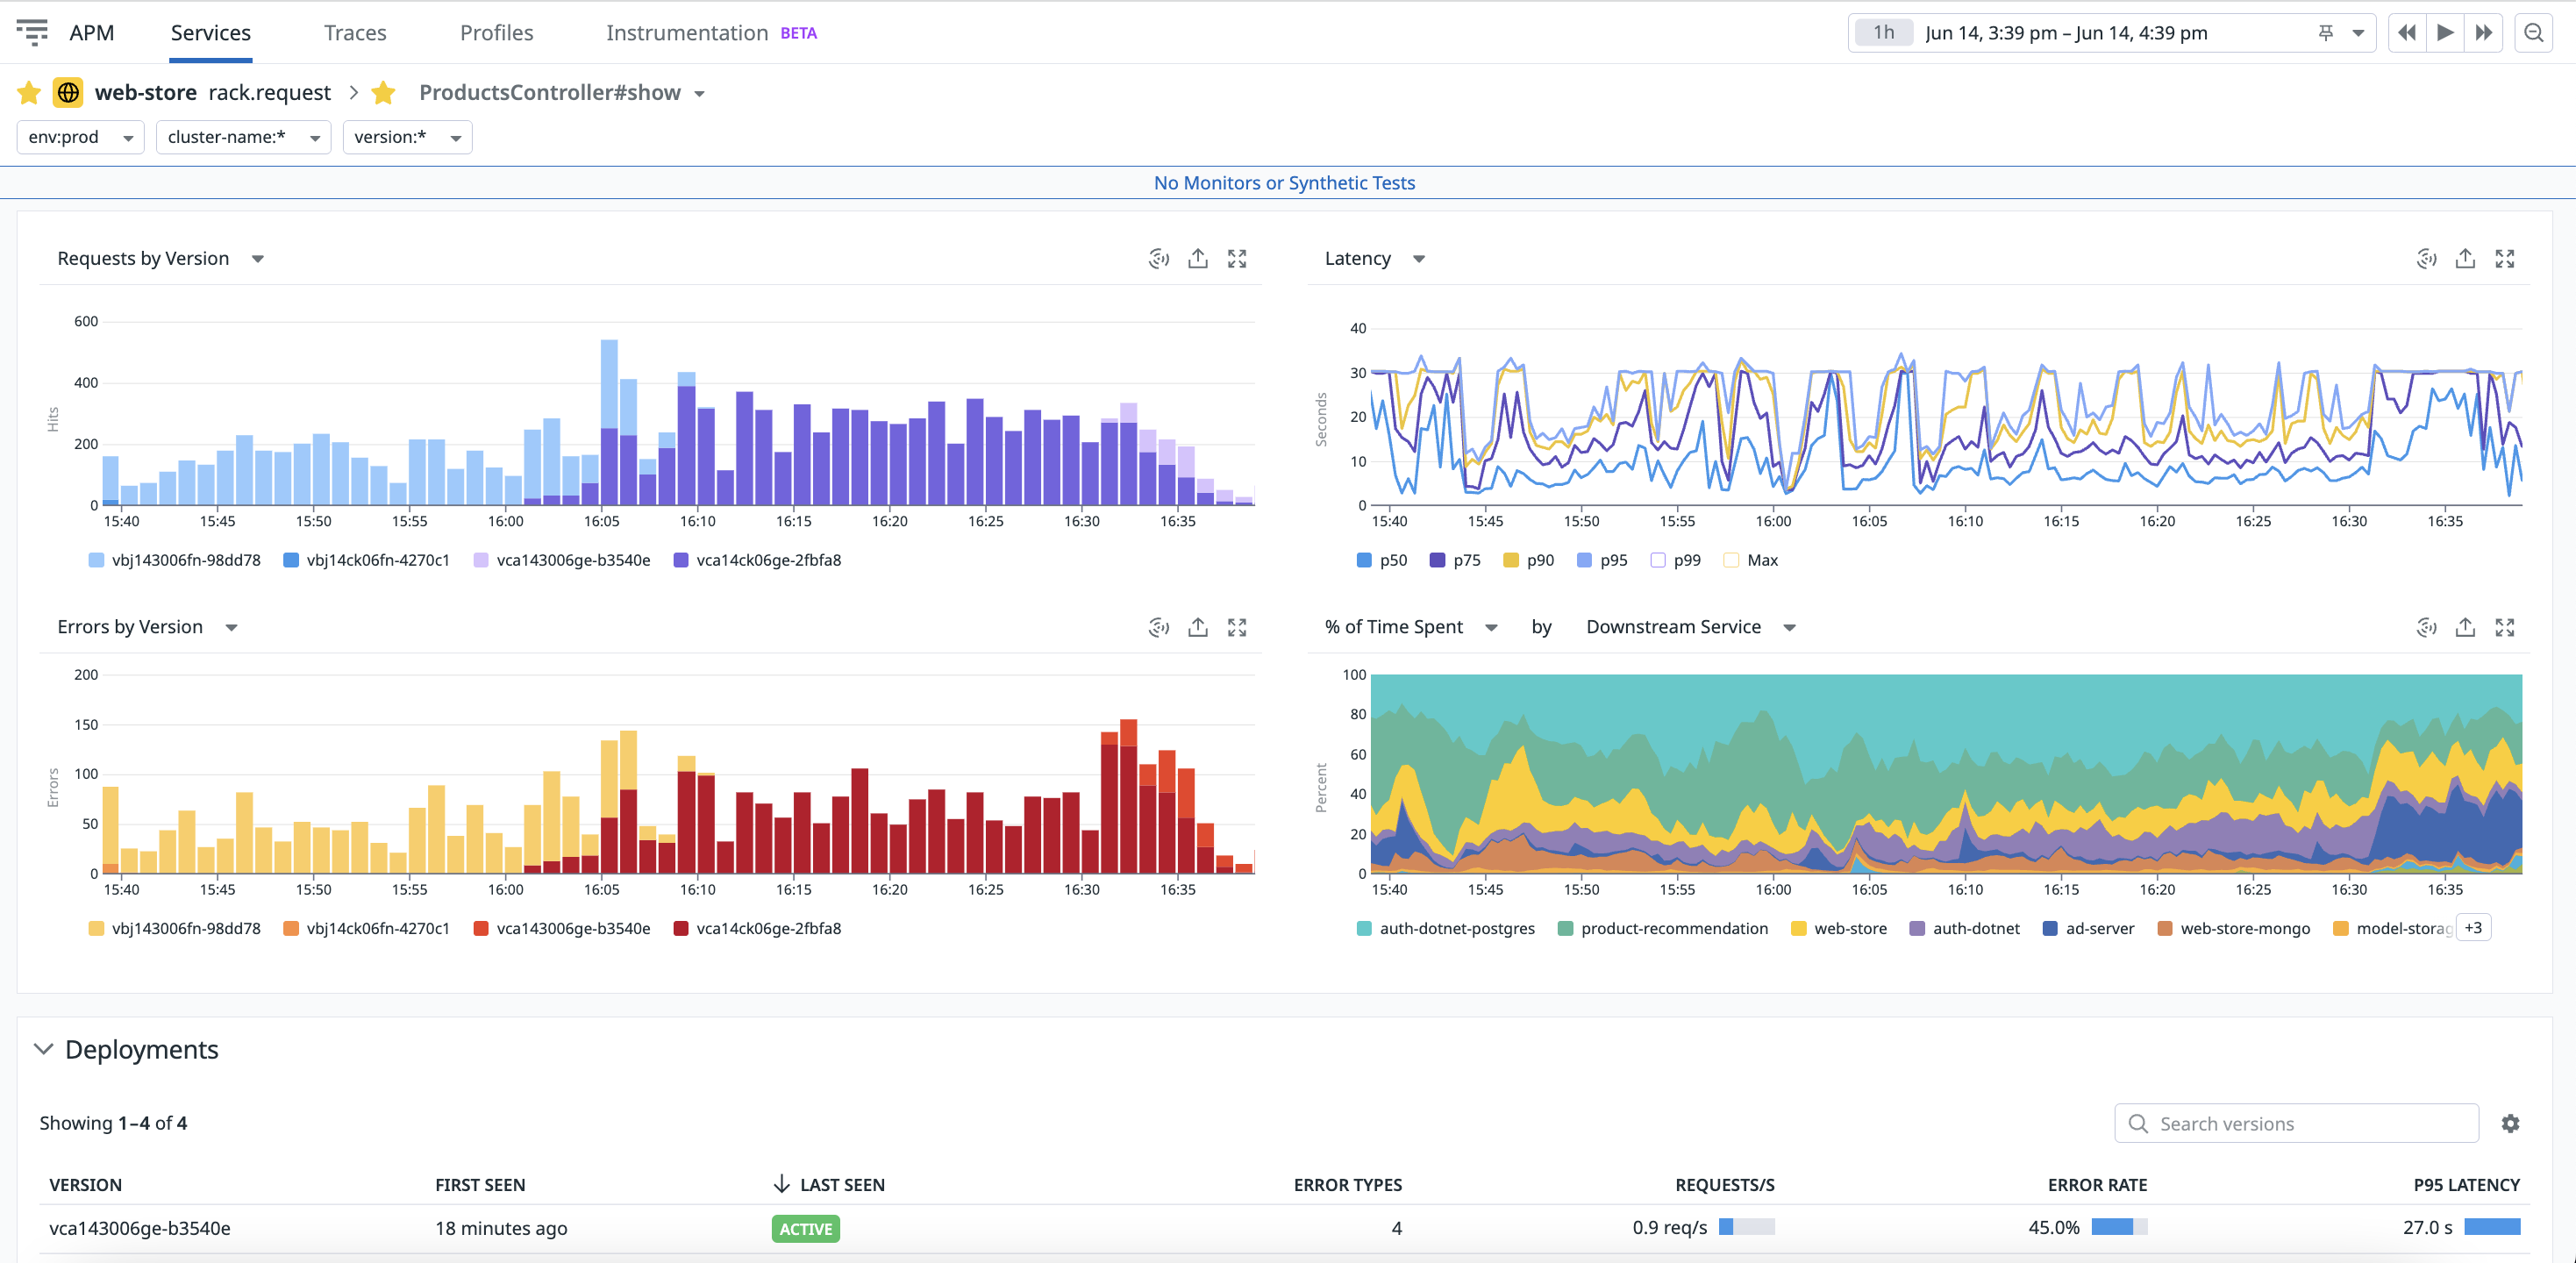
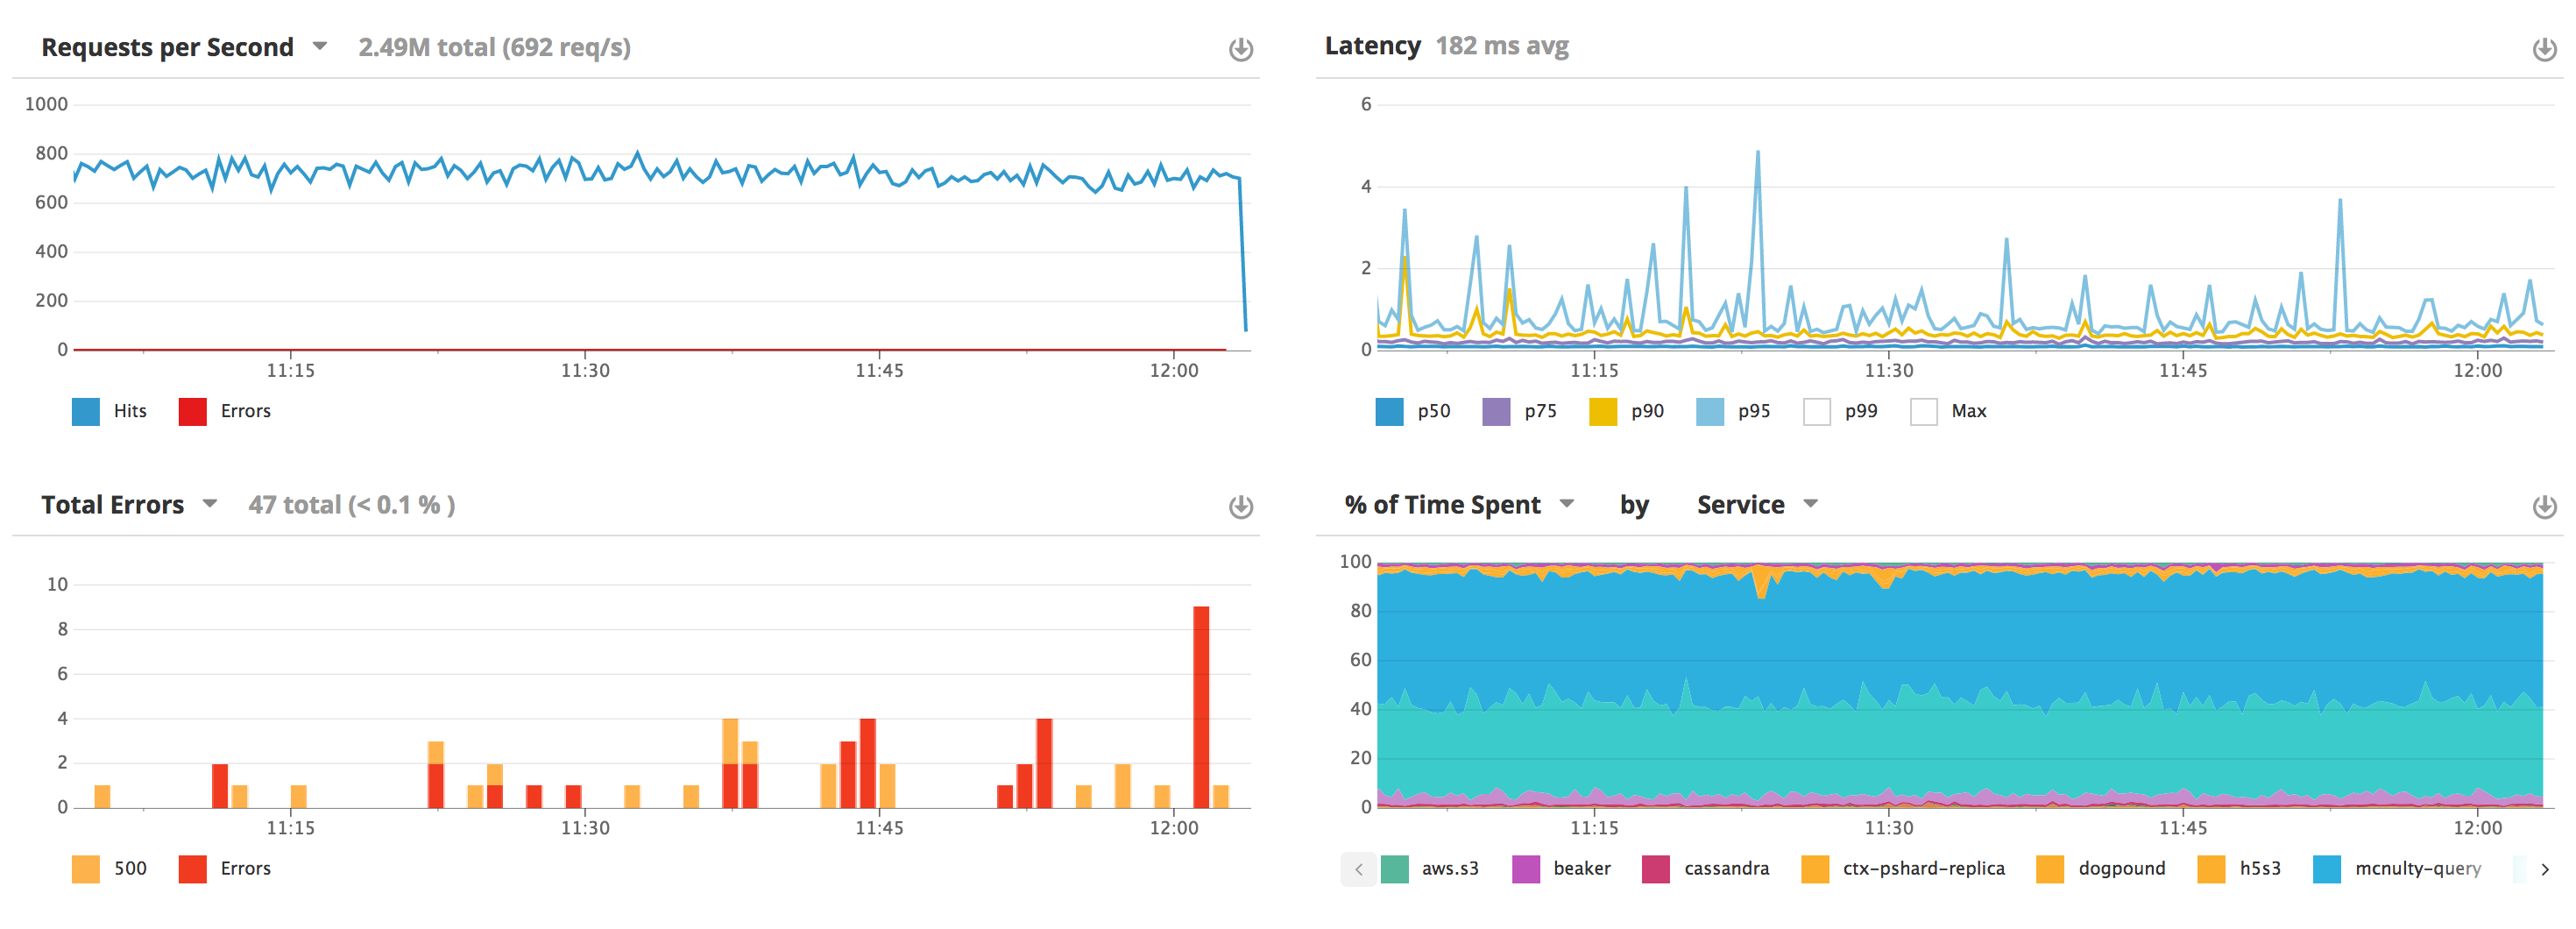
Datadog provides out-of-the-box graphs for any given resource. Use the dropdown above each graph to change the displayed information.
Requests and Errors
The Requests and Errors graph displays the total number of requests (hits) and errors over time. Using the dropdown menu, you can also view:
- Requests by Version: Breakdown of requests across different service versions.
- Requests per Second by Version: The rate of requests for each version.
- Requests and Errors Per Second: The rate of requests (hits) and errors per second.
Errors
The Errors graph displays the total count of errors over time. Using the dropdown menu, you can also view:
- Errors by Version: The error counts for each service version side by side.
- Errors per Second by Version: The error rate (errors per second) for each service version over time.
- Errors per Second: The overall error rate for the service, per second.
- % Error Rate by Version: The percentage of requests resulting in errors for each service version.
- % Error Rate: The overall error rate for the service, as a percentage.
Latency
The Latency graph displays the latency percentiles as a timeseries. Using the dropdown menu, you can also view:
- Latency by Version: Latency broken down by service version.
- Historical Latency: Comparison of the current latency distribution with the previous day and week.
- Latency Distribution: The distribution of latencies over the selected time frame.
- Latency by Error: The latency of requests over time, segmented by whether the requests resulted in errors.
- Apdex (Application Performance Index): The Apdex score over time.
Avg Time per Request
For services involving multiple downstream services, a fourth graph breaks down the average execution time spent per request. This graph is built on sampled trace data, unlike the other top graphs which use unsampled data sources.
Using the dropdown menu, you can also view:
- Total Time Spent: The cumulative time spent in each downstream service over time.
- % of Time Spent: The percentage of time spent in each downstream service relative to the total time.
For services like Postgres or Redis, which are final operations that do not call other services, there is no sub-services graph. Watchdog performs automatic anomaly detection on the Requests, Latency, and Error graphs. If an anomaly is detected, an overlay appears on the graph. Clicking the Watchdog icon provides more details in a side panel.
ダッシュボードへのエクスポート
グラフを既存のダッシュボードにエクスポートするには、各グラフの右上隅にある上向き矢印をクリックします。
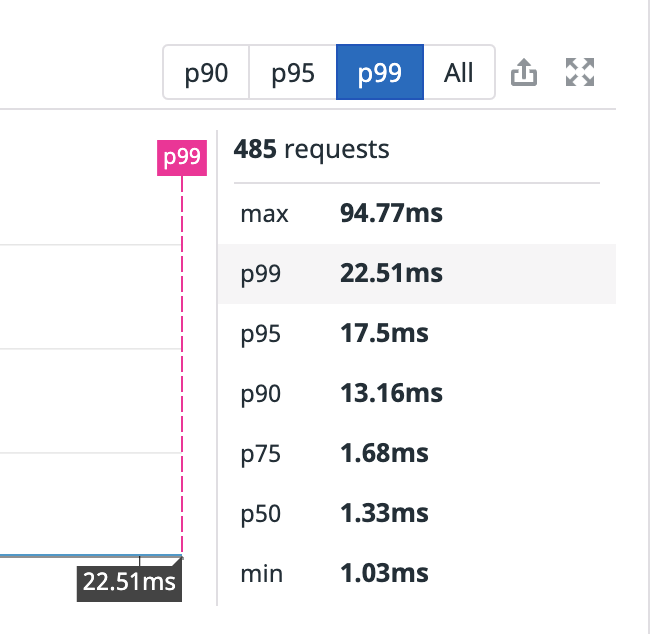
レイテンシー分布
リソースステータス画面にも、リソースレイテンシー分布グラフが表示されます。
右上のセレクターを使用して特定のパーセンタイルを拡大するか、サイドバーにカーソルを合わせてパーセンタイルマーカーを表示します。
ナビゲーター付き依存関係マップ
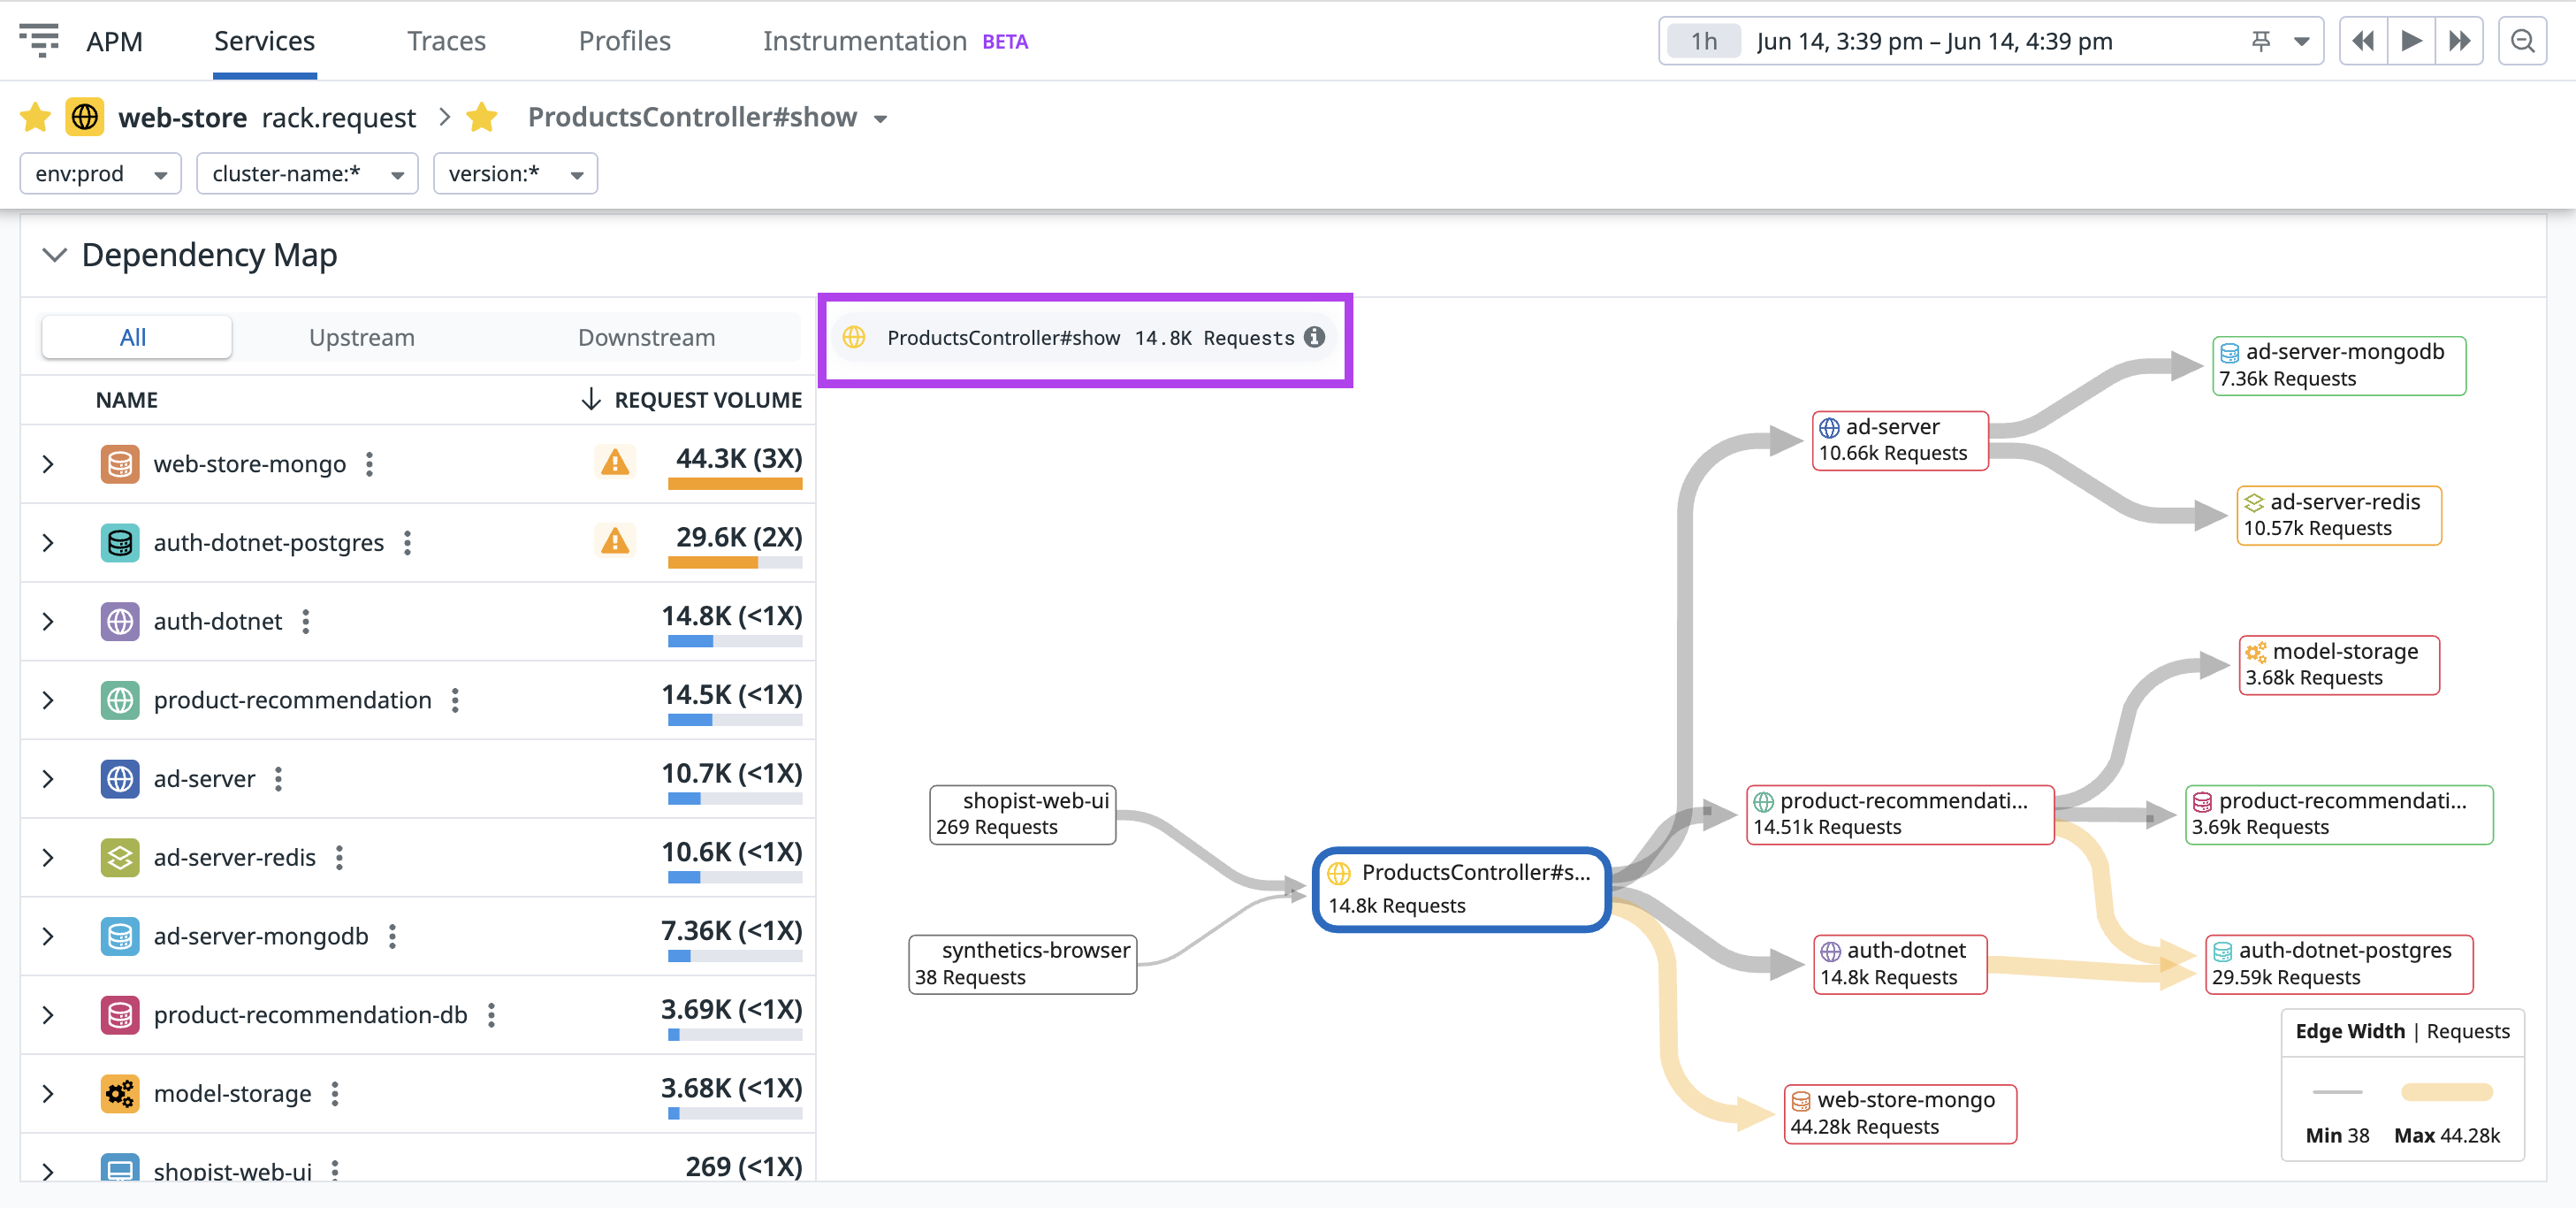
You can also view a map of all of a resource’s upstream and downstream service dependencies. With the Dependency Map Navigator, you can see the flow of services, with spans that go through a specific resource (endpoint, database query, etc.) end-to-end, along with their request counts.
This map is based on a sample of ingested spans; the sample is drawn by a fixed sampling algorithm that considers the structure of traces. The sampling algorithm is not configurable and is not impacted by ingestion control.
依存関係マップは、サービスエントリースパンを含むリソースにのみ利用可能です。
ノードにカーソルを合わせると、リクエスト/秒、エラー率、平均レイテンシーなど、各サービスのメトリクスを表示します。ノードをクリックすると、コンテキストメニューが表示され、サービスページや関連するトレースなどを表示することができます。
ノードのハイライト色は、そのサービスのモニターステータスを示しています。サービスに複数のモニターが構成されている場合、最も厳しいモニターのステータスが表示されます。
負荷増幅
選択したリソースのアップストリームで受信したリクエストの 100% 以上を受信している場合、サービスには負荷増幅があります。コールパスがオレンジ色でハイライトされているサービスには負荷増幅があり、増幅倍率はパネル上のリストに表示されます。増幅は、リソースが受信したリクエスト (下のイメージで地図上にハイライト表示) と、ダウンストリームサービスが受信したリクエスト (地図上のダウンストリームサービスノード内に表示) に基づいて計算されます。リスト内のサービスをクリックすると、増幅に寄与しているスパンを確認することができます。
スパンサマリー
特定のリソースについて、Datadog は一致するすべてのトレースのスパン分析内訳を提供します。
表示されるメトリクスは、スパンごとに次を表します。
Avg Spans/trace- スパンが少なくとも 1 回存在する、現在のリソースを含むトレースのスパンの平均発生回数。
% of Traces- スパンが少なくとも 1 回存在する現在のリソースを含むトレースの割合。
Avg Duration- スパンが少なくとも 1 回存在する、現在のリソースを含むトレースのスパンの平均期間。
Avg % Exec Time- スパンが少なくとも 1 回存在する、現在のリソースを含むトレースについて、スパンがアクティブだった実行時間の平均比率。
注: スパンは、子スパンの完了を待機していないときにアクティブと見なされます。特定のトレースの特定の時間にアクティブなスパンは、すべてリーフスパン(つまり、子のないスパン)です。
スパンサマリーテーブルは、サービスエントリースパンを含むリソースにのみ利用可能です。
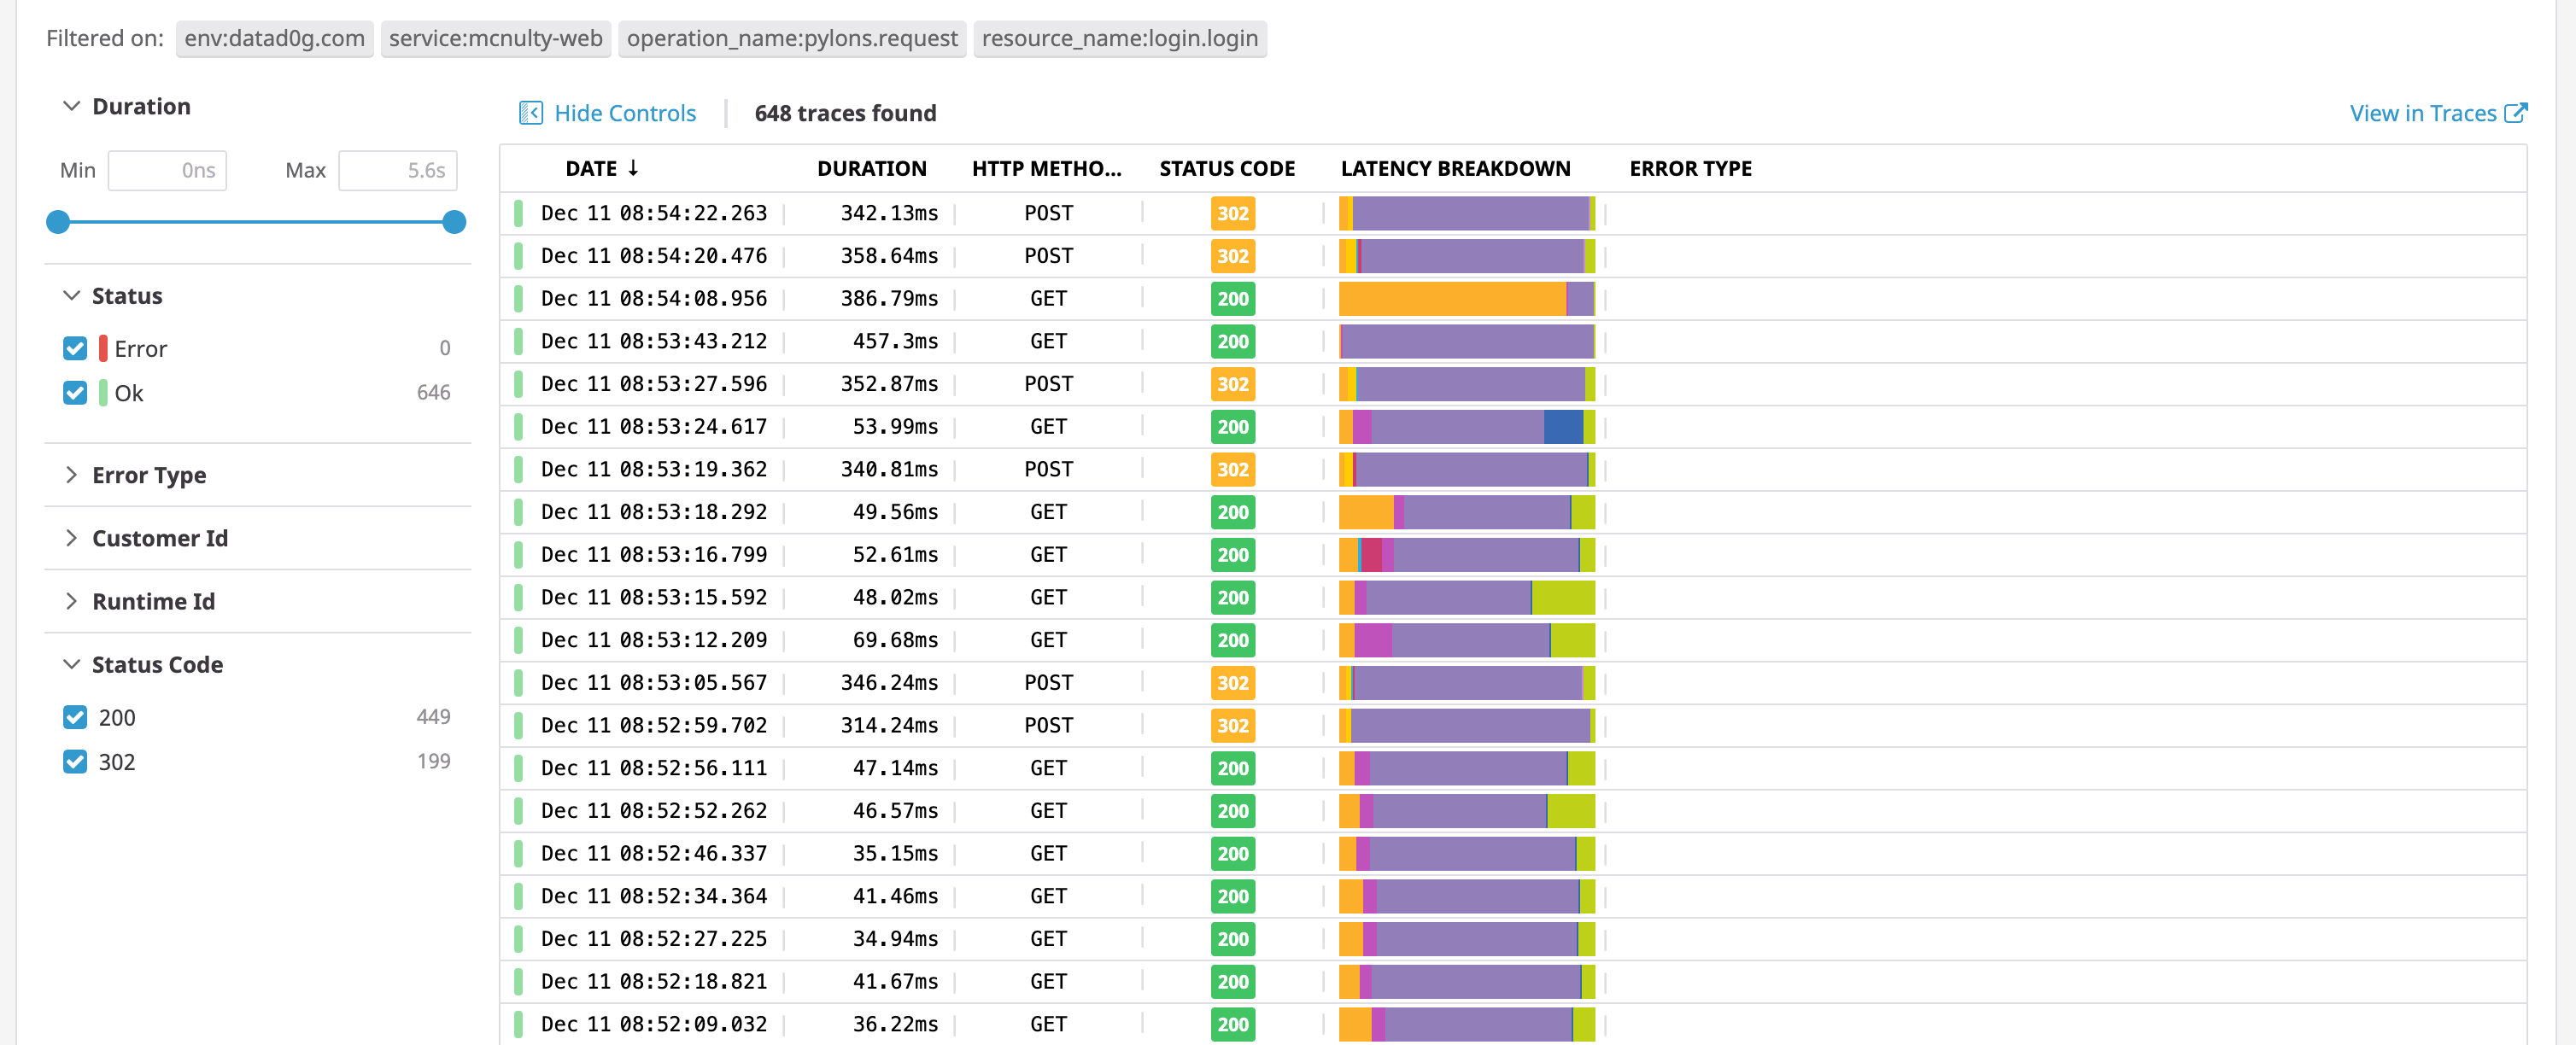
トレース
環境、サービス、オペレーション、およびリソース名で既にフィルタリングされているトレース検索モーダルで、このリソースに関連付けられているトレースのリストを参照してください。
