- 重要な情報
- はじめに
- Datadog
- Datadog サイト
- DevSecOps
- AWS Lambda のサーバーレス
- エージェント
- インテグレーション
- コンテナ
- ダッシュボード
- アラート設定
- ログ管理
- トレーシング
- プロファイラー
- タグ
- API
- Service Catalog
- Session Replay
- Continuous Testing
- Synthetic モニタリング
- Incident Management
- Database Monitoring
- Cloud Security Management
- Cloud SIEM
- Application Security Management
- Workflow Automation
- CI Visibility
- Test Visibility
- Intelligent Test Runner
- Code Analysis
- Learning Center
- Support
- 用語集
- Standard Attributes
- ガイド
- インテグレーション
- エージェント
- OpenTelemetry
- 開発者
- 認可
- DogStatsD
- カスタムチェック
- インテグレーション
- Create an Agent-based Integration
- Create an API Integration
- Create a Log Pipeline
- Integration Assets Reference
- Build a Marketplace Offering
- Create a Tile
- Create an Integration Dashboard
- Create a Recommended Monitor
- Create a Cloud SIEM Detection Rule
- OAuth for Integrations
- Install Agent Integration Developer Tool
- サービスのチェック
- IDE インテグレーション
- コミュニティ
- ガイド
- API
- モバイルアプリケーション
- CoScreen
- Cloudcraft
- アプリ内
- Service Management
- インフラストラクチャー
- アプリケーションパフォーマンス
- APM
- Continuous Profiler
- データベース モニタリング
- Data Streams Monitoring
- Data Jobs Monitoring
- Digital Experience
- Software Delivery
- CI Visibility (CI/CDの可視化)
- CD Visibility
- Test Visibility
- Intelligent Test Runner
- Code Analysis
- Quality Gates
- DORA Metrics
- セキュリティ
- セキュリティの概要
- Cloud SIEM
- クラウド セキュリティ マネジメント
- Application Security Management
- AI Observability
- ログ管理
- Observability Pipelines(観測データの制御)
- ログ管理
- 管理
Exploring Database Hosts
このページは日本語には対応しておりません。随時翻訳に取り組んでいます。翻訳に関してご質問やご意見ございましたら、お気軽にご連絡ください。
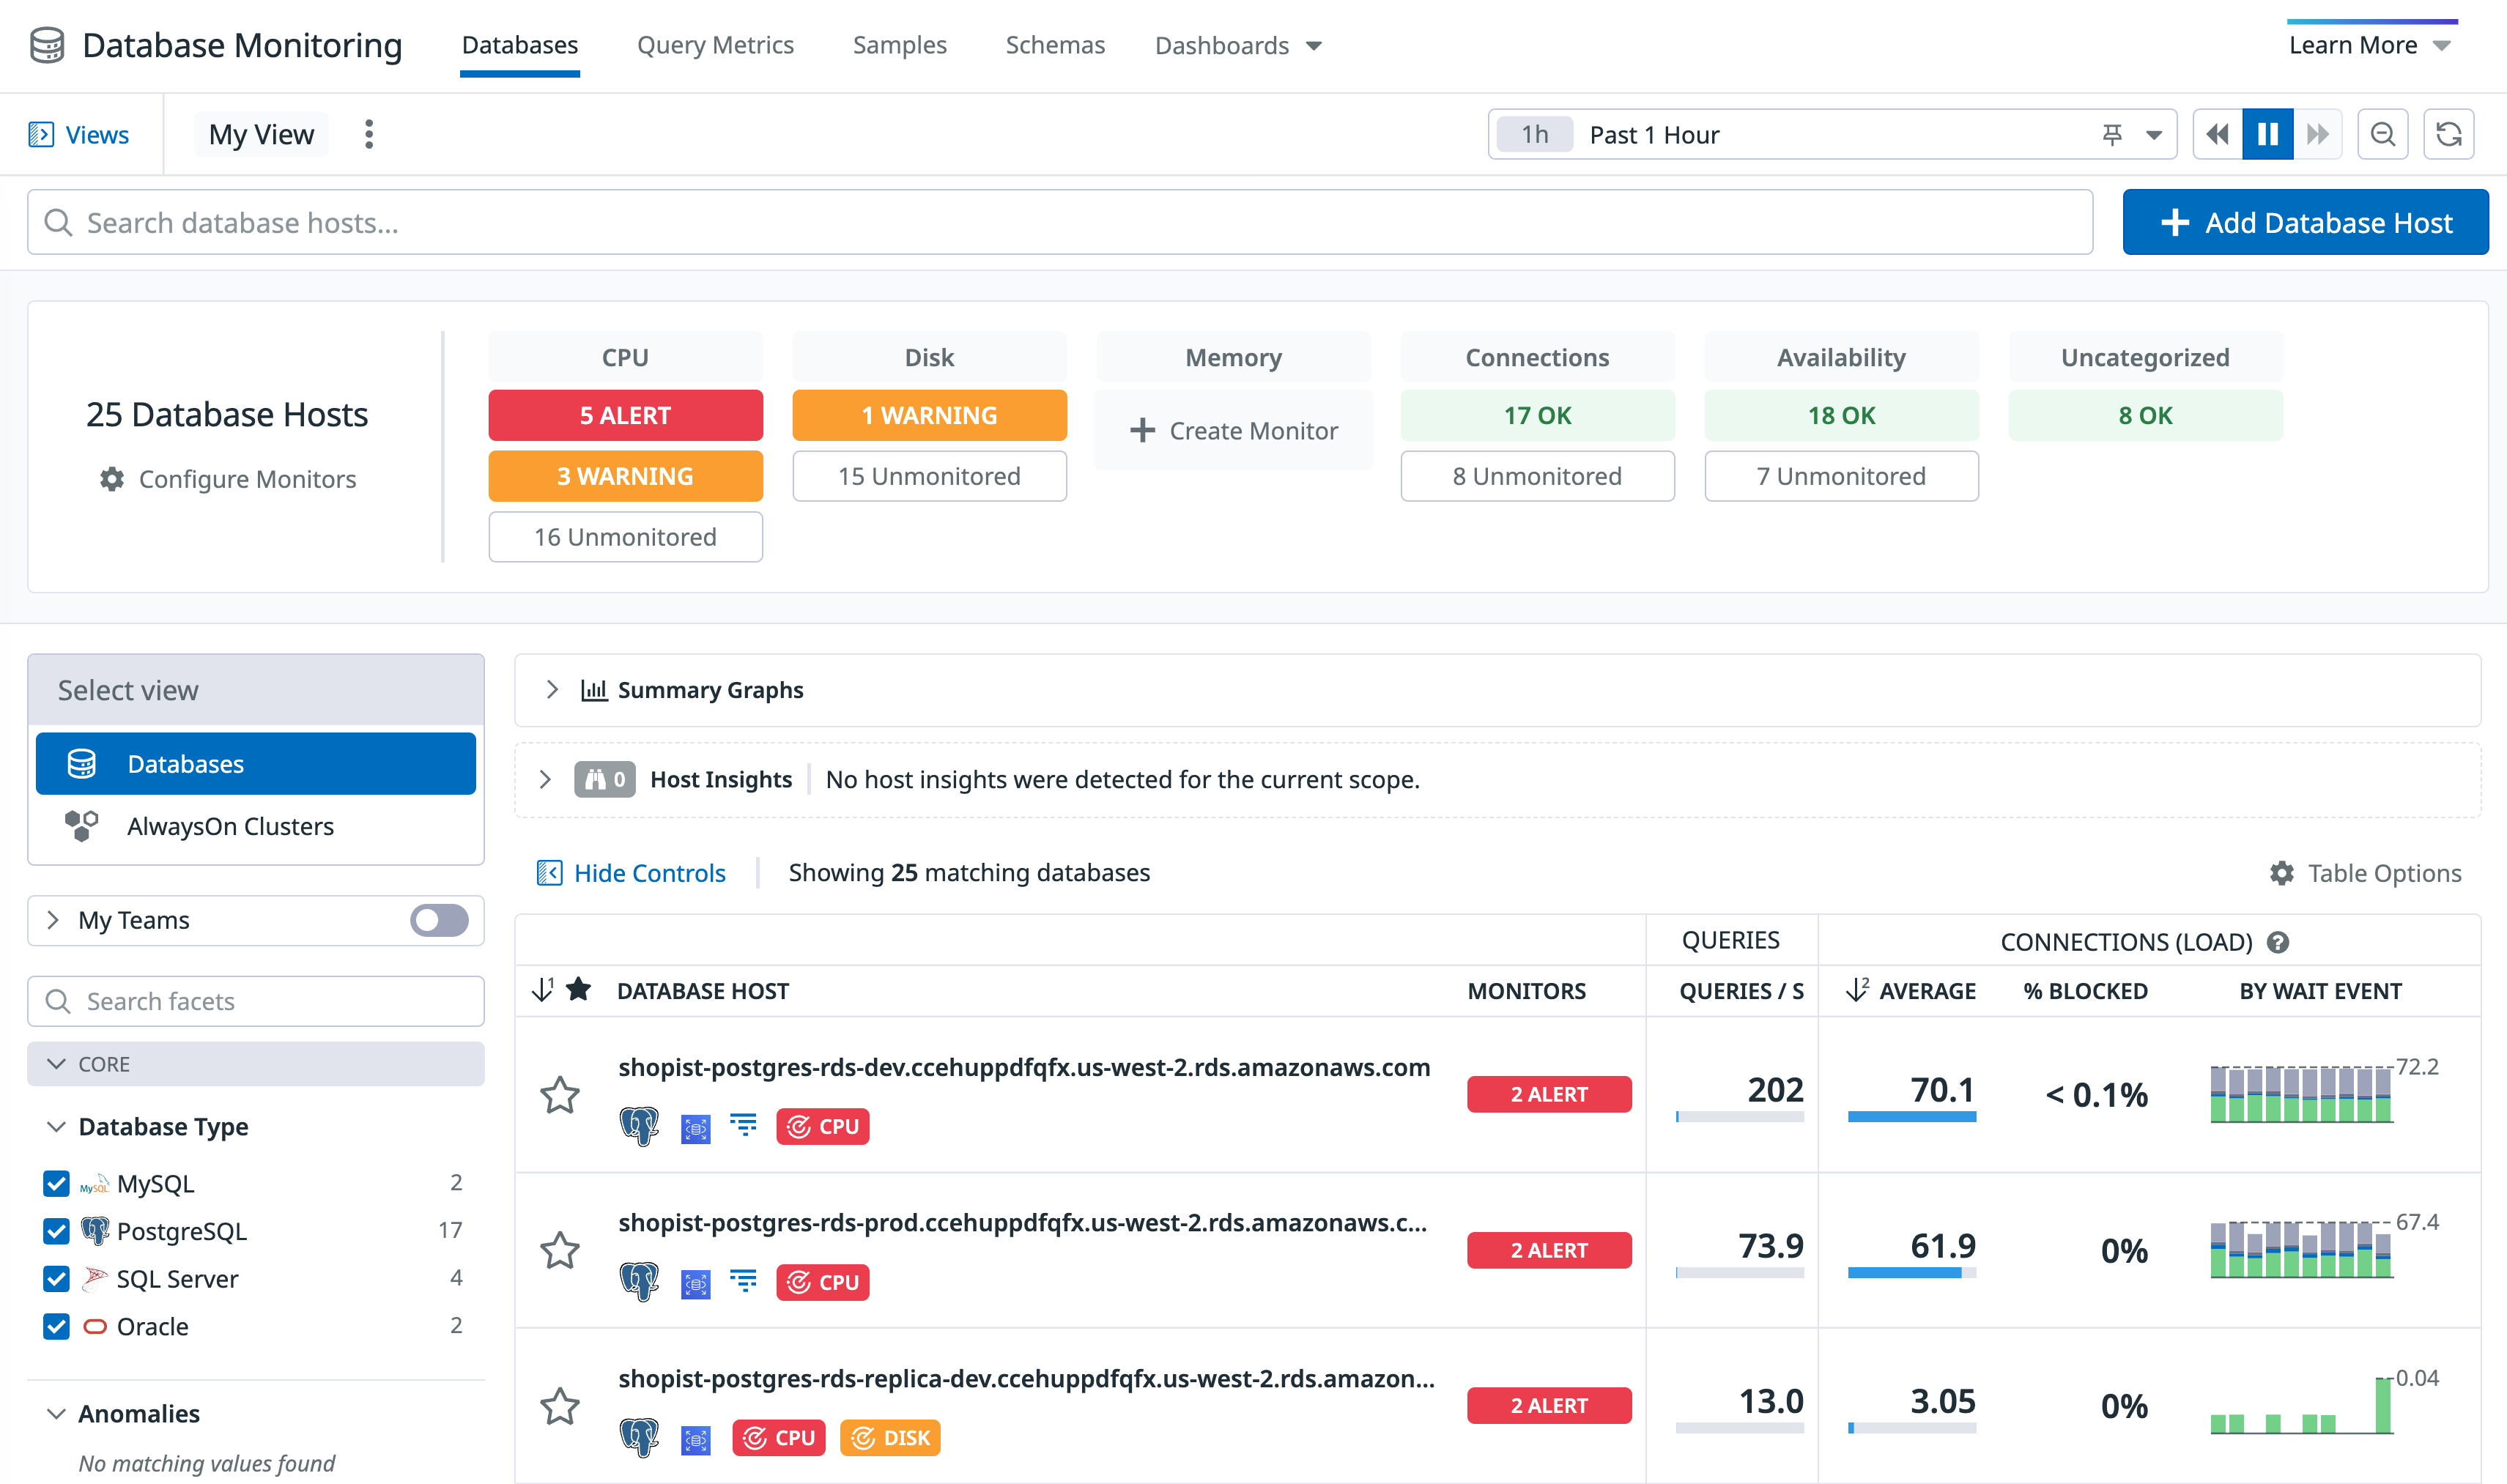
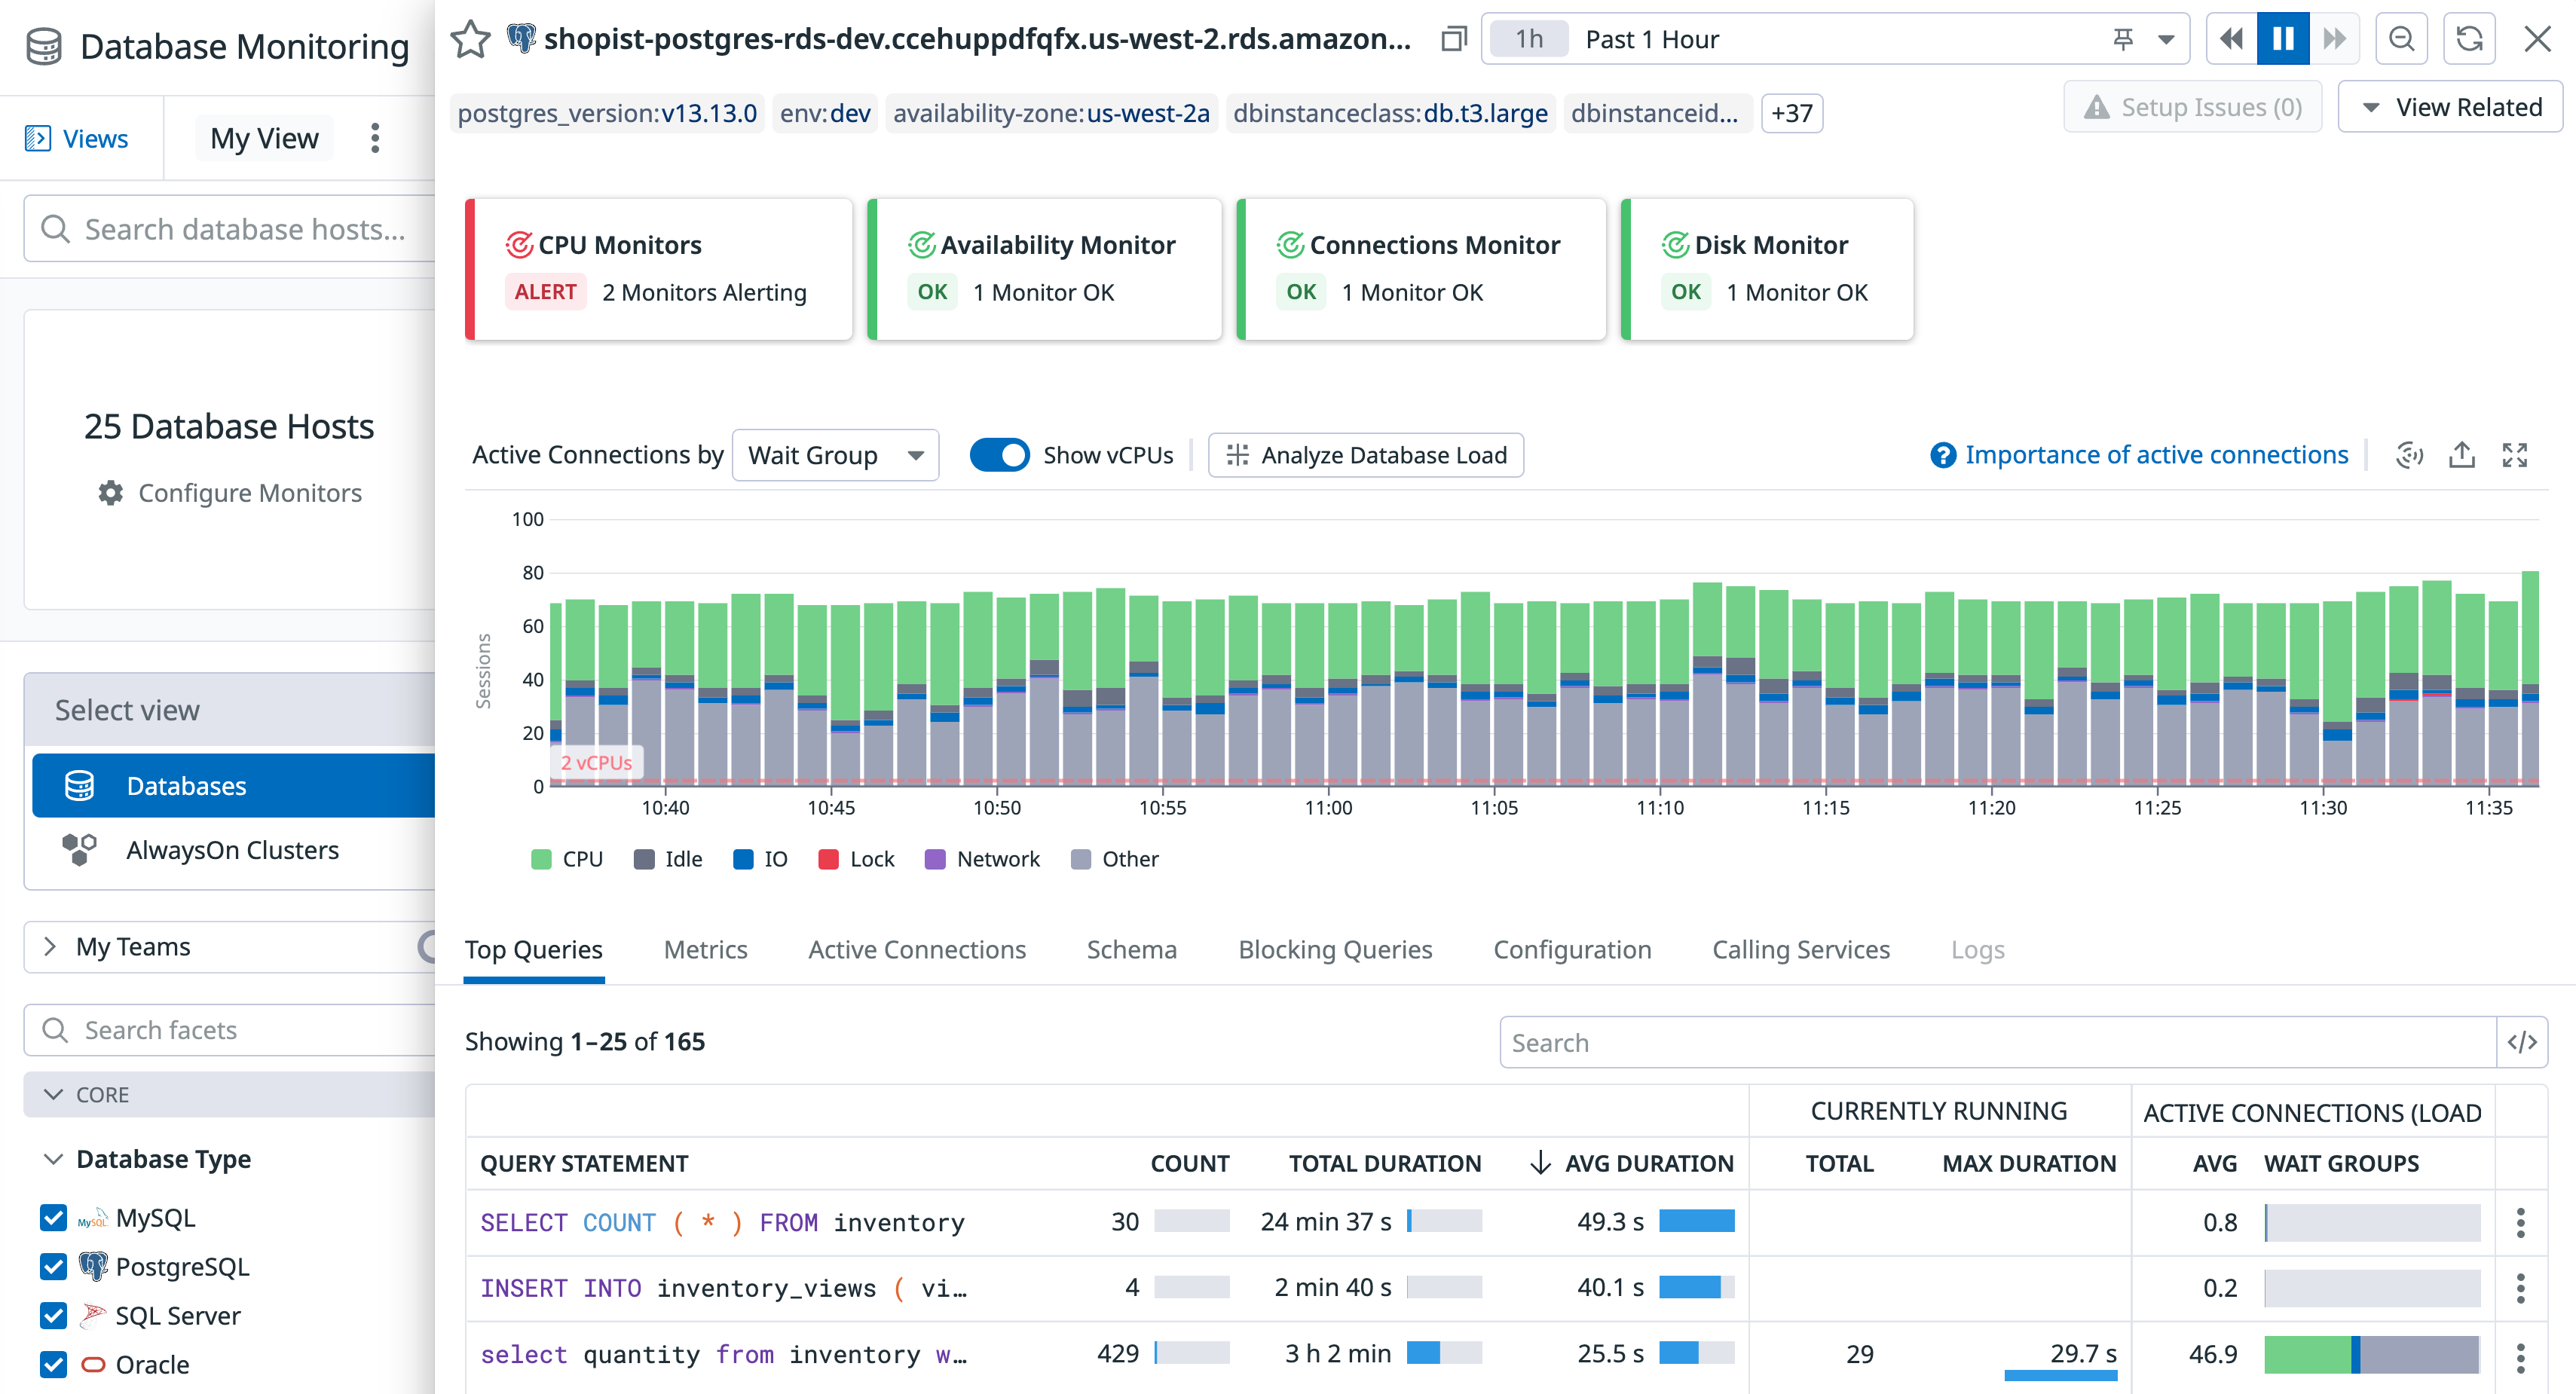
On the Databases page, you can assess the health and activity of your database hosts. Sort and filter the list to prioritize hosts with triggered alerts, high query volume, and other criteria. Click on any host in the list to open a details panel:
In addition to a filterable graph of active connections for that host, the host details panel displays the following features.
| Postgres | SQL Server | MySQL | Oracle | |
|---|---|---|---|---|
| Top queries | ||||
| Stored procedures | ||||
| Metrics | ||||
| Active connections | ||||
| Schema | ||||
| Blocking queries | ||||
| Calling services | ||||
| Configuration details |
Top queries
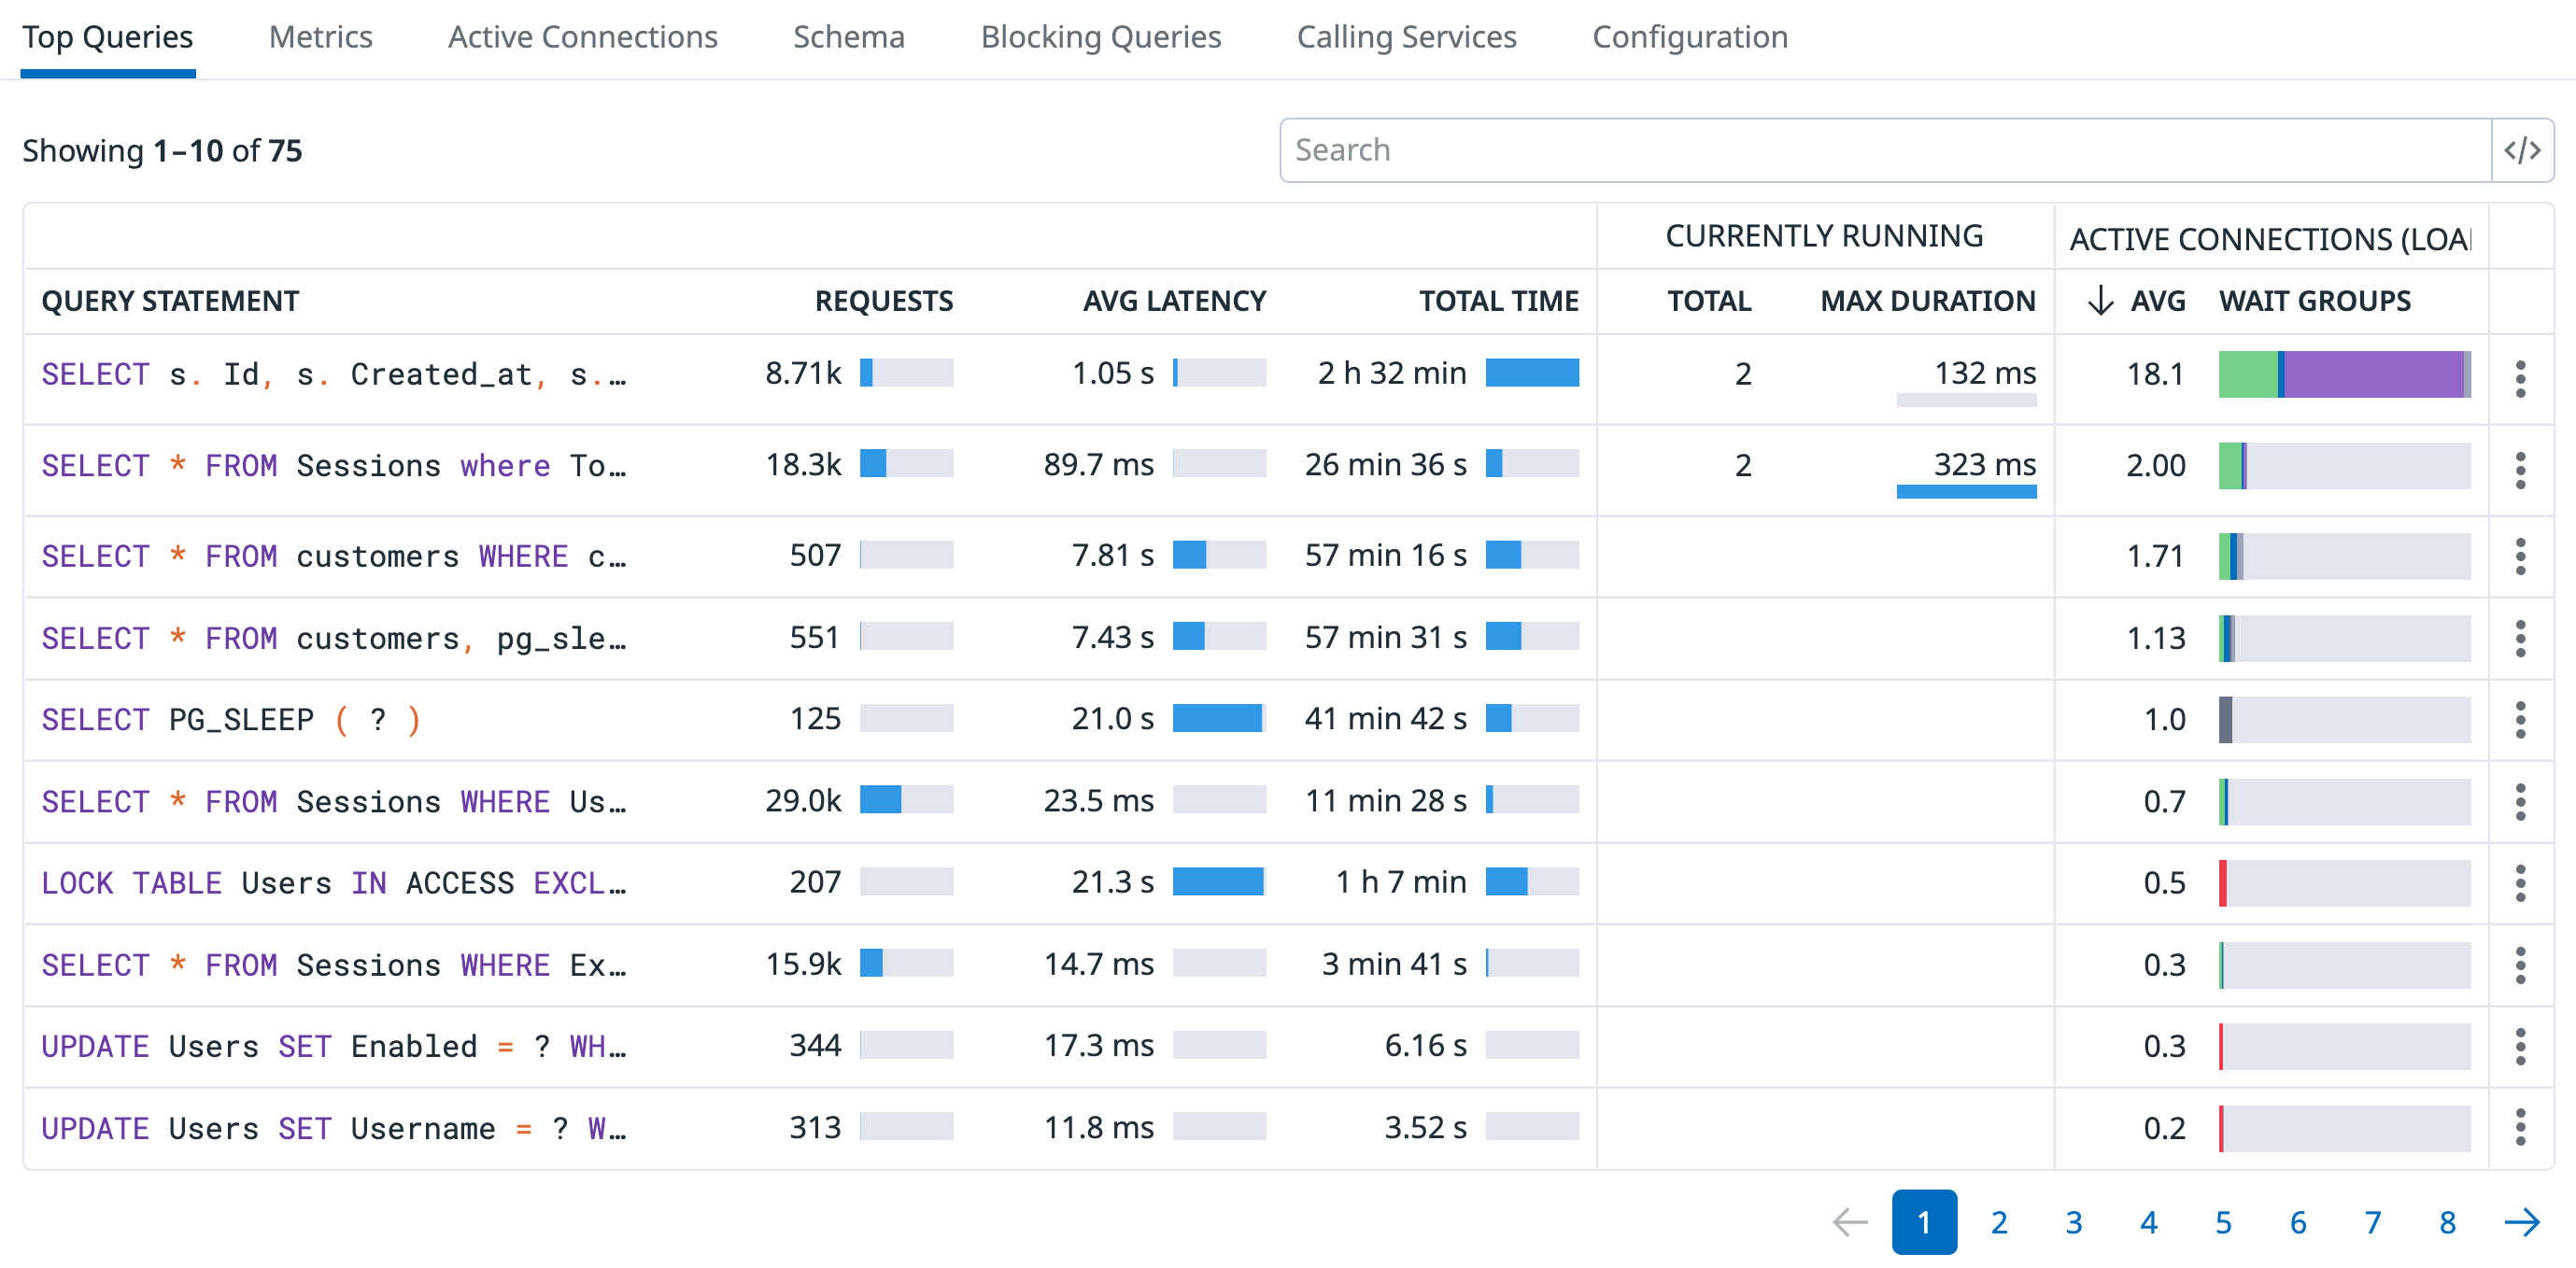
On the Top Queries tab of the host details panel, you can sort the most common queries by maximum duration, average latency, and more.
Click on any query statement to open a details panel that includes:
- query insights
- graphs for average latency and other key metrics
- explain plans
- blocking activity
- hosts that have run the query
- calling services
Stored procedures
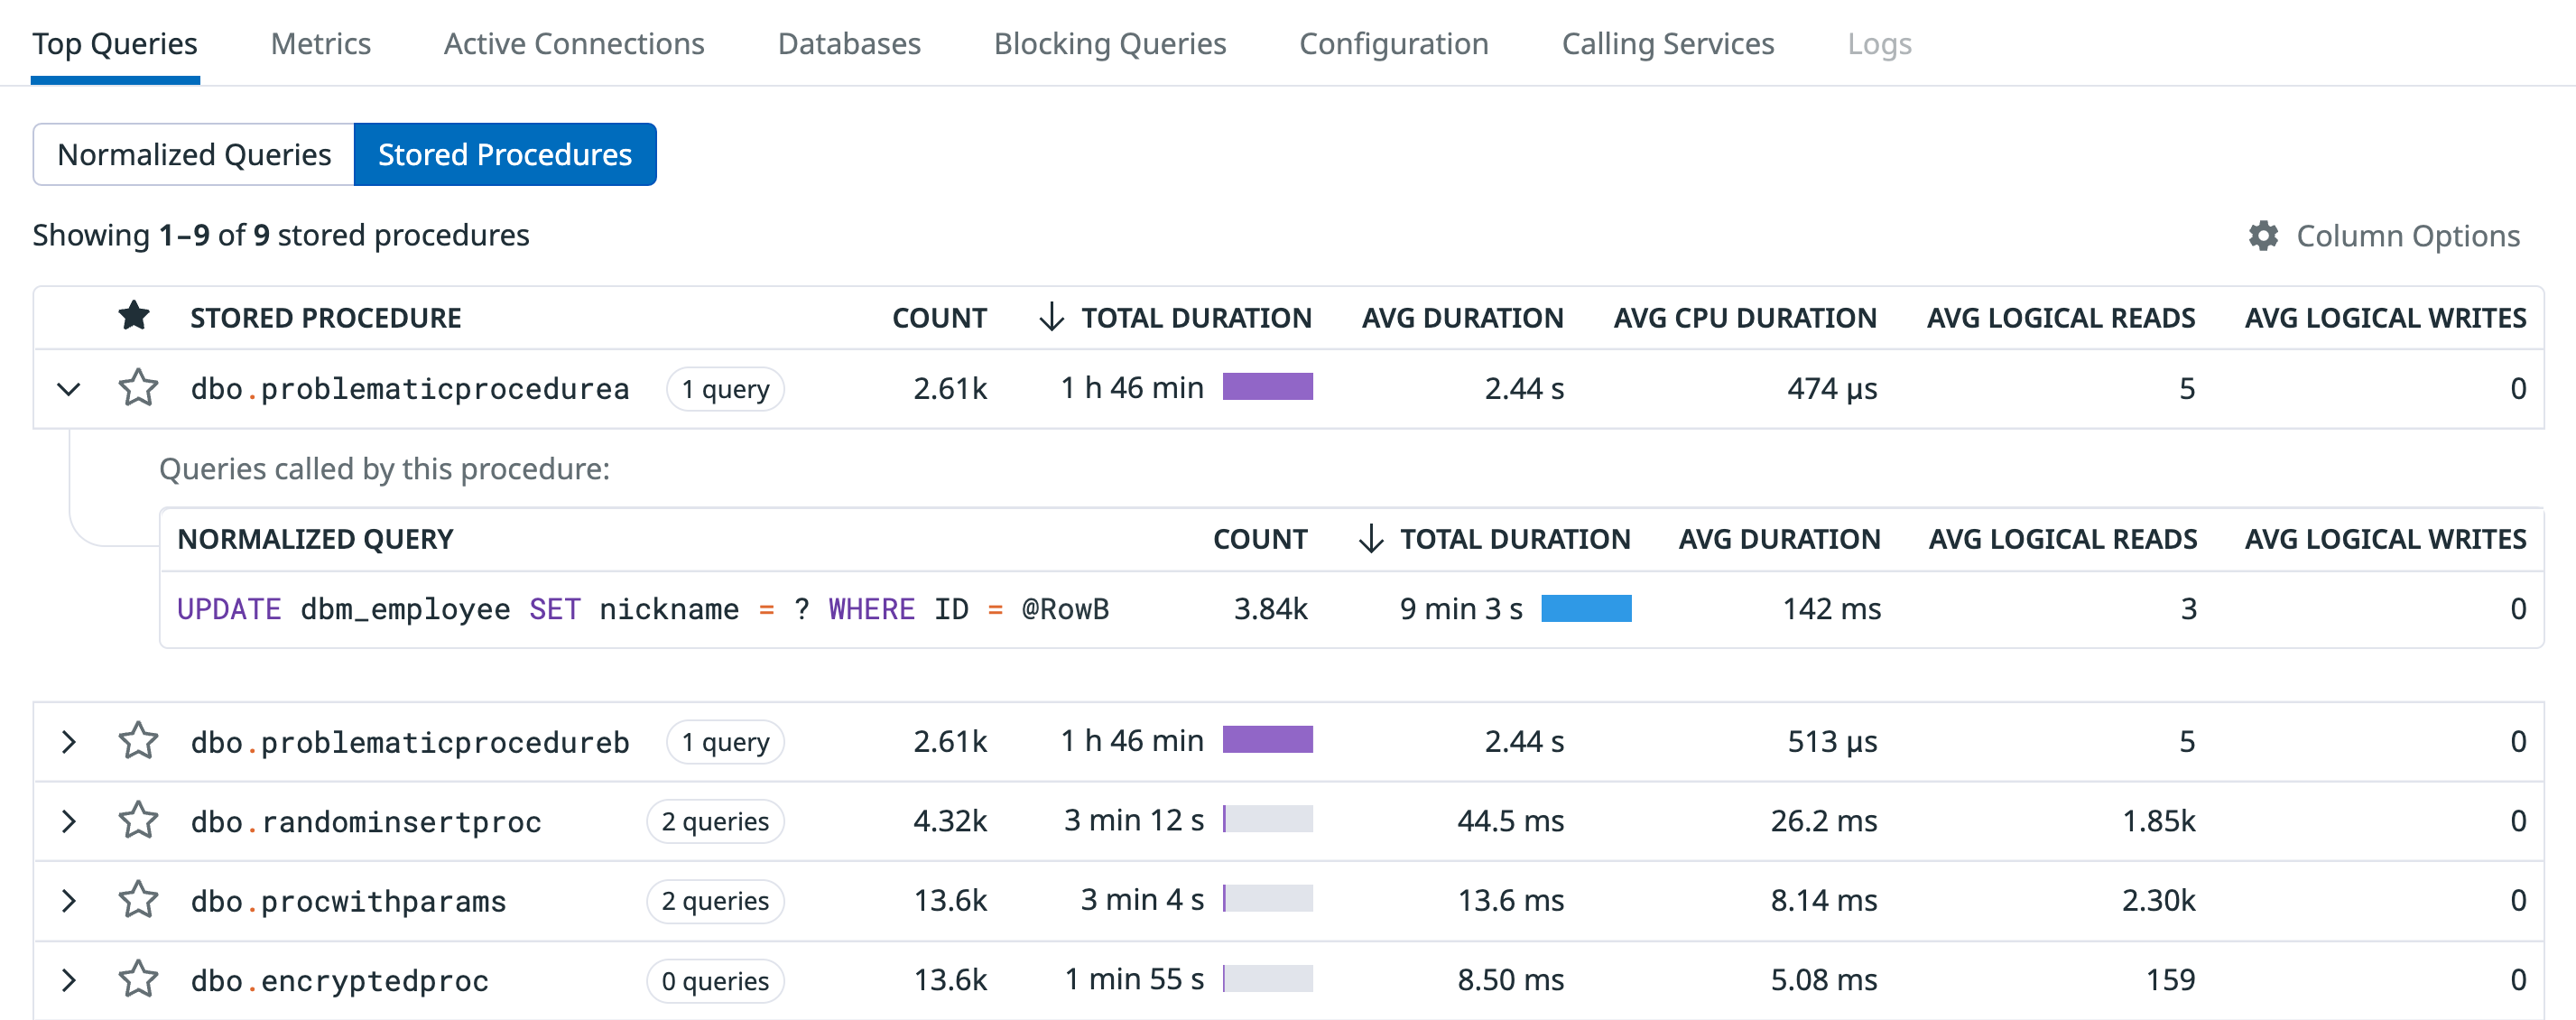
Where supported, the Top Queries tab includes a Stored Procedures section that lists each stored procedure by name, along with its average duration, logical reads count, logical writes count, and more. Expand a stored procedure to view its individual SQL queries, and click on a query to view its details panel.
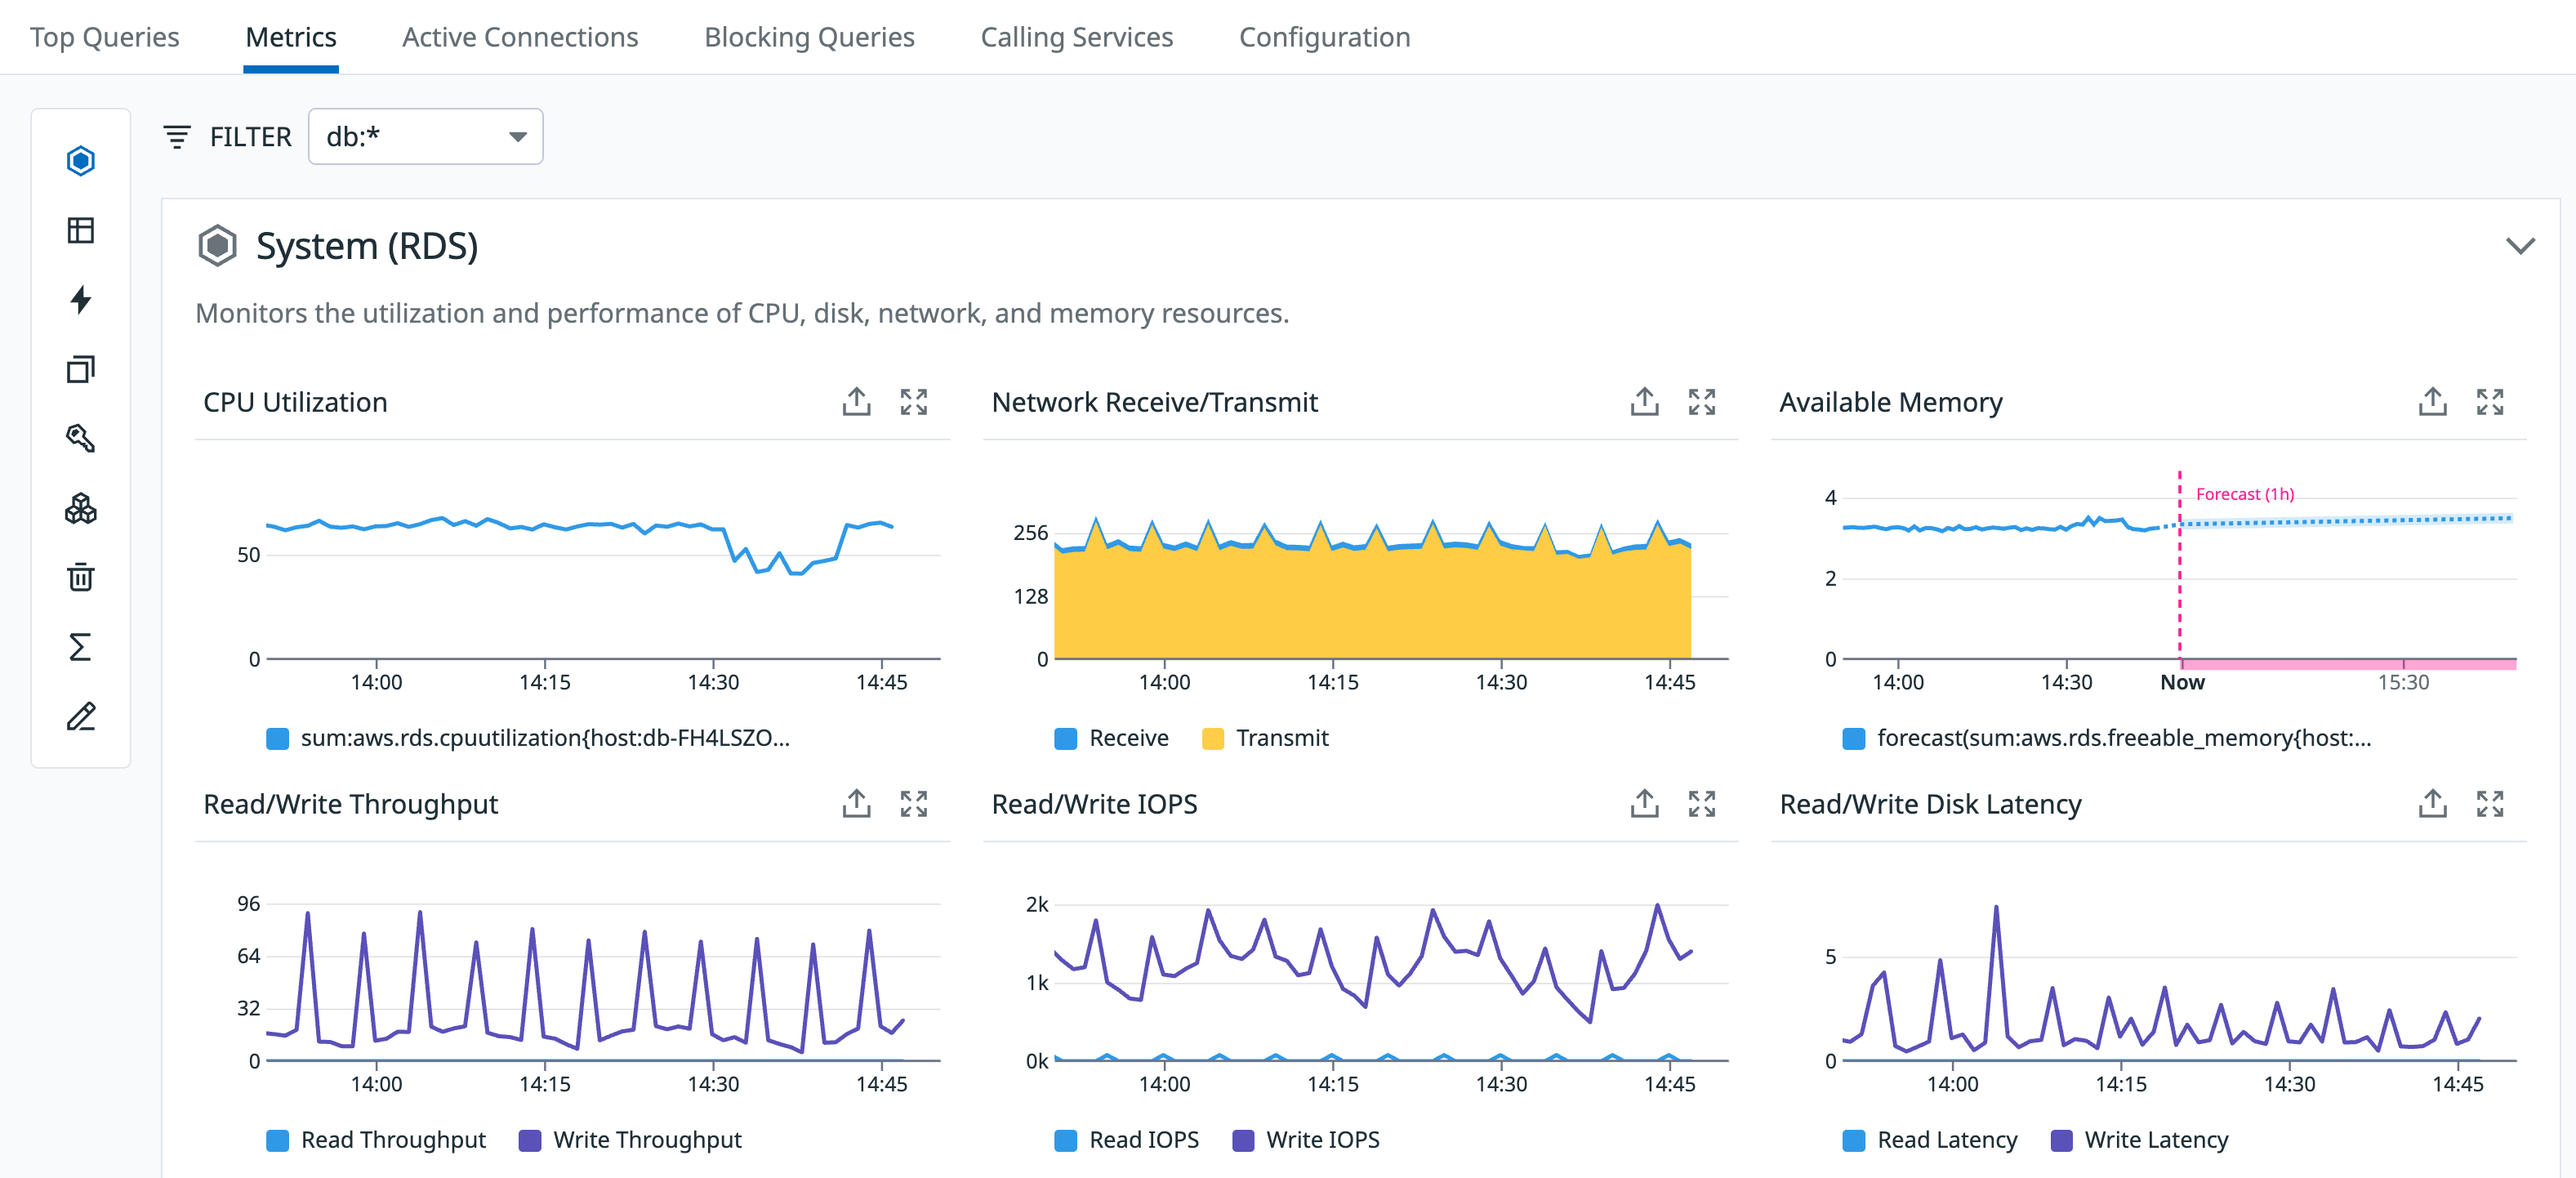
Metrics
This feature is in beta.
On the Metrics tab of the host details panel, you can view and filter metrics for system health, query activity, blocking operations, function performance, and other key areas.
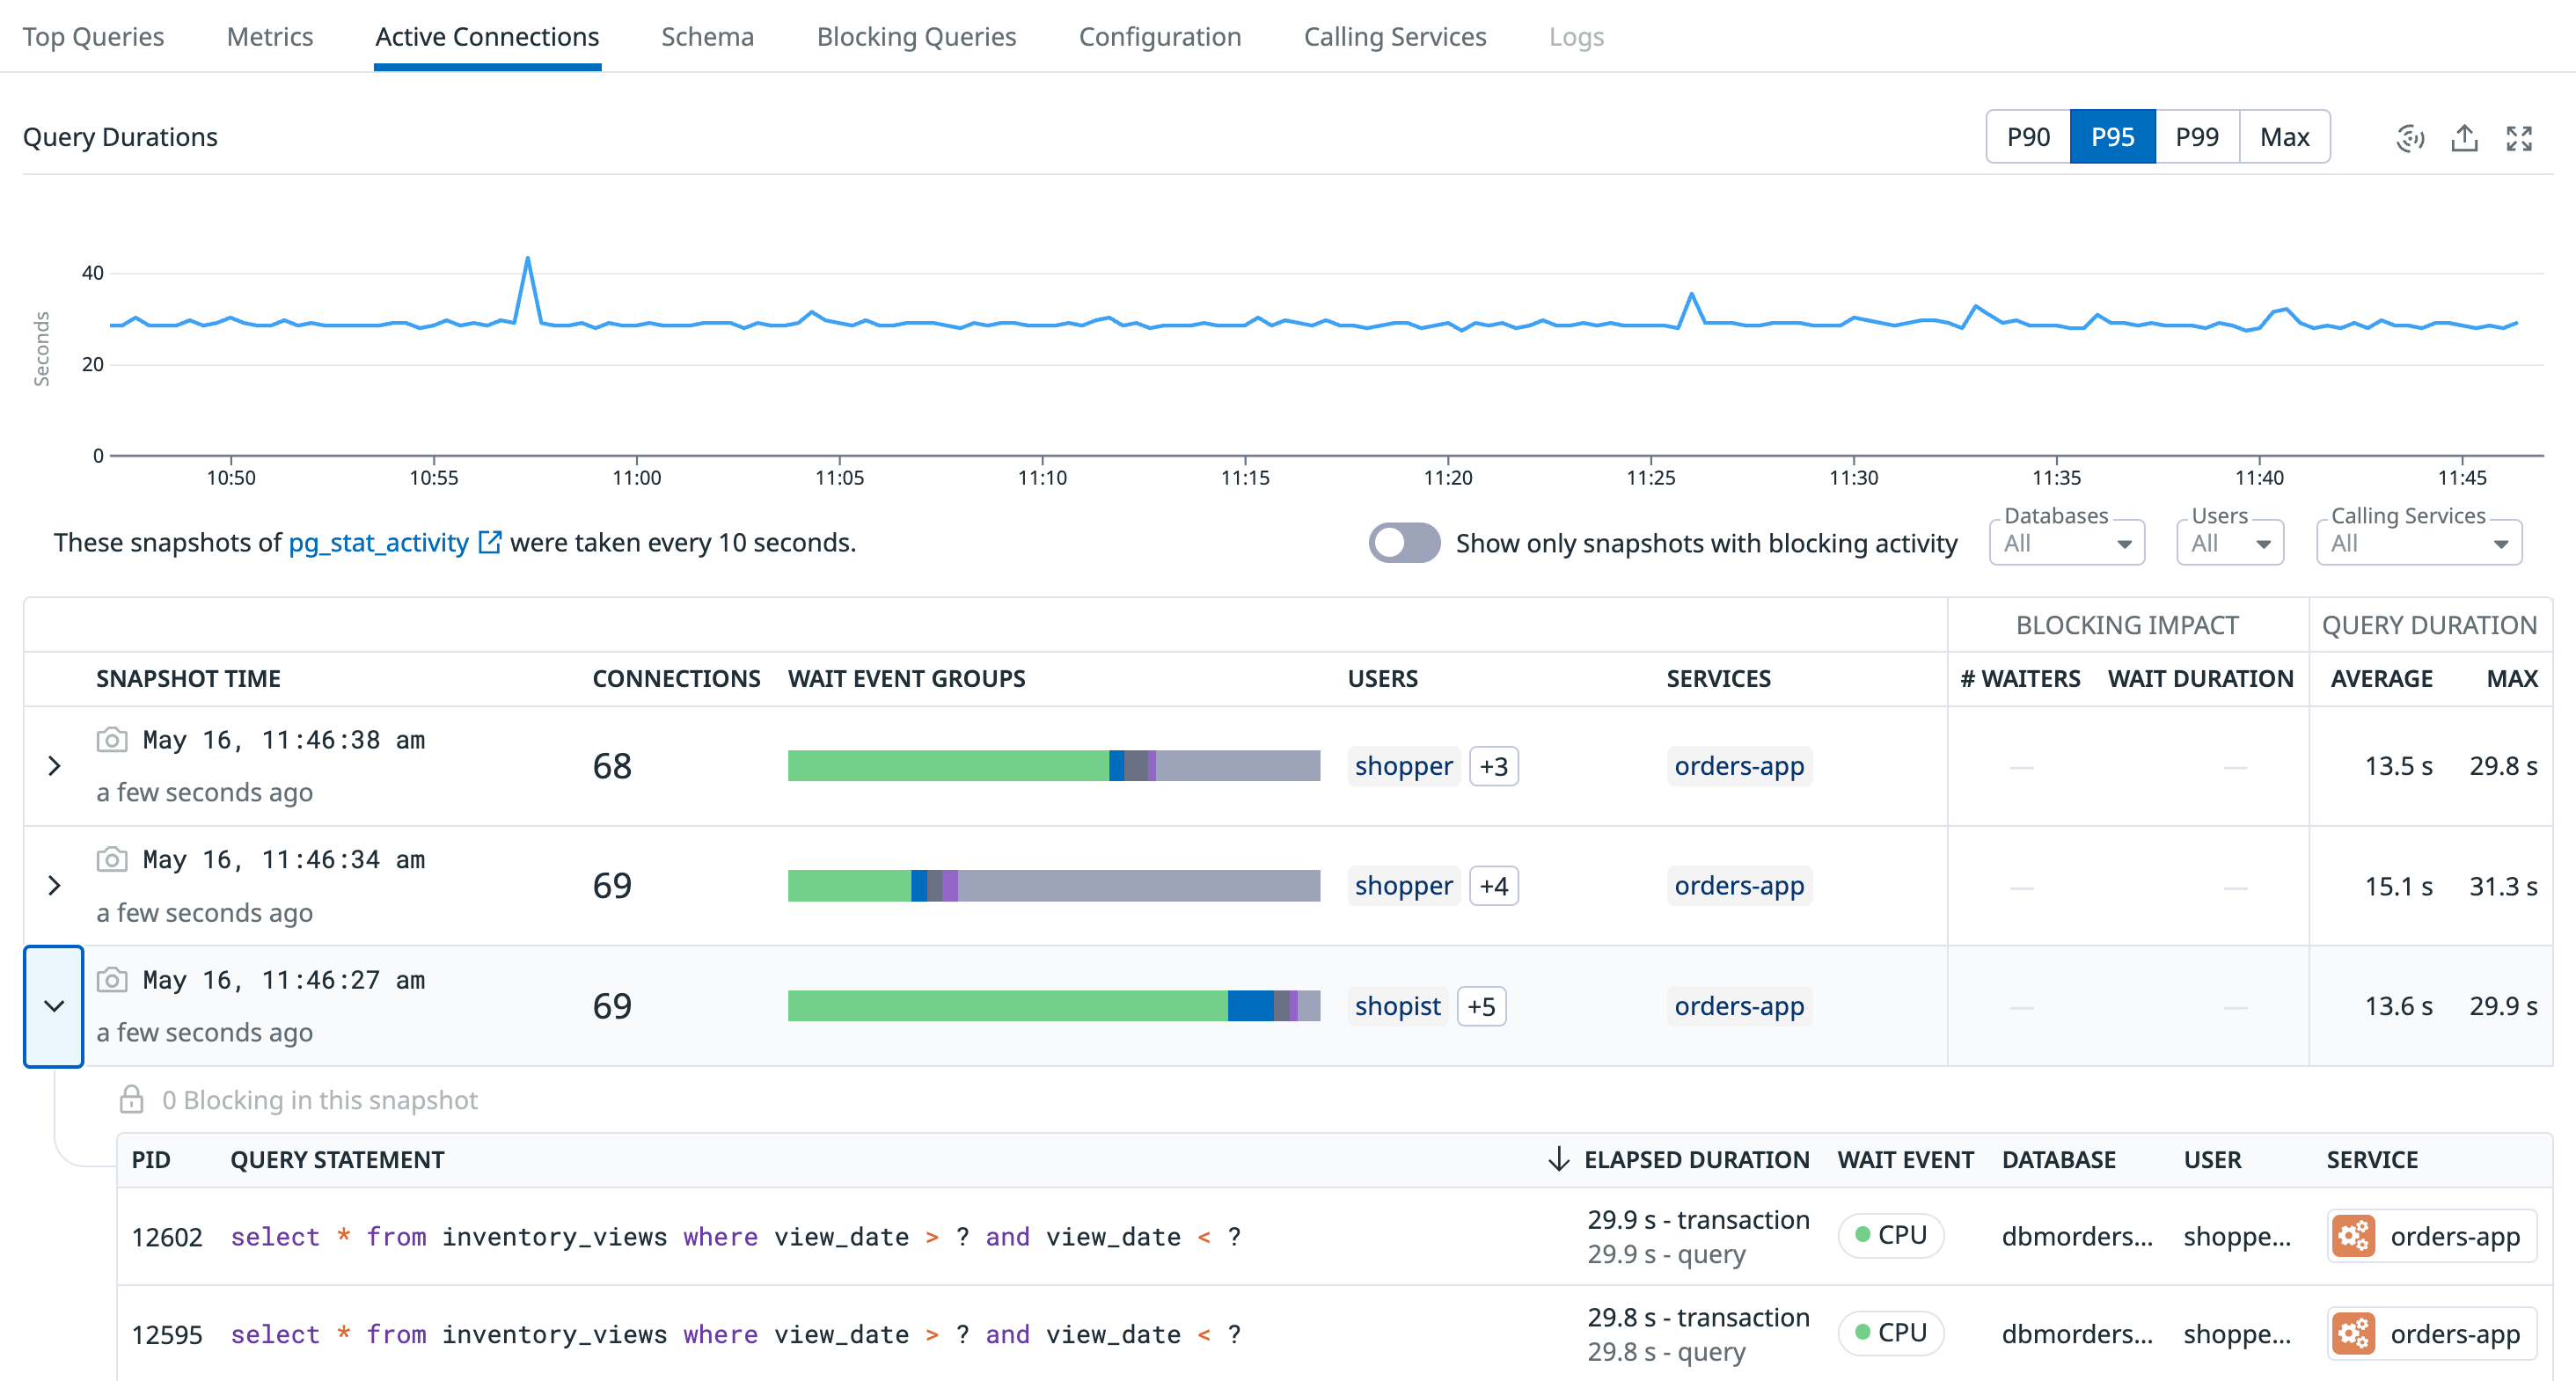
Active connections
The Active Connections tab of the host details panel displays the live queries being executed on the host. Click on a query statement to open a panel that includes event attributes, related traces, and other relevant details.
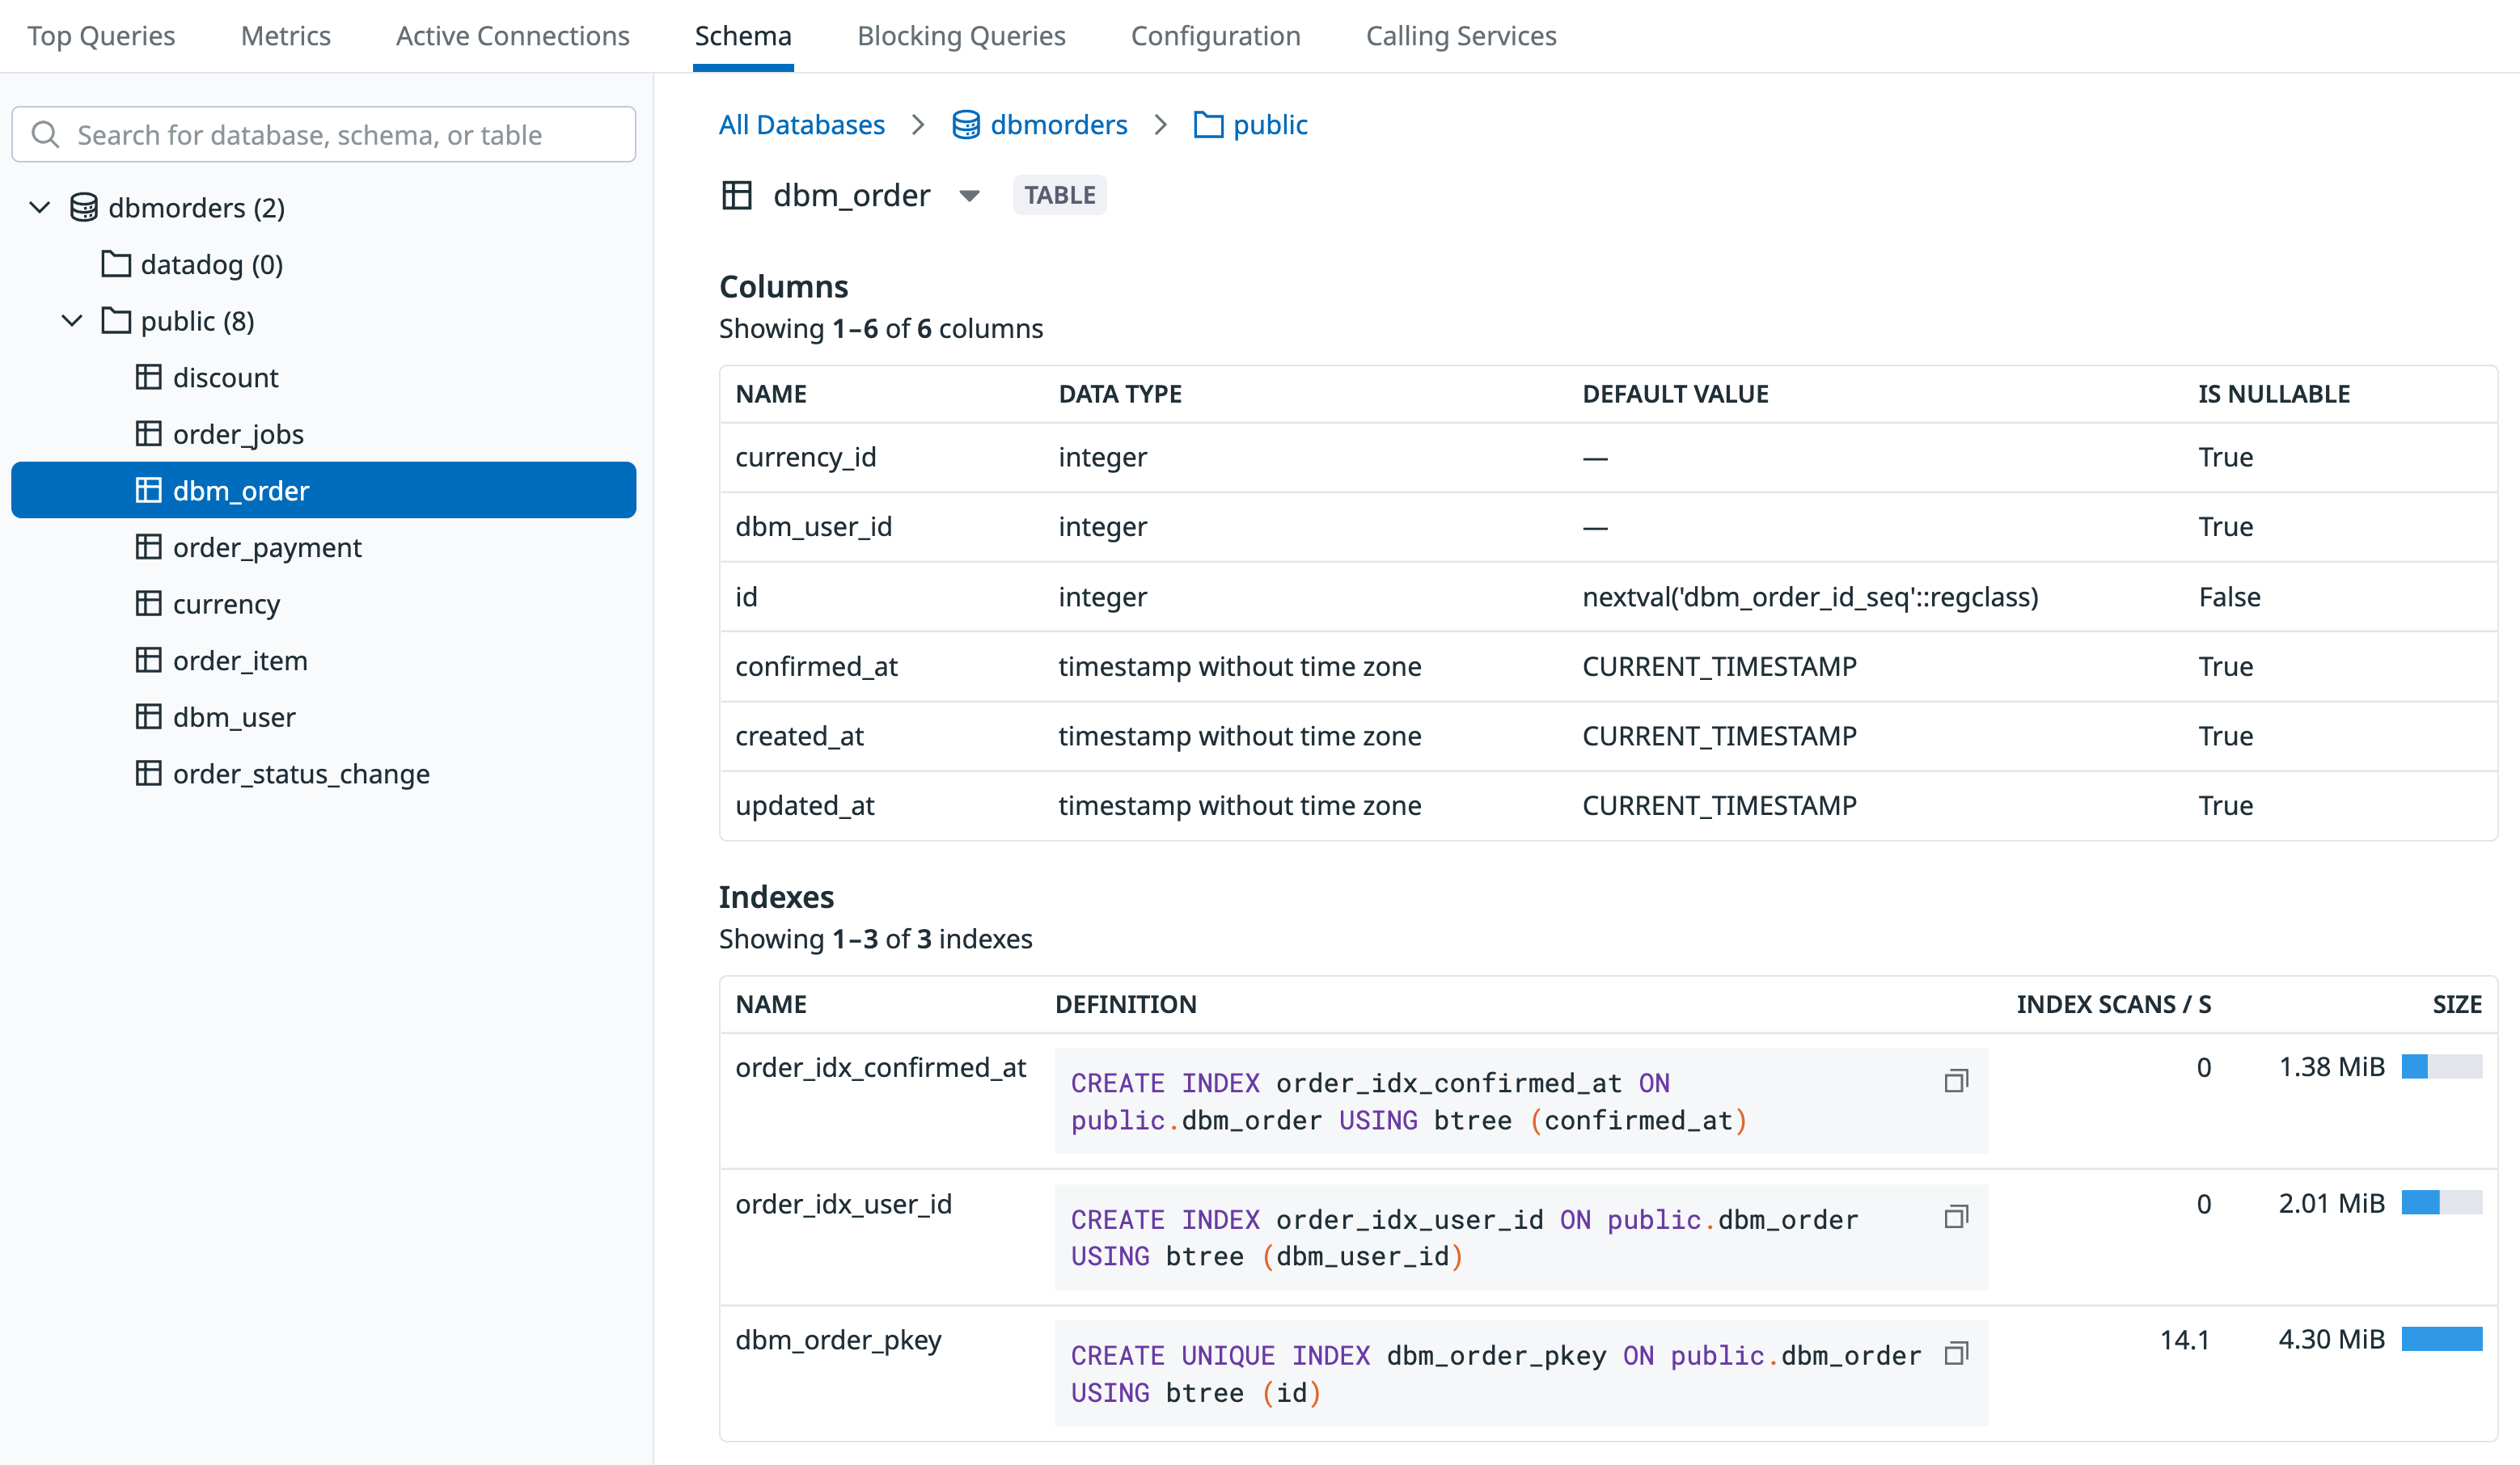
Schema
This feature is in beta.
Use the Schema tab to explore database structures, tables, columns, data types, existing foreign keys, and indexing strategies for every database on a host.
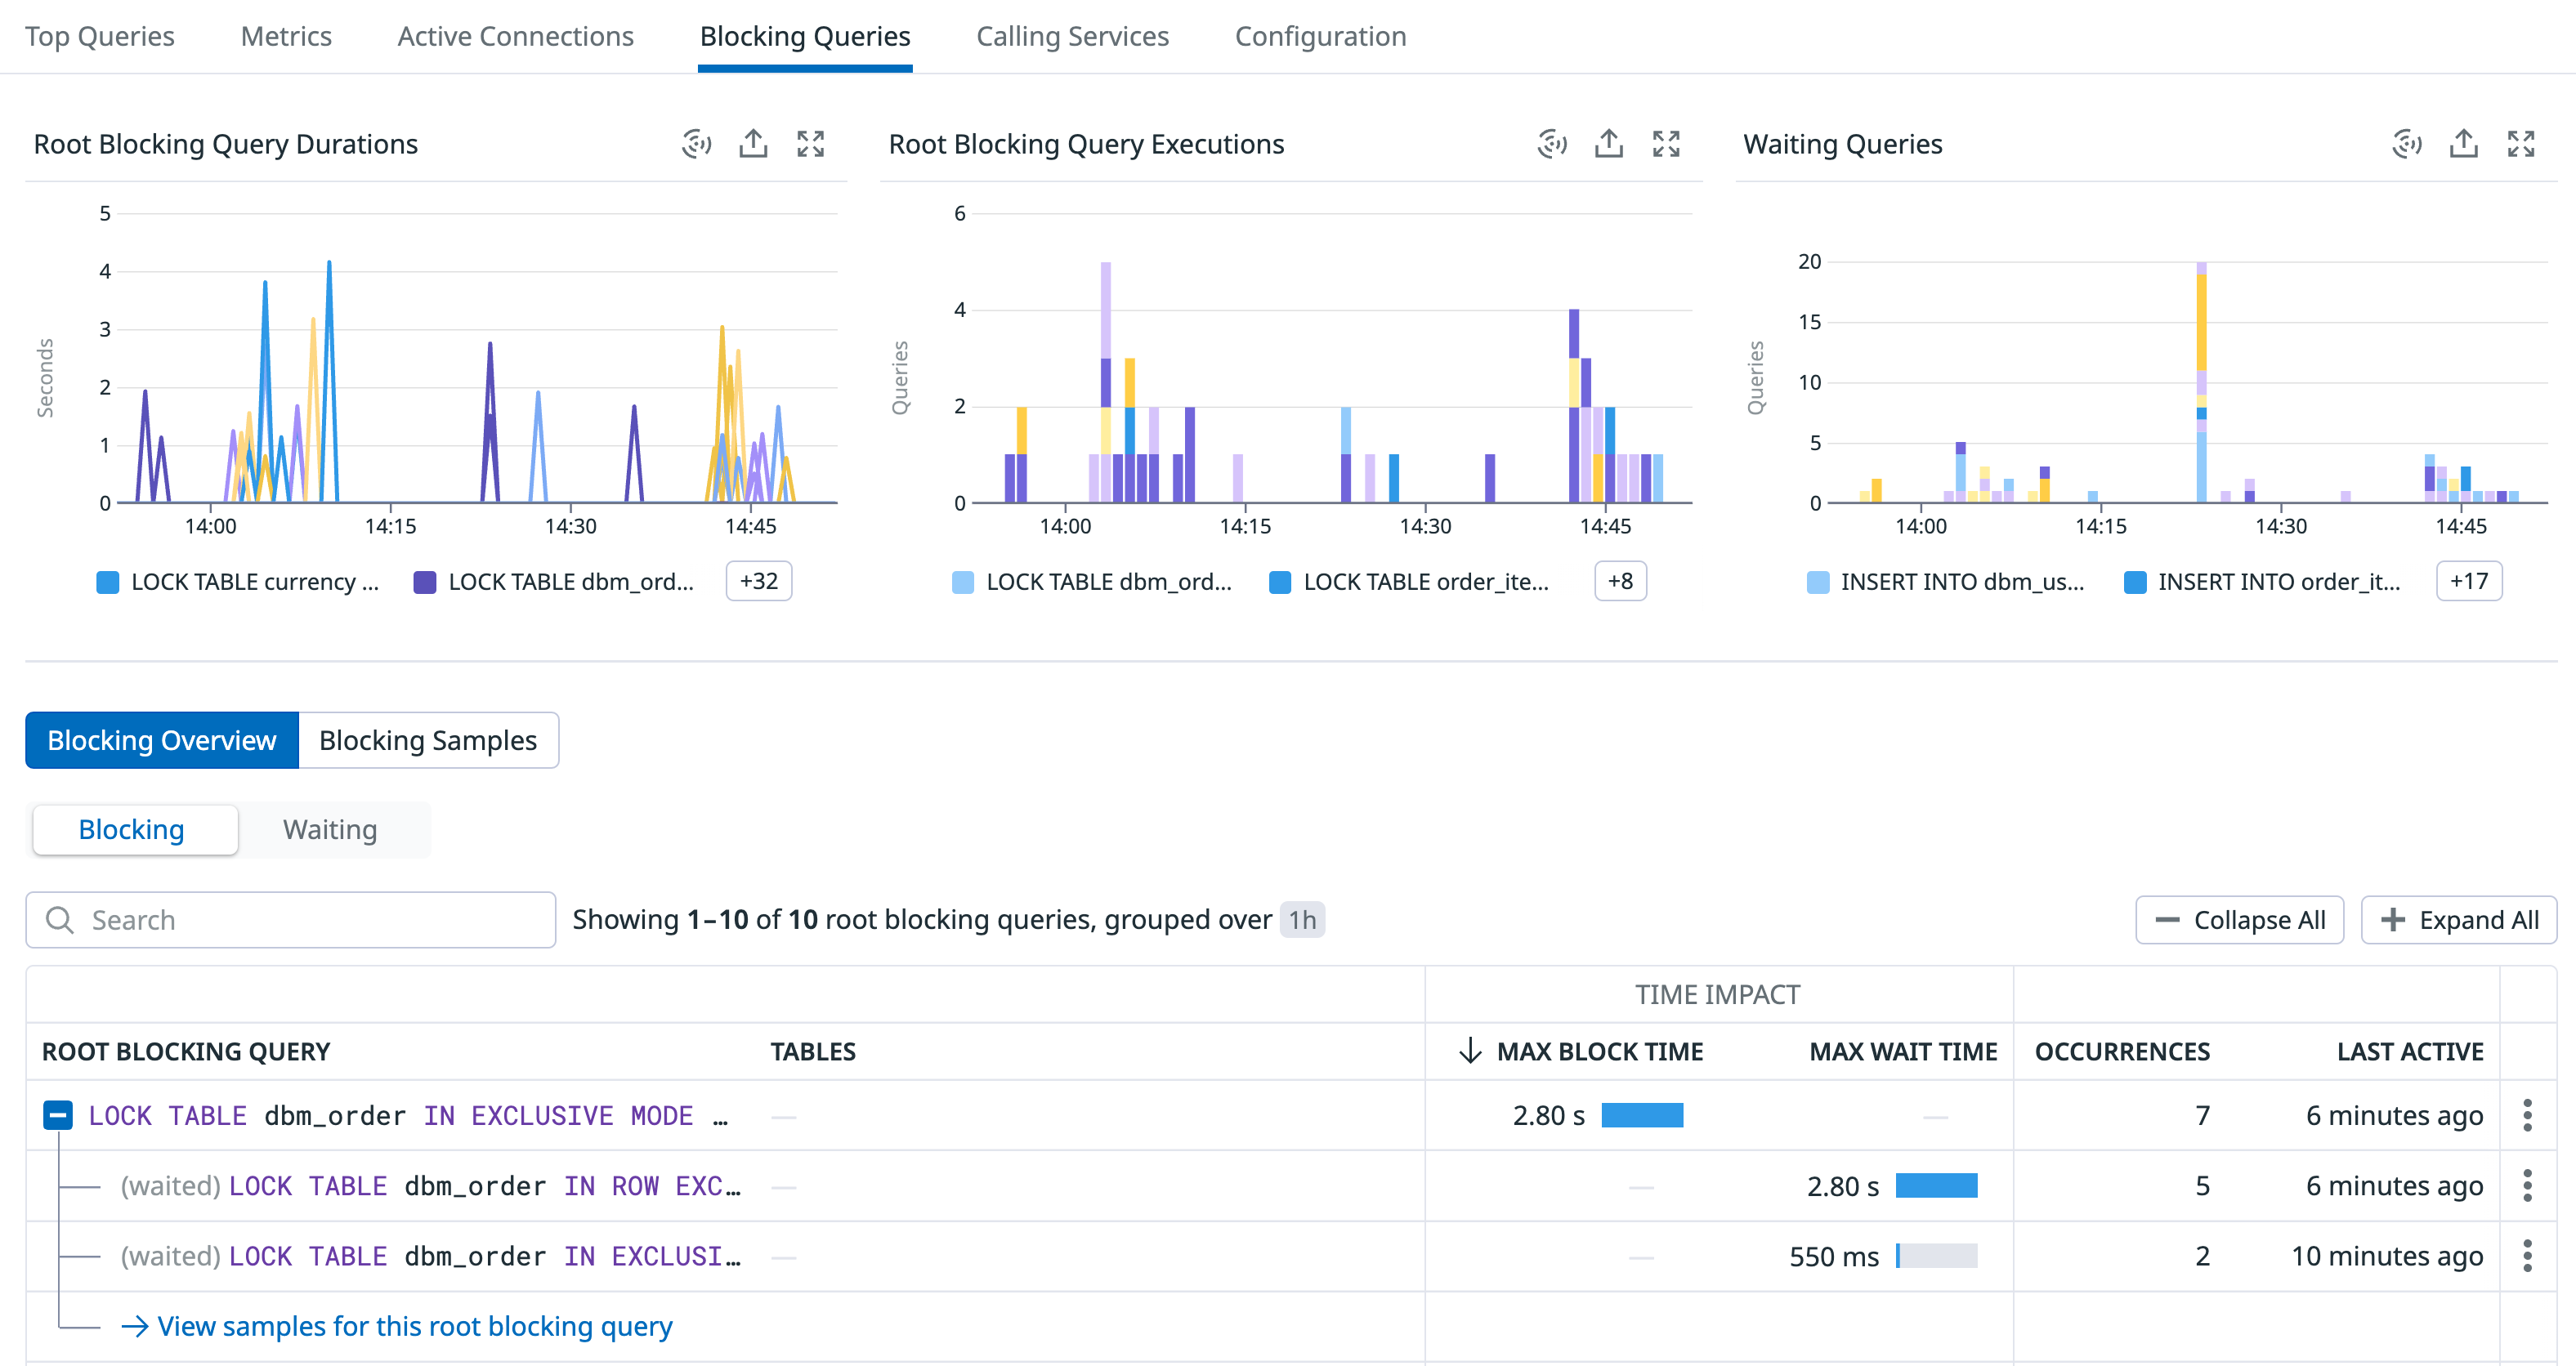
Blocking queries
On the Blocking Queries tab of host details panel, you can view visualizations for:
- blocking query durations
- blocking query executions
- the number of waiting queries
You can search and filter the queries or samples. Click any individual query row to view details.
Calling services
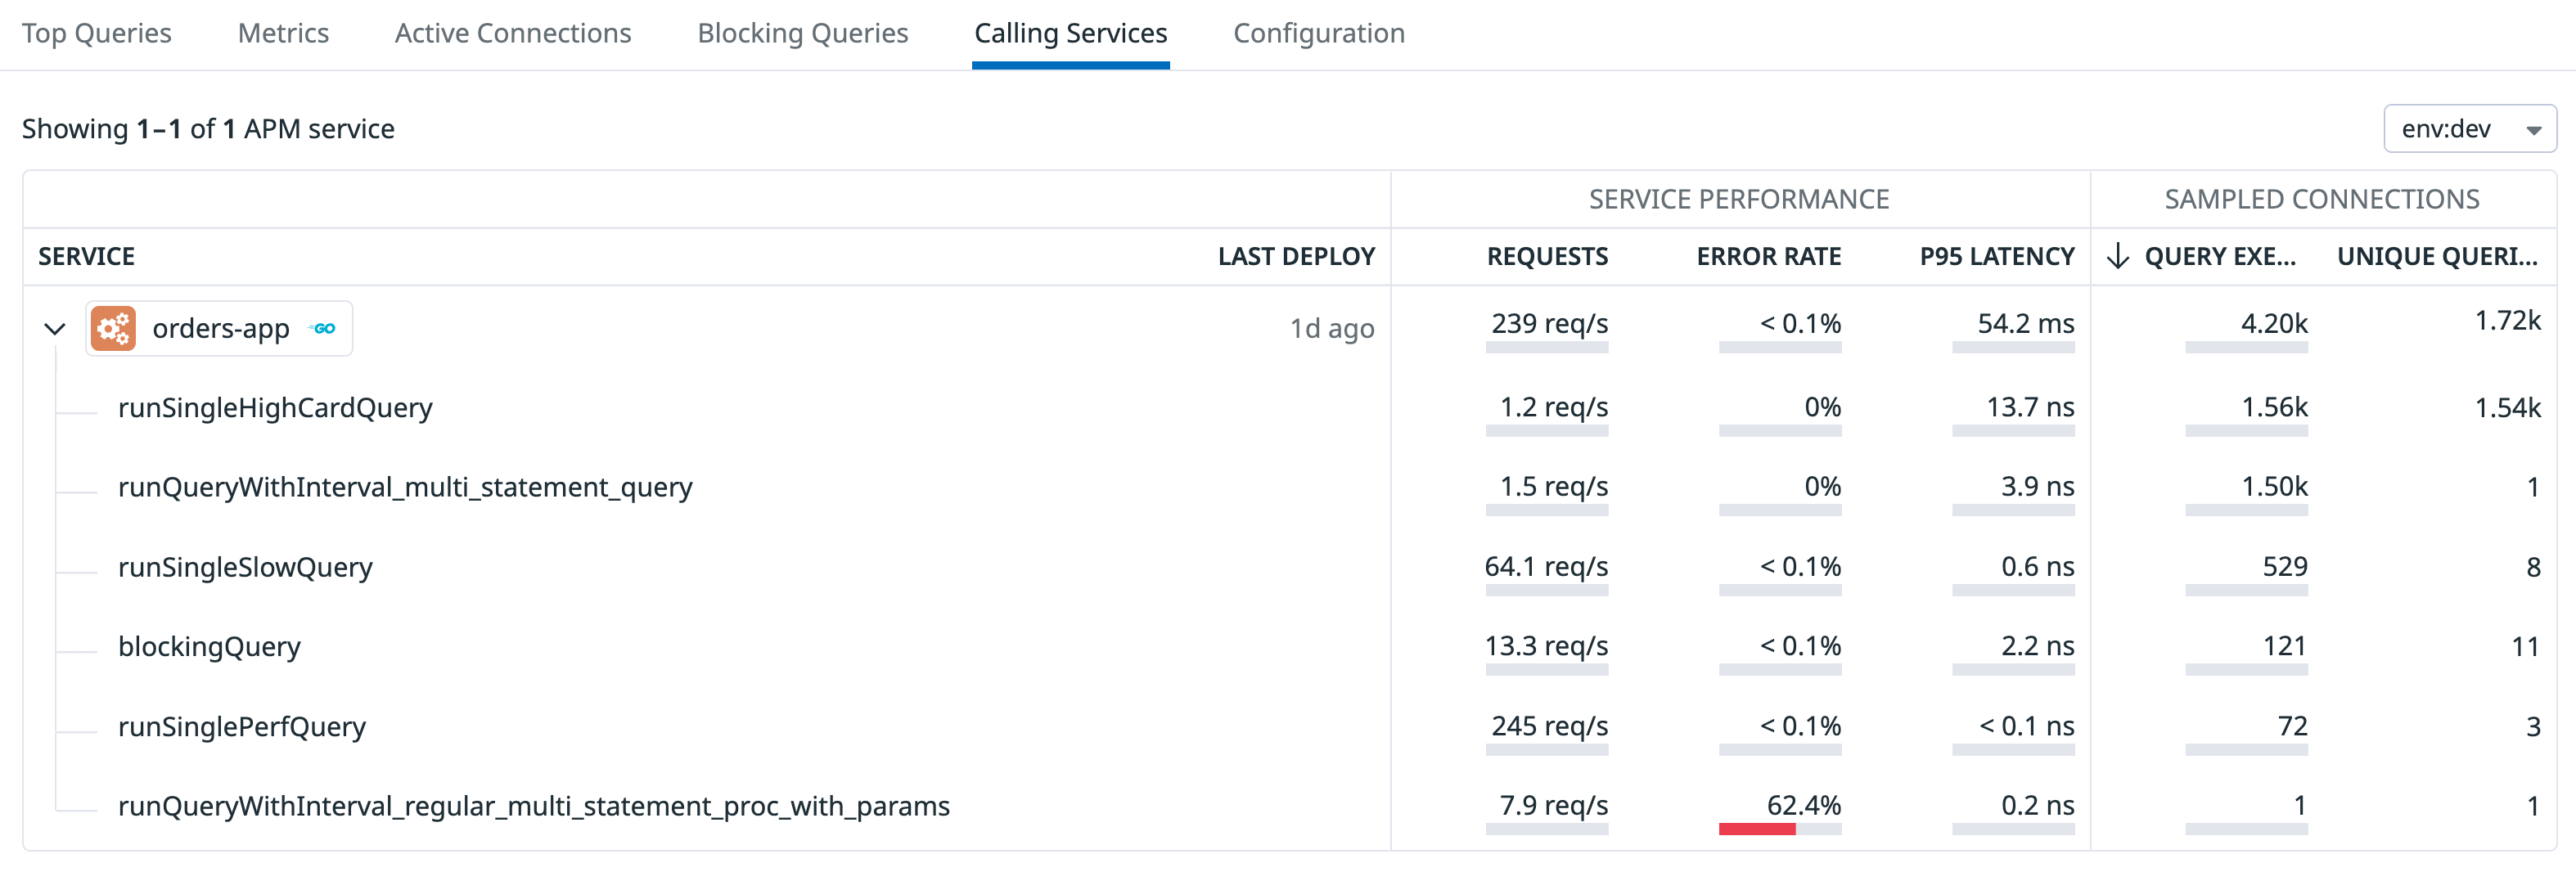
On the Calling Services tab of the host details panel, you can view the list of services that have called the host. The displayed service information includes when the service was deployed, the number of requests made to the host per second, how many database queries were executed, and more.
Click any service row to view its APM dashboard.
Configuration details
The host must have
collect_settings enabled in its instance configuration for this feature to work properly.The Configuration tab of the host details panel provides a direct view into the host’s configuration parameters without compromising database security. Use it to identify misconfigured database parameters and adjust settings to optimize database performance.
