- Essentials
- Getting Started
- Datadog
- Datadog Site
- DevSecOps
- Serverless for AWS Lambda
- Agent
- Integrations
- Containers
- Dashboards
- Monitors
- Logs
- APM Tracing
- Profiler
- Tags
- API
- Service Catalog
- Session Replay
- Continuous Testing
- Synthetic Monitoring
- Incident Management
- Database Monitoring
- Cloud Security Management
- Cloud SIEM
- Application Security Management
- Workflow Automation
- CI Visibility
- Test Visibility
- Test Impact Analysis
- Code Analysis
- Learning Center
- Support
- Glossary
- Standard Attributes
- Guides
- Agent
- Integrations
- OpenTelemetry
- Developers
- Authorization
- DogStatsD
- Custom Checks
- Integrations
- Create an Agent-based Integration
- Create an API Integration
- Create a Log Pipeline
- Integration Assets Reference
- Build a Marketplace Offering
- Create a Tile
- Create an Integration Dashboard
- Create a Recommended Monitor
- Create a Cloud SIEM Detection Rule
- OAuth for Integrations
- Install Agent Integration Developer Tool
- Service Checks
- IDE Plugins
- Community
- Guides
- Administrator's Guide
- API
- Datadog Mobile App
- CoScreen
- Cloudcraft
- In The App
- Dashboards
- Notebooks
- DDSQL Editor
- Sheets
- Monitors and Alerting
- Infrastructure
- Metrics
- Watchdog
- Bits AI
- Service Catalog
- API Catalog
- Error Tracking
- Service Management
- Infrastructure
- Application Performance
- APM
- Continuous Profiler
- Database Monitoring
- Data Streams Monitoring
- Data Jobs Monitoring
- Digital Experience
- Real User Monitoring
- Product Analytics
- Synthetic Testing and Monitoring
- Continuous Testing
- Software Delivery
- CI Visibility
- CD Visibility
- Test Optimization
- Code Analysis
- Quality Gates
- DORA Metrics
- Security
- Security Overview
- Cloud SIEM
- Cloud Security Management
- Application Security Management
- AI Observability
- Log Management
- Observability Pipelines
- Log Management
- Administration
Alert on anomalous p99 latency of a database service
3 minutes to complete
Datadog allows you to set monitors to keep track of the health of your services with APM instead of constantly monitoring it yourself. In this example, we’ll use an anomaly detection monitor. Anomaly detection is an algorithmic feature that allows you to identify when a metric is behaving differently than it has in the past, taking into account trends, seasonal day-of-week, and time-of-day patterns. It is well-suited for metrics with strong trends and recurring patterns that are hard or impossible to monitor with threshold-based alerting.
Open the New Monitor Page and choose APM.
Choose your environment under Primary Tags and Choose the database to monitor under Service.
Under Resource, you can choose to monitor specific queries run in the database, but in this example, we’ll look at overall performance so leave it as
*.Once you choose a service, the next step becomes available for you to set, and a chart appears at the top of the page showing the performance of the metric that the new monitor tracks.
Choose an Anomaly Alert and under the For option select p99 latency.
Once you choose Anomaly Alert the chart also shows you the baseline expected behavior for the metric chosen - in our case, p99 latency.
Set the Alert when field value to 100%.
This means that all of the events for the selected duration have to be anomalous for the alert to trigger. This is a best practice for starting with Anomaly Detection. Over time, you’ll find the right values that fit your situation. You can find out more about Anomaly Detection Monitors in the FAQ.
Change the alert notification.
In this example, you can either leave the notification content with the default text or choose team members to tag in the alert.
You can read more about the markup for notification text and what values and conditions you can set there in the notifications overview.
Make sure your username appears in the Configure notifications and automations notification field and add any additional team members that should be notified in case of a database latency anomaly.
Note: To add another user, type
@at the start. Click Save.Your alert is now set, you can tweak any of the parameters from this screen and follow the metric performance.
Switch from the Edit tab to the Status tab.
Here you can see the current status of your monitor, mute it, or explore deeper into the specifics of a triggered alert.
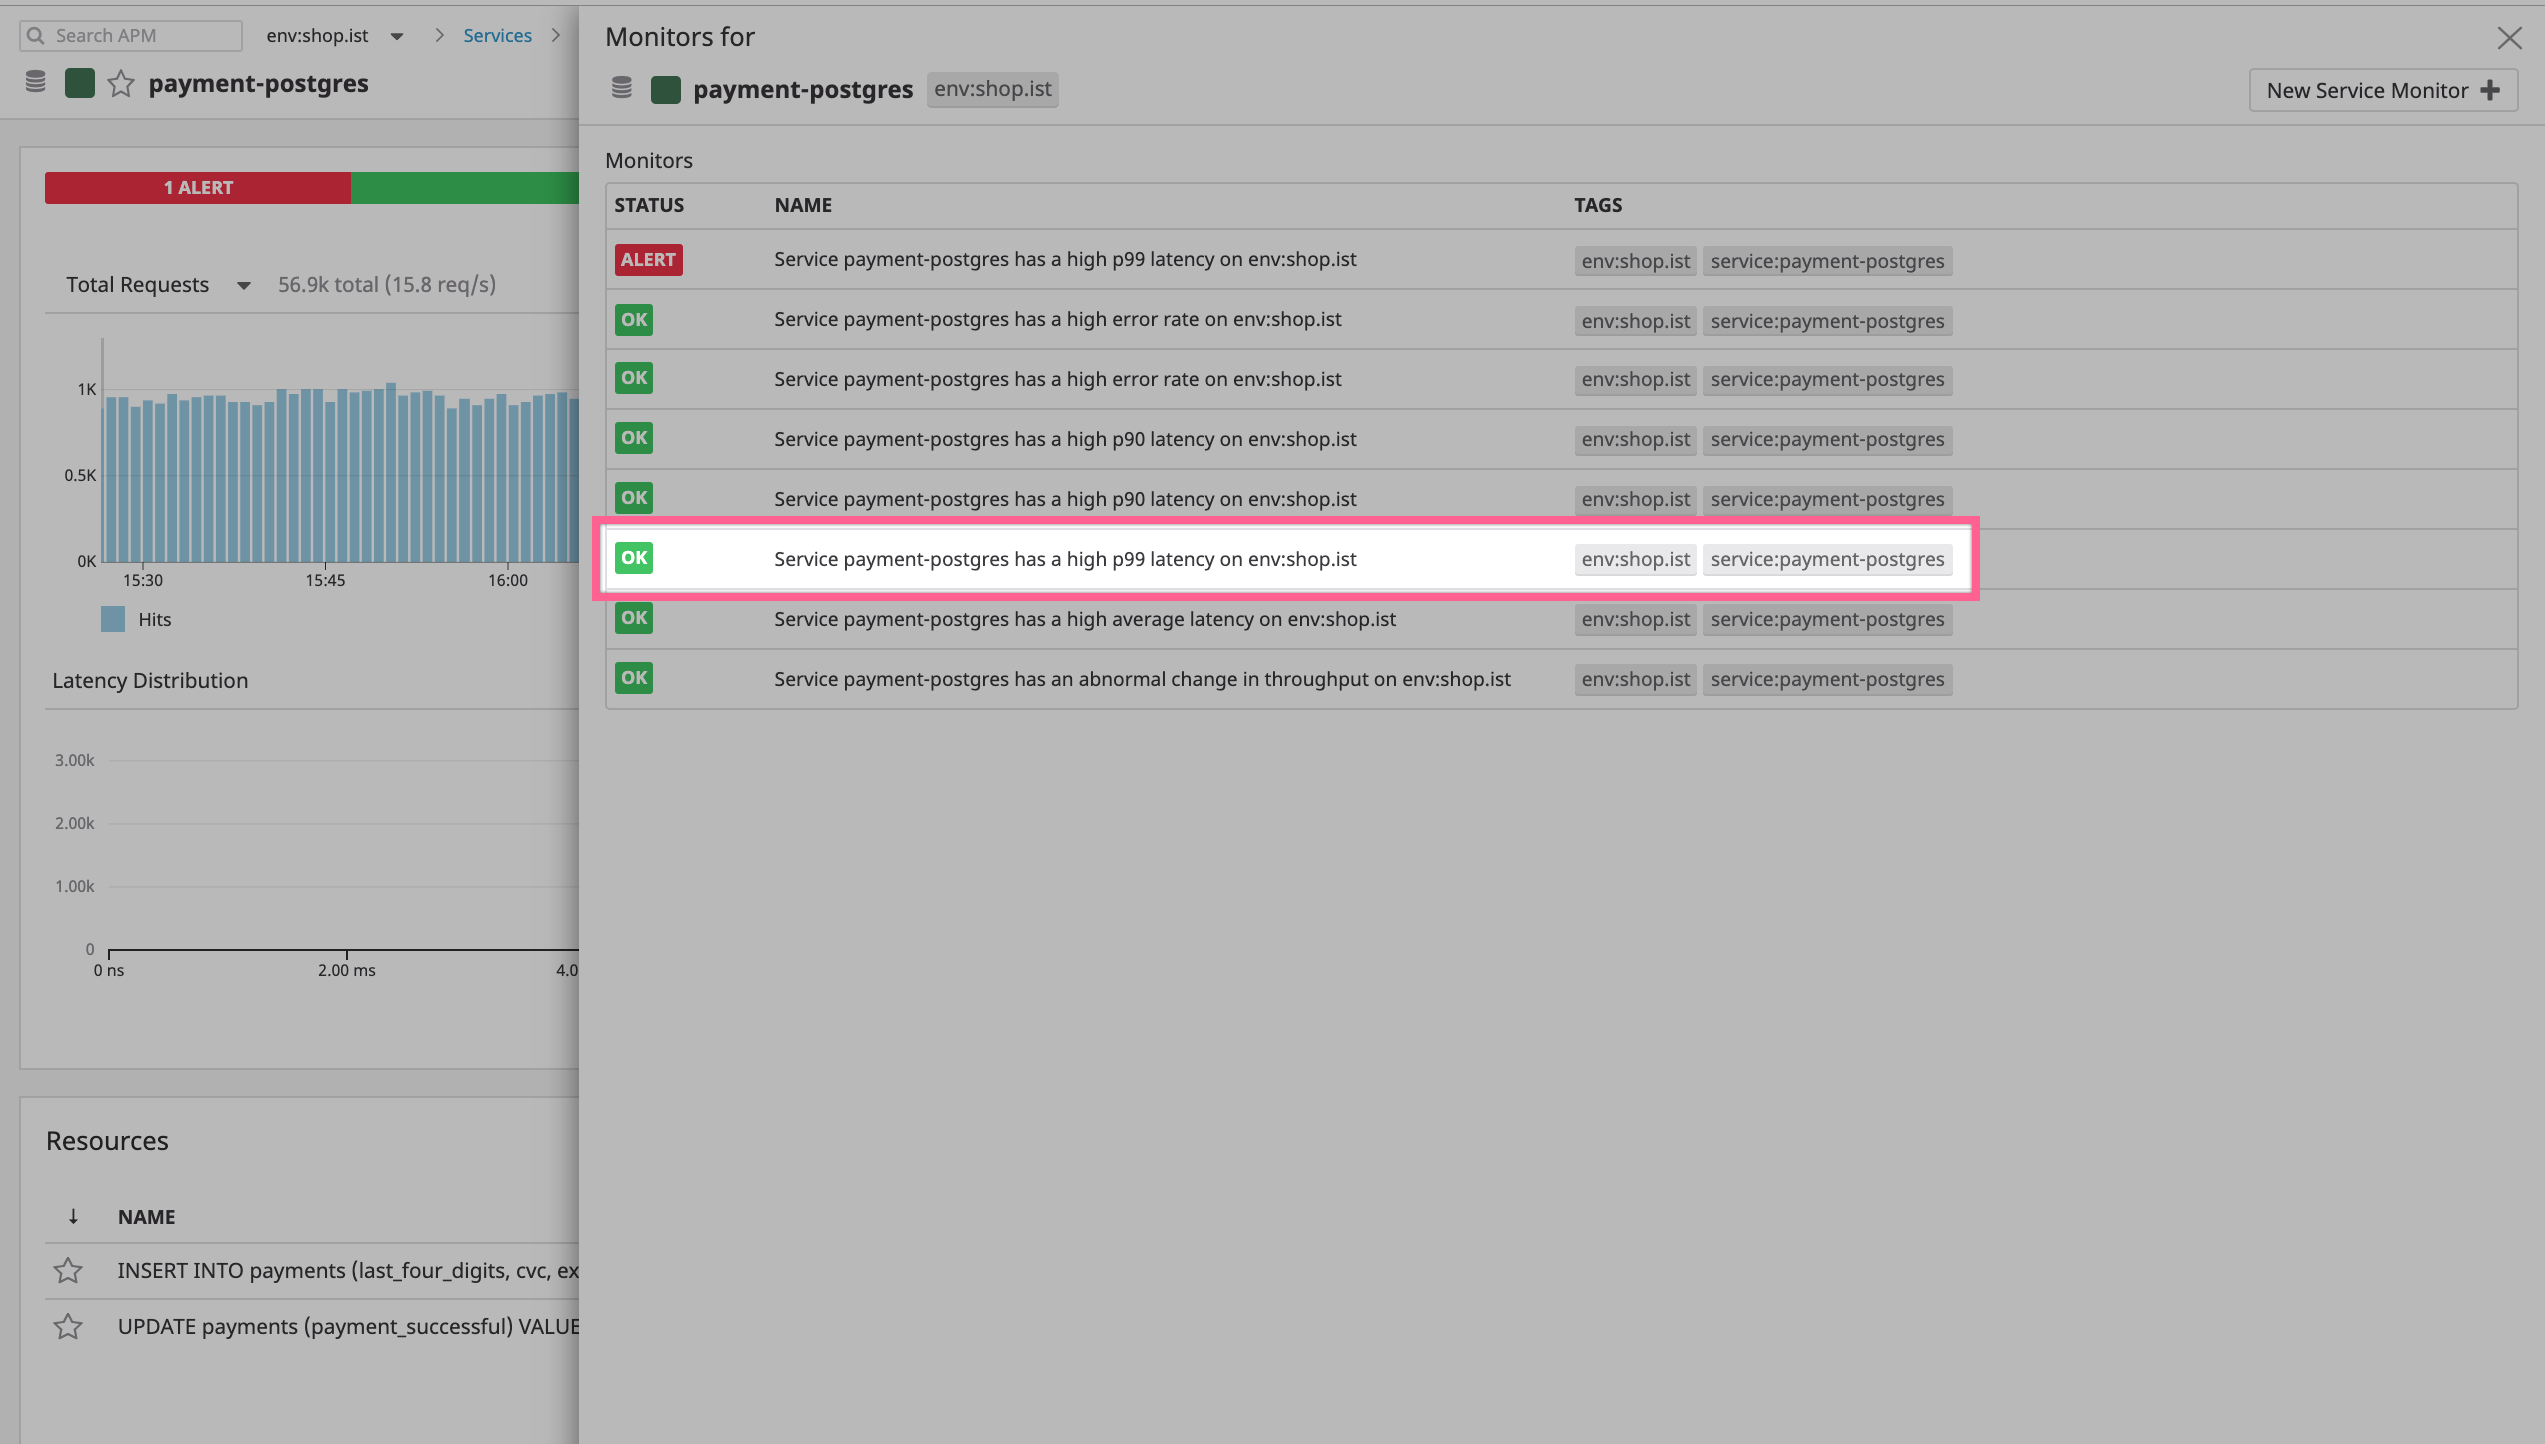
Navigate back to the Service Catalog and from there find the service you just set the monitor on, click into the Service Page and there click on the Monitor bar under the header.
Here you should see the new monitor alongside any other monitor set for the service and suggested monitors that are recommended to set.
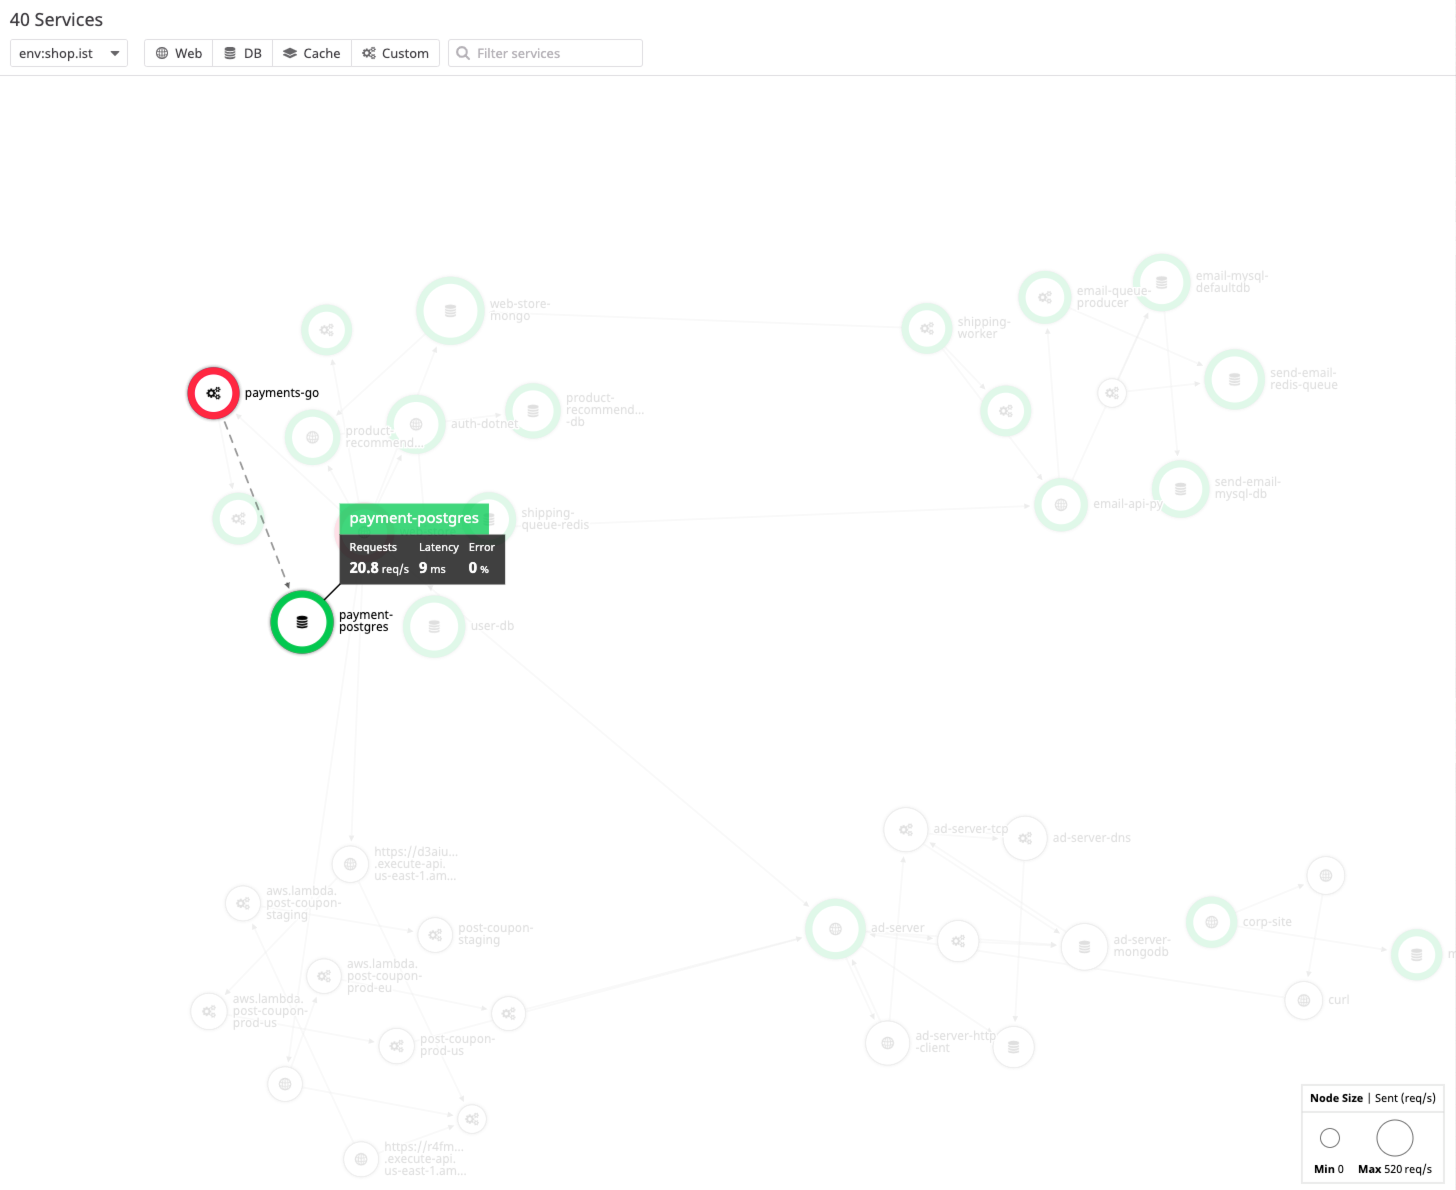
As you create monitors you’ll find more services, metrics and events to include and more complex conditions to set for these. Each of these monitors is connected to a service and can be accessed from the Service page as well as the Service Map.
For each service on the map, a green circle means all monitors are quiet, yellow means one or more monitors are sending warnings but none are alerting, red means one or more monitor is alerting and gray means no monitor is set for the service.
Further Reading
Additional helpful documentation, links, and articles:


