- Essentials
- Getting Started
- Agent
- API
- APM Tracing
- Containers
- Dashboards
- Database Monitoring
- Datadog
- Datadog Site
- DevSecOps
- Incident Management
- Integrations
- Logs
- Monitors
- OpenTelemetry
- Profiler
- Session Replay
- Security
- Serverless for AWS Lambda
- Software Catalog
- Software Delivery
- Synthetic Monitoring and Testing
- Tags
- Workflow Automation
- Learning Center
- Support
- Glossary
- Standard Attributes
- Guides
- Agent
- Integrations
- Developers
- Authorization
- DogStatsD
- Custom Checks
- Integrations
- Create an Agent-based Integration
- Create an API Integration
- Create a Log Pipeline
- Integration Assets Reference
- Build a Marketplace Offering
- Create a Tile
- Create an Integration Dashboard
- Create a Monitor Template
- Create a Cloud SIEM Detection Rule
- OAuth for Integrations
- Install Agent Integration Developer Tool
- Service Checks
- IDE Plugins
- Community
- Guides
- OpenTelemetry
- Administrator's Guide
- API
- Partners
- Datadog Mobile App
- DDSQL Reference
- CoScreen
- CoTerm
- Cloudcraft (Standalone)
- In The App
- Dashboards
- Notebooks
- DDSQL Editor
- Reference Tables
- Sheets
- Monitors and Alerting
- Metrics
- Watchdog
- Bits AI
- Software Catalog
- Error Tracking
- Change Tracking
- Service Management
- Actions & Remediations
- Infrastructure
- Cloudcraft
- Resource Catalog
- Universal Service Monitoring
- Hosts
- Containers
- Processes
- Serverless
- Network Monitoring
- Cloud Cost
- Application Performance
- APM
- Continuous Profiler
- Database Monitoring
- Agent Integration Overhead
- Setup Architectures
- Setting Up Postgres
- Setting Up MySQL
- Setting Up SQL Server
- Setting Up Oracle
- Setting Up Amazon DocumentDB
- Setting Up MongoDB
- Connecting DBM and Traces
- Data Collected
- Exploring Database Hosts
- Exploring Query Metrics
- Exploring Query Samples
- Exploring Database Schemas
- Exploring Recommendations
- Troubleshooting
- Guides
- Data Streams Monitoring
- Data Jobs Monitoring
- Digital Experience
- Real User Monitoring
- Synthetic Testing and Monitoring
- Continuous Testing
- Product Analytics
- Software Delivery
- CI Visibility
- CD Visibility
- Test Optimization
- Quality Gates
- DORA Metrics
- Security
- Security Overview
- Cloud SIEM
- Code Security
- Cloud Security
- App and API Protection
- Workload Protection
- Sensitive Data Scanner
- AI Observability
- Log Management
- Observability Pipelines
- Log Management
- Administration
Analysis Features
Join the Preview!
Advanced Analysis is in Preview. To enable, reach out to your Customer Success Manager.
Overview
The analysis feature in Notebooks allows you to perform advanced analysis on your Datadog data. You can join multiple datasets, chain queries, and transform your data using either predefined transformations or SQL, while retaining the full capabilities that Notebooks provide.
Notebooks are collaborative text editors that allow you to embed Datadog graphs directly into your documents. While this is ideal for exploration and storytelling, deeper investigations might require more advanced control over data queries. The analysis features enable you to run queries that help you:
- Chain queries such as aggregating existing aggregated data or joining two sets of aggregating data.
- Join data across multiple log sources and other datasets.
- Perform advanced parsing, extract data, and add calculated fields at query time.
- Visualize transformed datasets with graphs.
Adding data to your notebook
To run complex queries in a notebook, first add a Data Source cell. There are two ways to do this:
From a notebook:
- Type
/datasourceand press Enter, or click the Data Source tile at the bottom of the page. - Type or select your desired data source from the drop down menu and press Enter.
- Enter your query. Reserved attributes from the filtered logs are automatically added as columns.
From the Log Explorer:
- Enter your query in the Log Explorer.
- Click Analyze in Notebooks.
- Check the Use as a computational data source box and select the notebook you want to use.
- A data source cell is added to the selected notebook with the same query you entered in the Log Explorer. By default, the columns shown in the Log Explorer are included in the data source cell.
Configuring a data source cell
After adding a data source cell to a notebook, you can continue modifying it to structure the data to suit your analysis needs.
Change the time frame for the data
By default, data source cells created from Notebooks use the notebook’s global time frame. Data source cells created from the Log Explorer use a local time fixed to the time frame at the time of export.
You can switch any data source cell between a local or global time frame using the toggle button in the top right corner of the cell.
Filter the data source
Regardless of how you create the data source cell, you can modify the query using the search bar. Any changes to the query automatically re-run the data source cell and any downstream cells, updating the preview of the data.
Add or modify a column
You can add or modify columns in your data source cell. There are two ways to adjust the columns:
- In the preview section, click columns to search through available attributes for your data source.
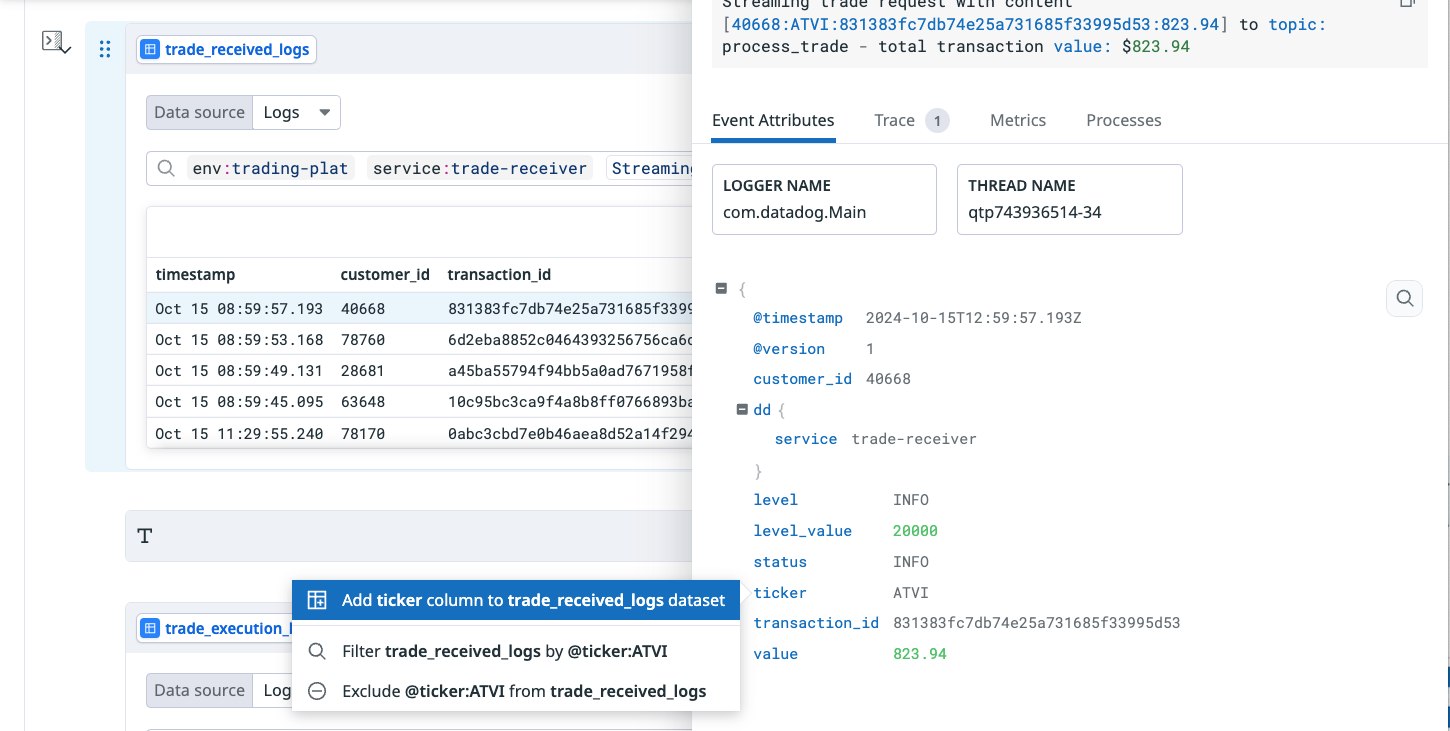
- In the preview, click on a row to open the detail side panel. Click the attribute you want to add as a column, and from the pop up option, select Add “@your_column” to your “@your_datasource” dataset.
Calculated fields queries
You can take existing Log Explorer queries that include Calculated Fields and open them in Notebooks. To transfer these queries from the Log Explorer, click More and select Analyze in Notebooks. The Calculated Fields automatically convert into a Transformation cell.
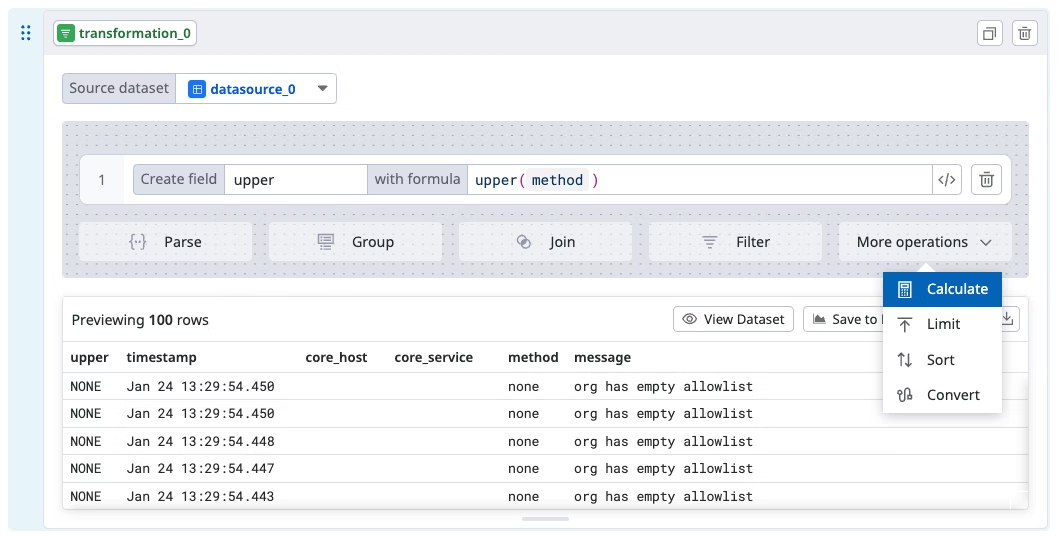
You can also create Calculated Fields directly within a notebook to define a computed field from existing data sources. These fields can be reused in subsequent analysis:
- Open a Workspace with a data source.
- Add a Transformation cell.
- Click More operations.
- Select Calculate.
Transforming and analyzing data
You can add various cell types to enhance your analysis capabilities. These cells enable you to include additional data sources, such as reference tables, RUM, or spans. Use SQL to join, transform, correlate, and visualize your data effectively. One of the key benefits of this approach is that cells that depend on other cells are automatically updated whenever a dependency changes, ensuring your analysis always reflects the most current data.
Transformation cell
Add a transformation cell to filter, group, join, or extract data defined in a data source cell.
- Type
/transformationand press Enter, or click on the transform dataset tile at the bottom of the page. - Select the data source you want to transform in the source dataset dropdown menu.
After adding the transformation cell, you can add any number of transformation operations inside the cell. Choose an operation from the list of supported transformations:
| Operation | Description |
|---|---|
| Parse | Enter grok syntax to extract data into a separate column. In the “from” dropdown menu, select the column the data is getting extracted from. |
| Group | Select what you want to group the data by in the dropdown menus. |
| Join | Select the type of join, the dataset to join against, and the fields to join on. |
| Filter | Add a filter query for the dataset. |
| Calculate | Add a name for the field and the function formula, using the calculated field expression language. |
| Limit | Enter the number of rows of the dataset you want to display. |
| Sort | Select the sort order and column to sort on. |
| Convert | Allows you to convert a column into a different type. Select the column and the column type to be converted. |
Analysis cell
You can also transform your data using SQL by adding an analysis cell to your notebook.
- Type
/sqlor/analysisand press Enter, or click the SQL Query tile at the bottom of the page. - In the source dataset dropdown, select the data source you want to transform.
- Write your SQL query. For supported SQL syntax, see the DDSQL Reference.
- Click Run in the top-right corner of the analysis cell to execute your query.
Visualizing transformed data
You can graph the data you’ve transformed using analysis cells inside a notebook, customizing the visualization with filters, aggregations, and appearance settings.
To graph your data:
- Type
/graphand press Enter, or click the graph dataset tile at the bottom of the page. - Type or select your desired data source from the drop down menu and press Enter.
- Select your visualization type from the graph menu and press Enter.
Viewing and exporting data
For any analysis cell that includes a dataset preview, you can view the full 100-row preview by clicking the View dataset button.
Export your query to a dashboard
You can save the results of any analysis cell to a dashboard by clicking Save to Dashboard and selecting an existing dashboard, or create a new one. Although this creates a sync between your notebook cell and the exported dashboard graph, changes to the query in your notebook do not automatically update the dashboard.
If you update the published cell or any upstream cells, a badge appears in the upper-right corner of the cell indicating unpublished changes. After you publish those changes, the updates sync to all dashboards where the query is used.
Note: By default, the dataset is tied to the global time frame of the dashboard, not to the time frame of the notebook. However, you have the ability to set a custom time frame on the dashboard widget.
Download dataset as a CSV
You can download data from cells for use in external tools or further processing outside of Datadog.
To download your dataset as a CSV file:
- Navigate to any analysis cell that contains a dataset.
- Click the download icon in the top-right corner of the cell.
- Select the number of rows you want to export (up to the maximum available).
- The CSV file automatically downloads to your computer.
Further reading
Additional helpful documentation, links, and articles:


