- Essentials
- Getting Started
- Datadog
- Datadog Site
- DevSecOps
- Serverless for AWS Lambda
- Agent
- Integrations
- Containers
- Dashboards
- Monitors
- Logs
- APM Tracing
- Profiler
- Tags
- API
- Service Catalog
- Session Replay
- Continuous Testing
- Synthetic Monitoring
- Incident Management
- Database Monitoring
- Cloud Security Management
- Cloud SIEM
- Application Security Management
- Workflow Automation
- CI Visibility
- Test Visibility
- Intelligent Test Runner
- Code Analysis
- Learning Center
- Support
- Glossary
- Standard Attributes
- Guides
- Agent
- Integrations
- OpenTelemetry
- Developers
- Authorization
- DogStatsD
- Custom Checks
- Integrations
- Create an Agent-based Integration
- Create an API Integration
- Create a Log Pipeline
- Integration Assets Reference
- Build a Marketplace Offering
- Create a Tile
- Create an Integration Dashboard
- Create a Recommended Monitor
- Create a Cloud SIEM Detection Rule
- OAuth for Integrations
- Install Agent Integration Developer Tool
- Service Checks
- IDE Plugins
- Community
- Guides
- API
- Datadog Mobile App
- CoScreen
- Cloudcraft
- In The App
- Dashboards
- Notebooks
- DDSQL Editor
- Sheets
- Monitors and Alerting
- Infrastructure
- Metrics
- Watchdog
- Bits AI
- Service Catalog
- API Catalog
- Error Tracking
- Service Management
- Infrastructure
- Application Performance
- APM
- Continuous Profiler
- Database Monitoring
- Data Streams Monitoring
- Data Jobs Monitoring
- Digital Experience
- Real User Monitoring
- Product Analytics
- Synthetic Testing and Monitoring
- Continuous Testing
- Software Delivery
- CI Visibility
- CD Visibility
- Test Visibility
- Intelligent Test Runner
- Code Analysis
- Quality Gates
- DORA Metrics
- Security
- Security Overview
- Cloud SIEM
- Cloud Security Management
- Application Security Management
- AI Observability
- Log Management
- Observability Pipelines
- Log Management
- Administration
Retool
Supported OS
Overview
Monitoring and analytics offer mission-critical insights, but developers often have to jump between separate, siloed, and often custom tools to take action on the insights-leading to inefficient or ineffective responses to those insights.
Retool helps developers create custom apps that embed directly into a Datadog dashboard, giving you the ability to take action and automate workflows without having to leave Datadog.

Metrics
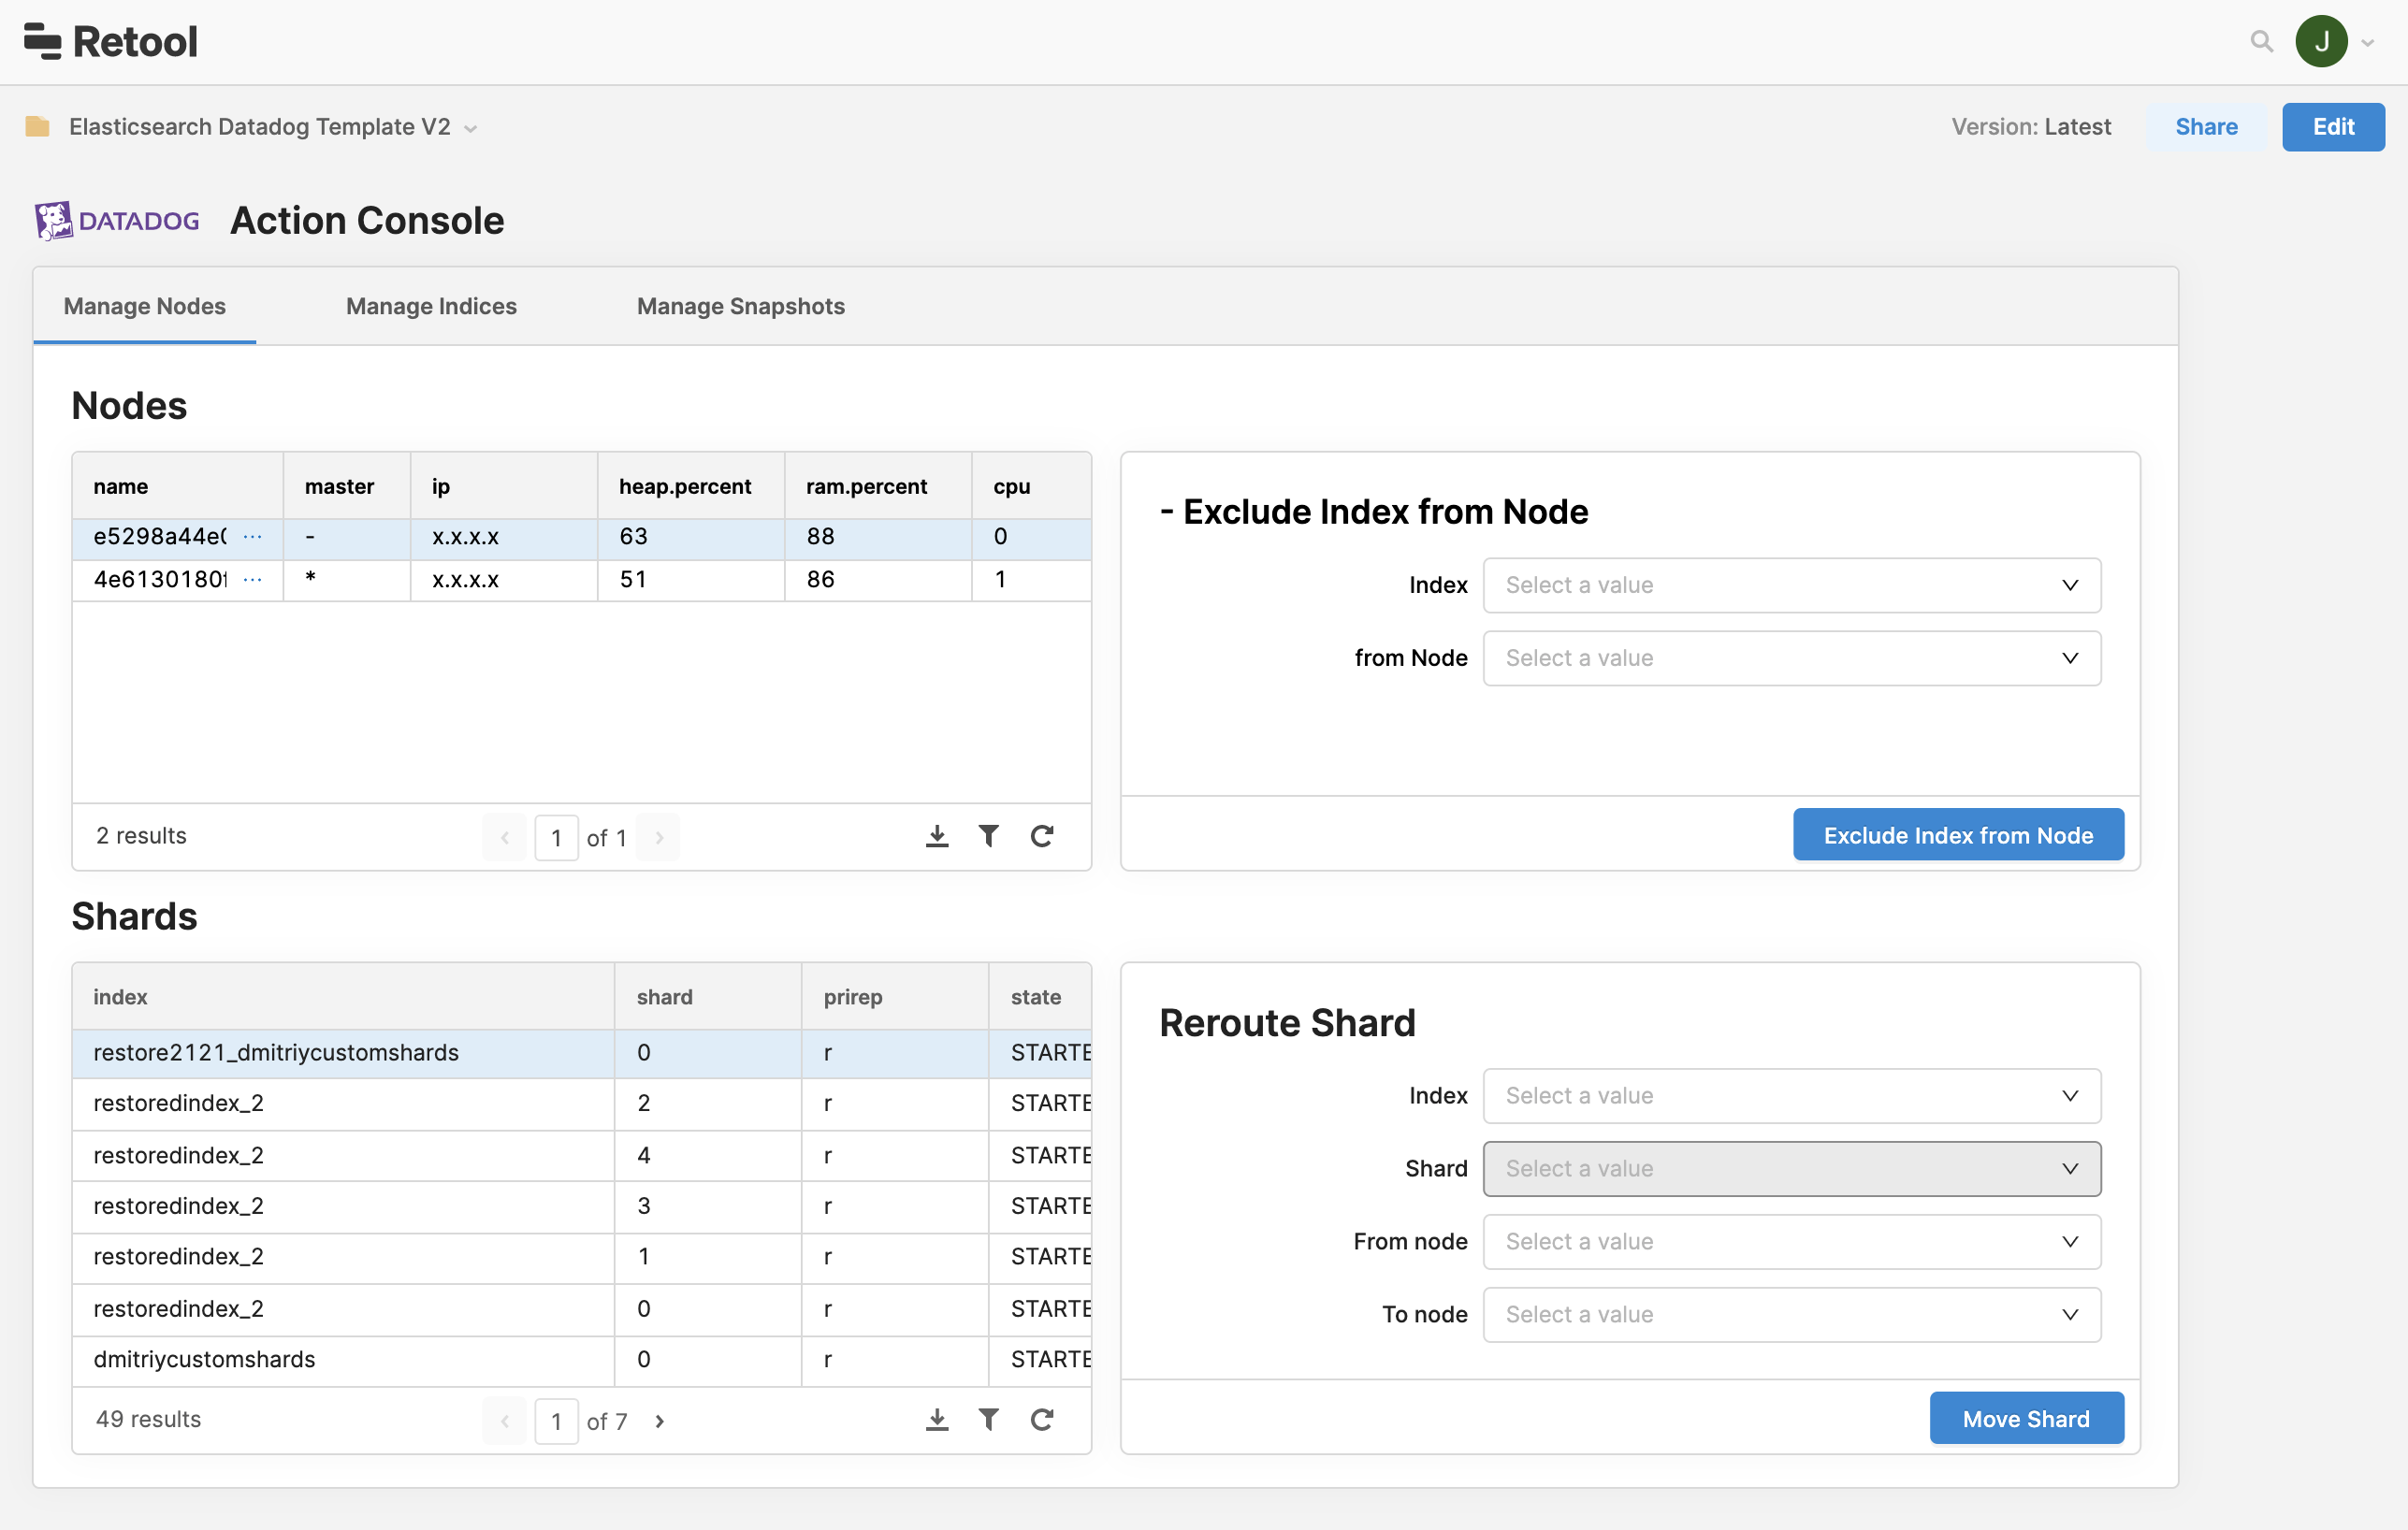
Datadog’s embedded Retool app for Elasticsearch Management combines existing visibility into key Elasticsearch metrics and logs with the power to manage clusters, accounts, and more without leaving your Datadog dashboard.
Dashboards
Retool built an embedded app for Elasticsearch Management. You can already monitor Elasticsearch metrics, traces, and logs in Datadog today. With the embedded app, developers can take action on their rich Datadog insights directly in the Datadog dashboard. These actions include:
- Add a new index with shards and replicas
- Manage nodes by rerouting shards and excluding indexes
- Create new snapshots and restore indexes
Setup
The Retool integration comes with an out-of-the-box dashboard, which allows you to sign up or log into Retool through an iframe.
You are prompted to connect to your ElasticSearch cluster with a connection string. This app is automatically added to your instance. You then need to click resources in the navbar and create a new Datadog resource (adding your api and application keys). Finally connect your Datadog resource to the two Datadog queries by selecting it from the select resource dropdown in the query editor.
Return to Datadog to see the app up and running in your dashboard. You can edit the app anytime to customize it for your DevOps workflows.
Data Collected
Metrics
The Retool integration does not include any metrics at this time.
Events
The Retool integration does not include any events at this time.
Service Checks
The Retool does not include any service checks at this time.
Troubleshooting
Need help? Contact Datadog support
