- Essentials
- Getting Started
- Datadog
- Datadog Site
- DevSecOps
- Serverless for AWS Lambda
- Agent
- Integrations
- Containers
- Dashboards
- Monitors
- Logs
- APM Tracing
- Profiler
- Tags
- API
- Service Catalog
- Session Replay
- Continuous Testing
- Synthetic Monitoring
- Incident Management
- Database Monitoring
- Cloud Security Management
- Cloud SIEM
- Application Security Management
- Workflow Automation
- CI Visibility
- Test Visibility
- Test Impact Analysis
- Code Analysis
- Learning Center
- Support
- Glossary
- Standard Attributes
- Guides
- Agent
- Integrations
- OpenTelemetry
- Developers
- Authorization
- DogStatsD
- Custom Checks
- Integrations
- Create an Agent-based Integration
- Create an API Integration
- Create a Log Pipeline
- Integration Assets Reference
- Build a Marketplace Offering
- Create a Tile
- Create an Integration Dashboard
- Create a Recommended Monitor
- Create a Cloud SIEM Detection Rule
- OAuth for Integrations
- Install Agent Integration Developer Tool
- Service Checks
- IDE Plugins
- Community
- Guides
- Administrator's Guide
- API
- Datadog Mobile App
- CoScreen
- Cloudcraft
- In The App
- Dashboards
- Notebooks
- DDSQL Editor
- Sheets
- Monitors and Alerting
- Infrastructure
- Metrics
- Watchdog
- Bits AI
- Service Catalog
- API Catalog
- Error Tracking
- Service Management
- Infrastructure
- Application Performance
- APM
- Continuous Profiler
- Database Monitoring
- Data Streams Monitoring
- Data Jobs Monitoring
- Digital Experience
- Real User Monitoring
- Product Analytics
- Synthetic Testing and Monitoring
- Continuous Testing
- Software Delivery
- CI Visibility
- CD Visibility
- Test Optimization
- Code Analysis
- Quality Gates
- DORA Metrics
- Security
- Security Overview
- Cloud SIEM
- Cloud Security Management
- Application Security Management
- AI Observability
- Log Management
- Observability Pipelines
- Log Management
- Administration
Notebooks
Overview
Notebooks combine graphs and text in a linear, cell-based format. They help you explore and share stories with your data by creating postmortems, investigations, runbooks, documentation, and more.
Getting started
From the Notebook List page, click + New Notebook.
Click the Save Notebook button.Note: A new notebook is not saved by default.
Add new cells to your notebook with supported graph and text content.
Collaboration
Notebooks support real-time collaboration. Presence indicators show who is viewing your notebook at any time, as well as real-time edits to notebook cells. Changes made to a notebook appear automatically, without the need to refresh.
Everyone on your team can open any notebook, but a notebook can only be modified or deleted by any Datadog role with the Notebooks Write permission.
Commenting
To add a comment, select some text or hover over a graph. The Add comment icon is displayed to the right of the cell. From the comments you can also notify a member on your team through the @mention feature. Click the three vertical dots in the top-right corner of your comment to edit or delete a comment you wrote. View or re-open resolved comments in the Comment History side panel, available in the Notebook cog menu.
Notebook authors receive email notifications for new comments on their notebooks, and commenters are notified for replies to their comments. Manage your notification settings through Notifications in the notebook cog menu.
View mode
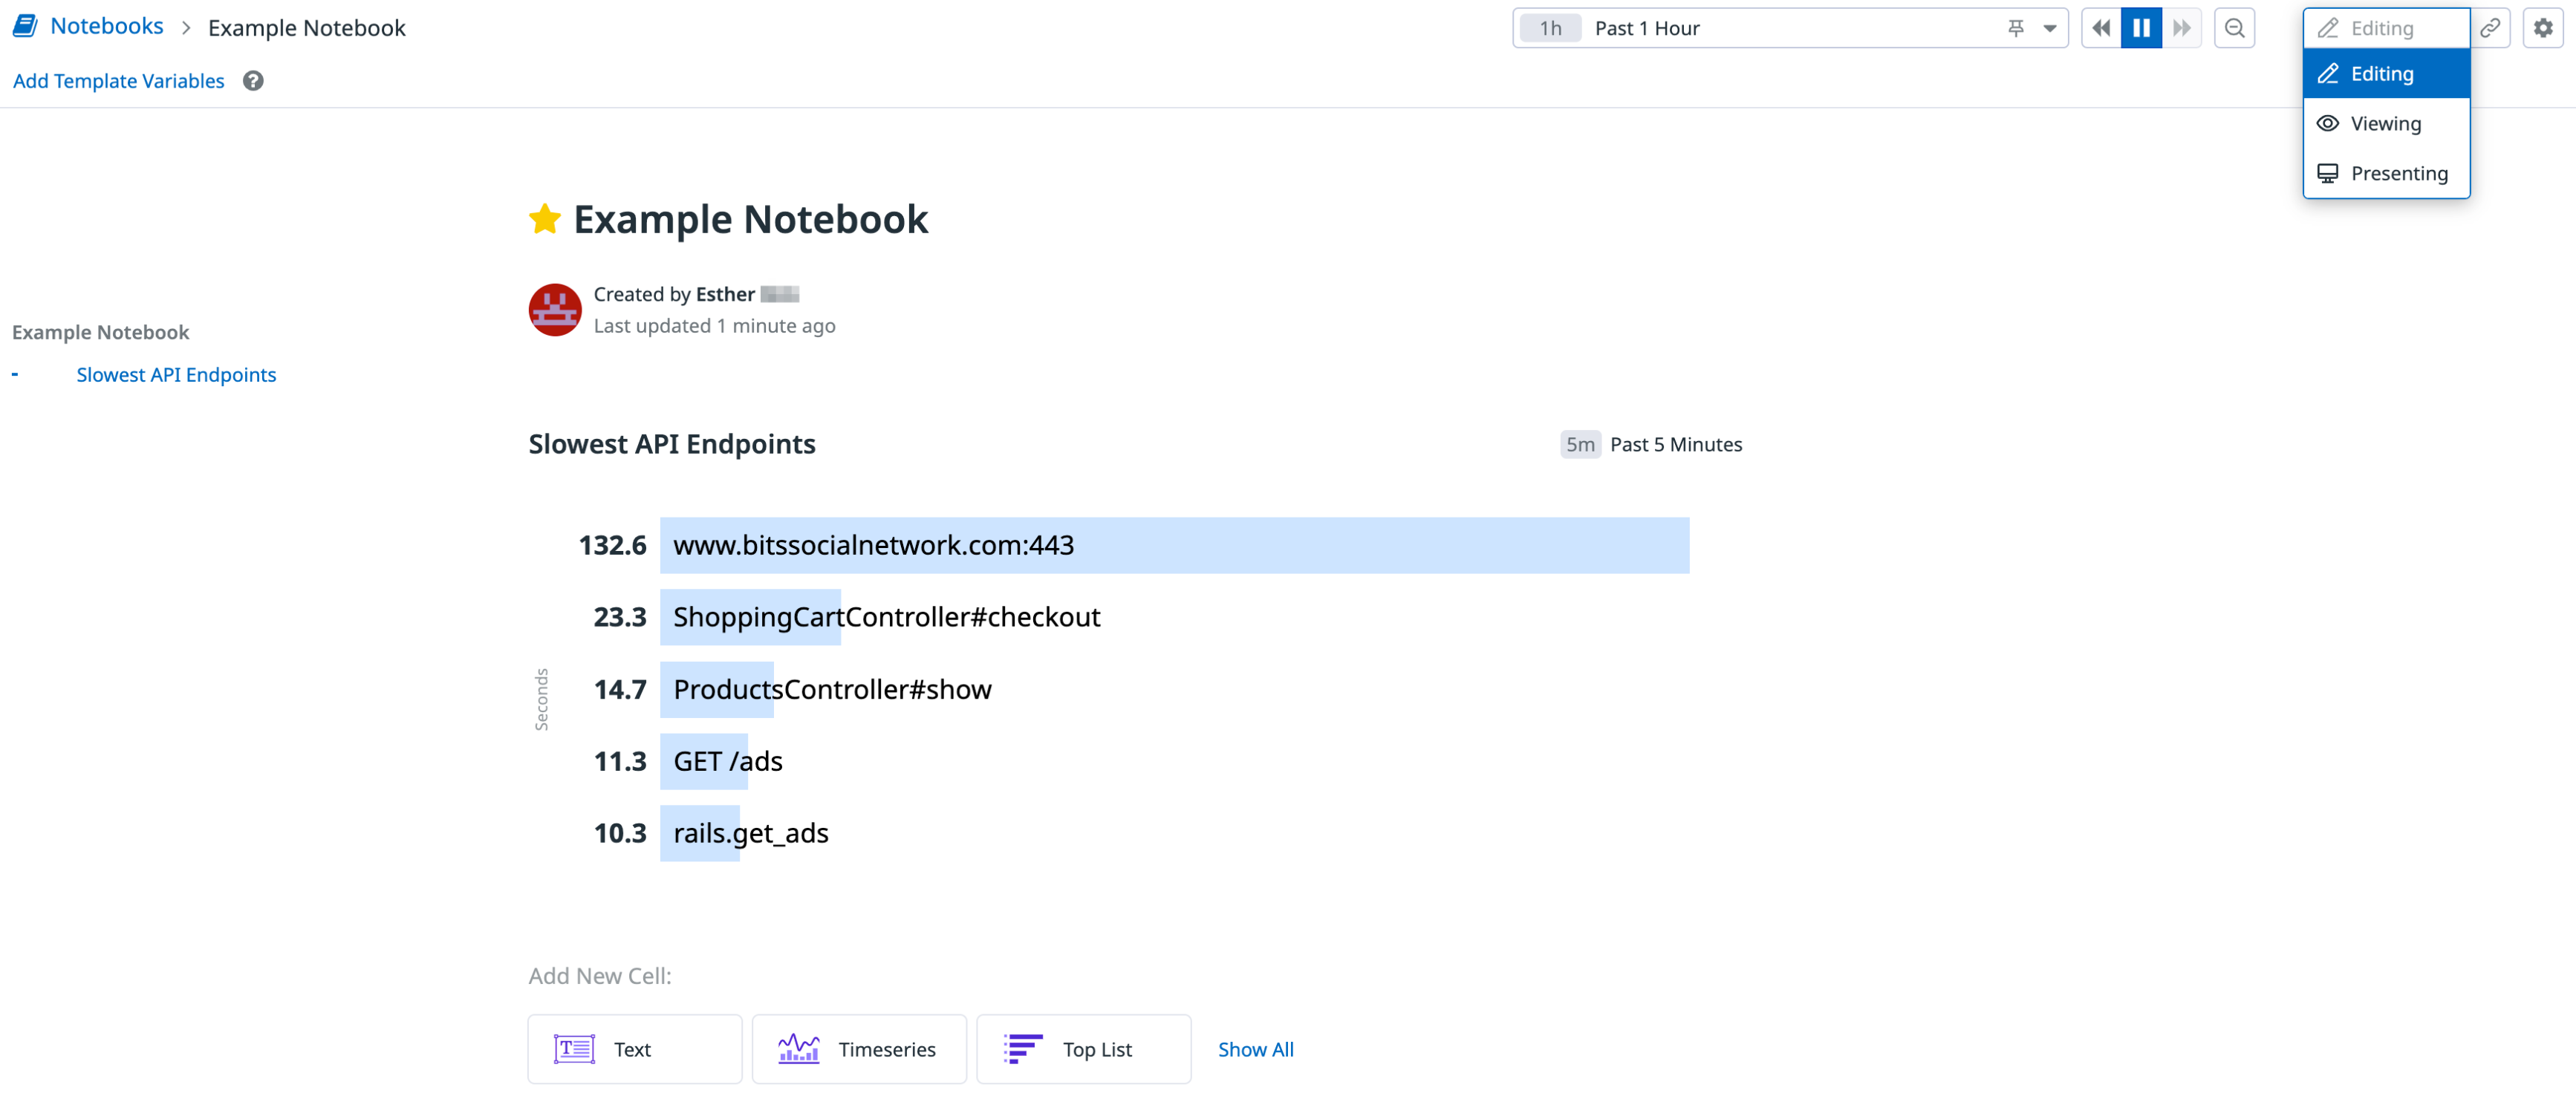
You can switch between modes from within the Notebook by selecting the dropdown at the top right of your notebook.
Editing: make changes to the notebook.
Viewing: contents are Read Only, preventing users from making unwanted edits to existing configurations and information.
Presenting: share the contents of the Notebook in a display format where each cell appears as a slide. Presentation mode supports graph interactions such as tooltips and legends.
Share notebooks
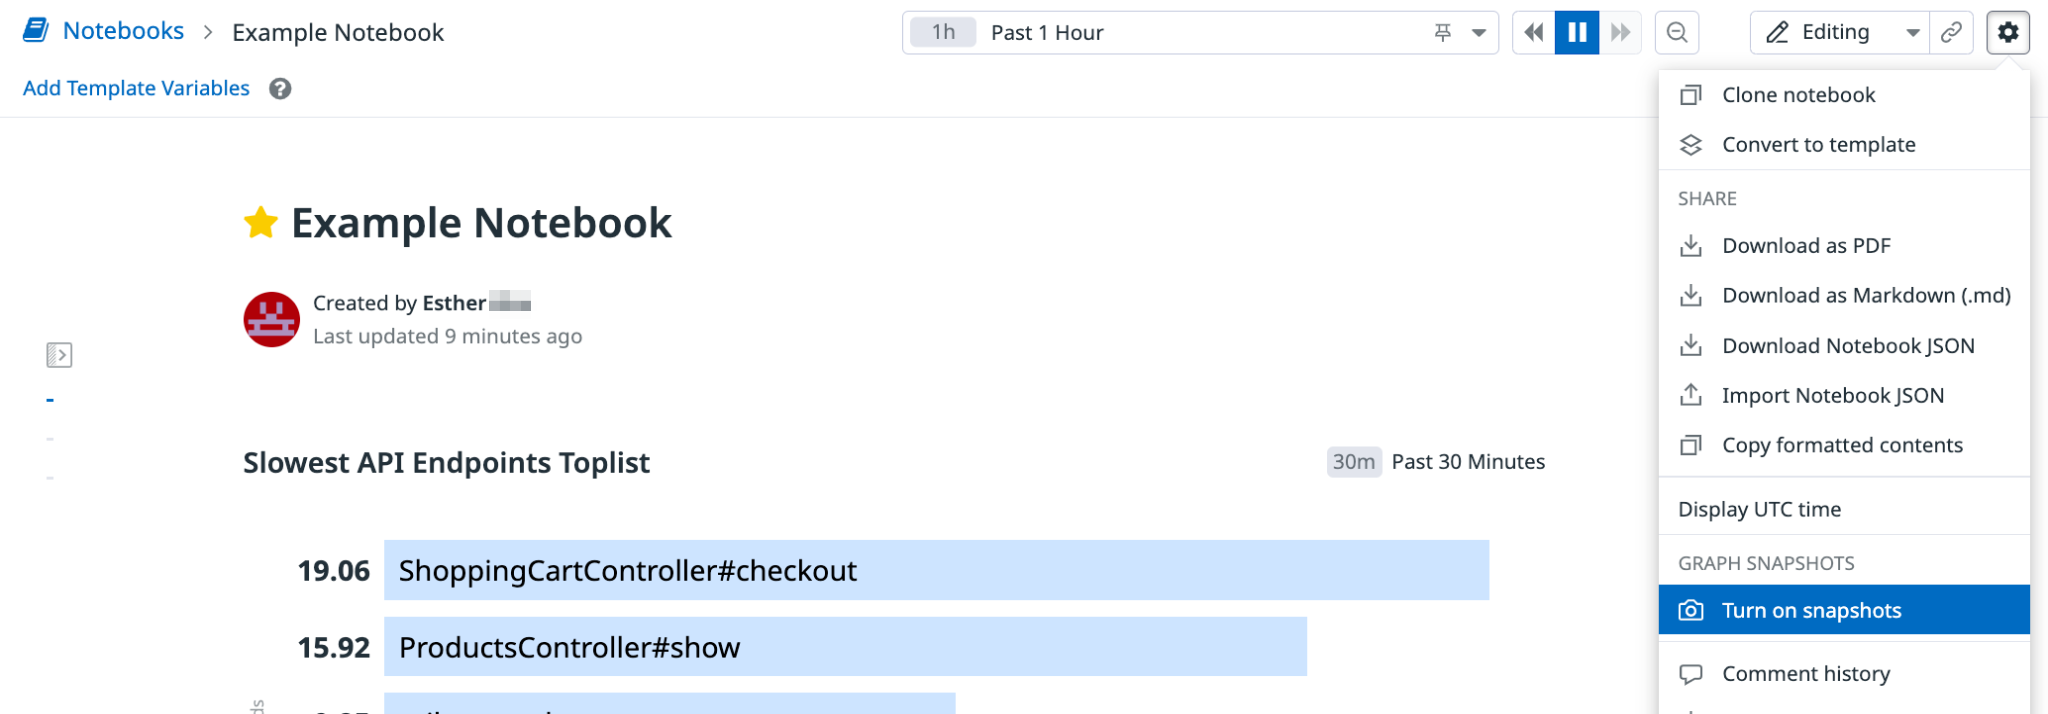
Click on the cog icon in the upper right of a notebook to see sharing options. Notebooks can be exported to PDF, Markdown, or any document editor.
To copy a notebook into a document editor, click Copy formatted contents. Paste into a document editor like Google Docs or Microsoft Word to see notebook contents, including graphs, with original formatting.
Import or export notebook JSON
Use Export Notebook JSON to download a JSON file containing the definition of your notebook. Import Notebook JSON overwrites all content on the notebook with the content of the uploaded JSON.
Link to individual cells
To copy the URL for a specific cell, click the cell’s Share menu and select Link directly to cell. Direct linking is available for both visualization and Markdown cells.
When a user visits the URL for a specific cell, the notebook is opened to show the cell at the top of the viewport. Links are absolute. A cell’s URL remains the same even if it is moved to a new position within the notebook.
Add images to notebooks
Only PNG, JPG, JPEG, and GIF file types are supported. Uploads have a max file size of 4MB.
You can add images to your notebook using either the image cell or the Markdown editor.
Image cell
This approach places the image in a separate cell from your text, and provides options for resizing, aligning, and captioning the image. Images uploaded by the image cell are hosted by Datadog.
To add an image, click the Image cell option in the Add New Cell menu.
You can use any of the following options to upload an image to be hosted by Datadog:
- Drop an image file into the upload area
- Click Choose File and locate the image in your file directory
- Paste a publicly accessible URL for the image
Click the icons on the cell action tray to adjust the size, alignment, add a caption for the image cell, or view the image in full screen mode.
Markdown editor
This approach places the image inline with your text, but does not provide options for resizing the image.
Enter the edit mode on any Markdown cell and use any of the following options to add the image:
- Drop an image file into the text cell area.
- Copy and paste the image directly into the text cell area.
- Hyperlink an external image using the image widget in the header or by referencing the official Markdown guide. Note: This option does not upload the image to be hosted by Datadog.
You can preview the image in the Preview tab before saving it to your notebook.
Notebook List
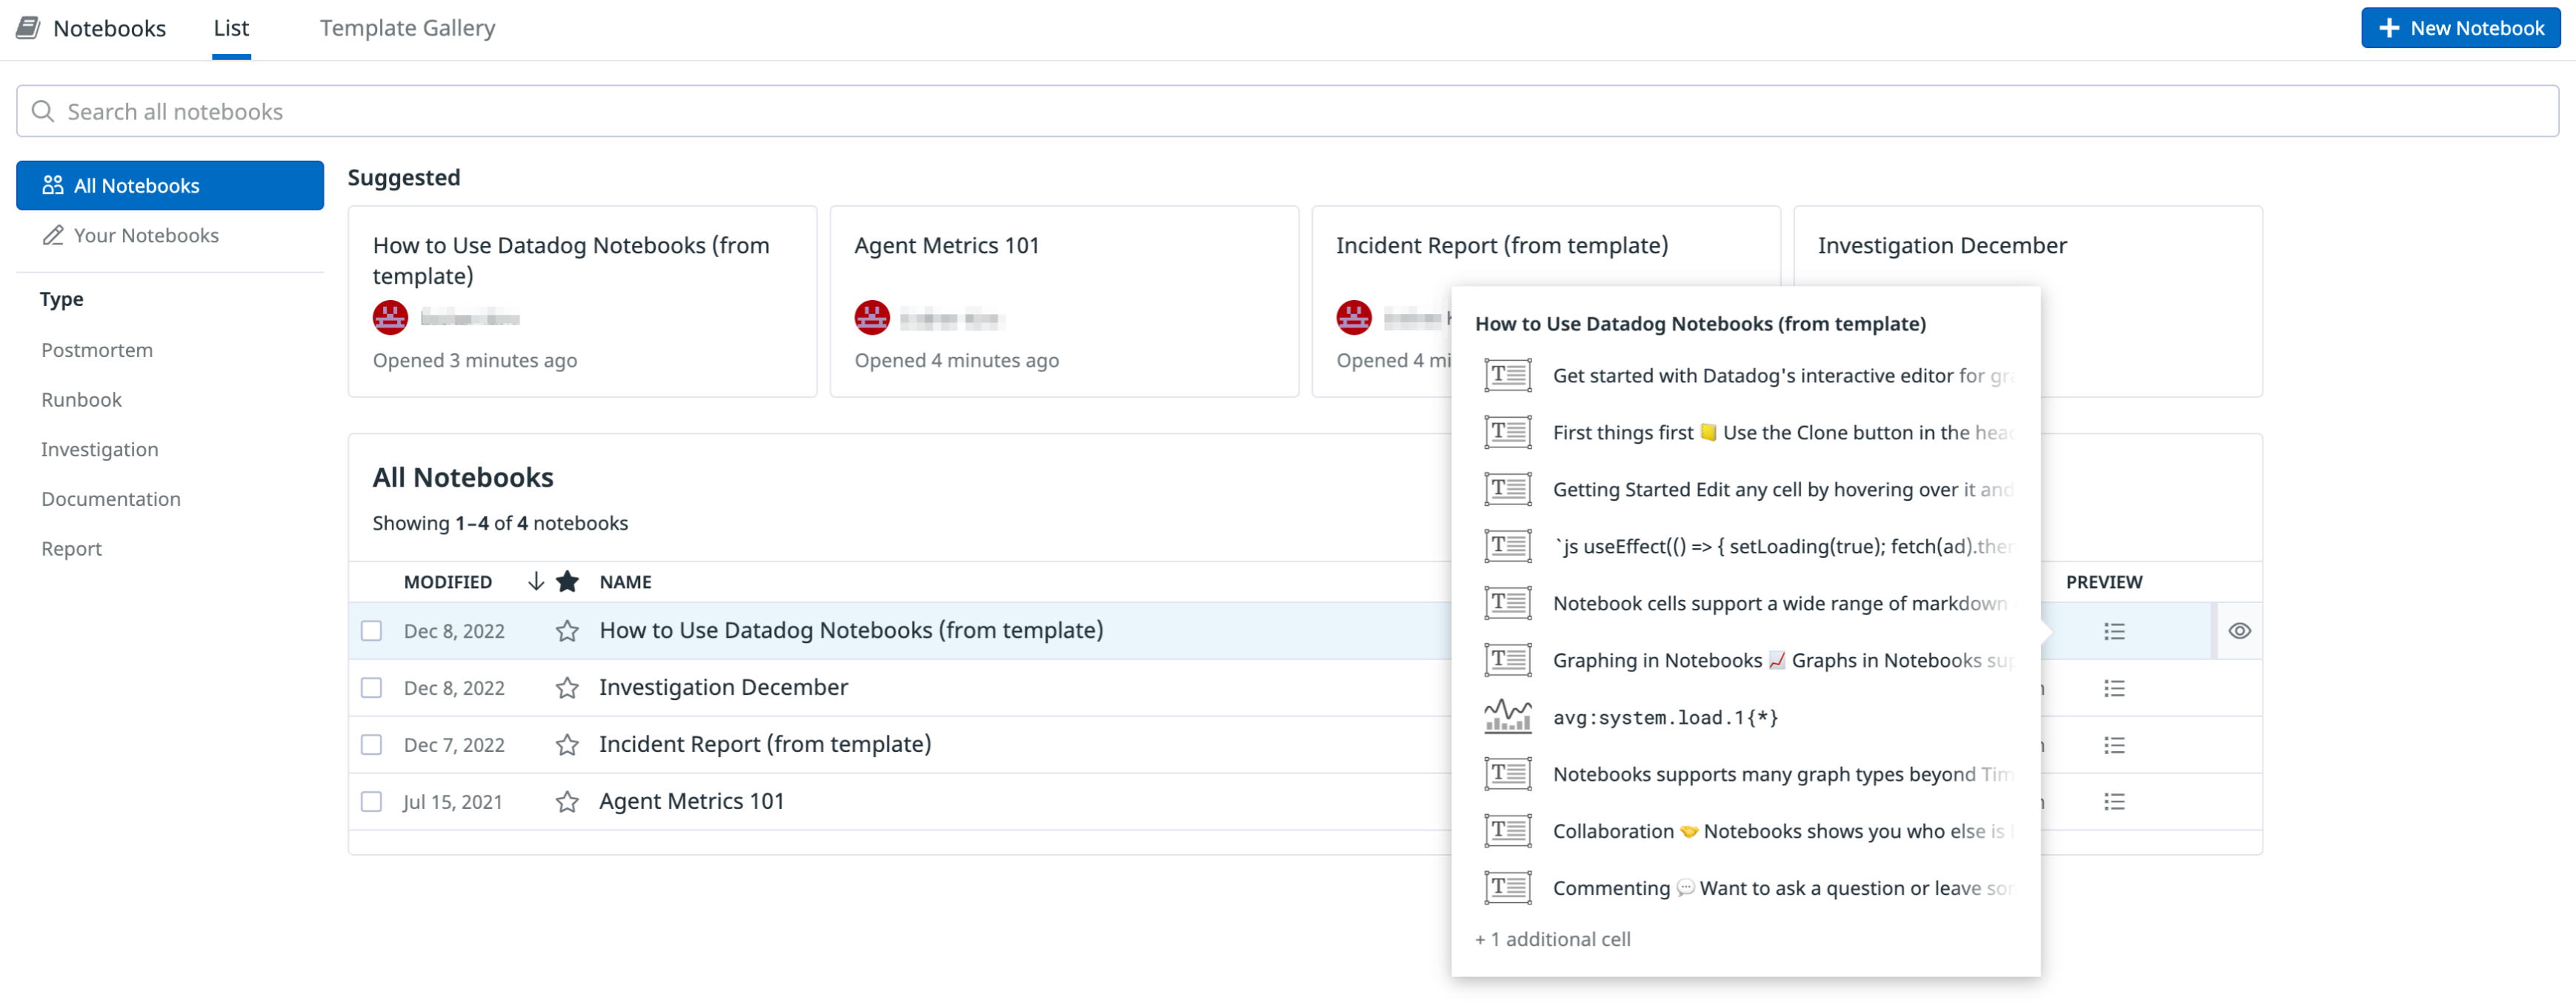
The Notebook List allows you to view and search previously created notebooks. Each notebook’s name, creator, and last modified date are displayed. Notebooks are grouped by:
- Your Notebooks: Notebooks created by you.
- All Notebooks: All Notebooks in your organization.
- Notebook Type: Group notebooks by type.
Hover over the Preview icon for any Notebook to see a preview of the contents, including widget types and Markdown. To open the Notebook in View Mode, hover over the notebook and click Open notebook in view mode on the right.
Template gallery
From the Template Gallery, see ready-to-use templates which you can create new notebooks from. Templates include an Incident Response postmortem, an Incident Report, and SLO Specification. You can also create a new custom template to build reusable notebook structures.
Version history
From a notebook, click the Configure icon and click Version history to open the Version History side panel. You can preview, restore, or clone your notebook’s version history. For more information, see the Version History guide.
Notebook configuration
Time frames
By default, all graph cells are linked to the global time frame set in the notebook header.
To view a different time frame, select an option in the global time picker, or scrub on a graph directly. The notebook URL will update to reflect this new time frame without saving it to the notebook.
Note: Clicking and dragging to zoom in on a graph does not unlock the cell from the global time. It changes the notebook’s global time instead.
To save this time as the notebook’s default, click Set Default Time. To reset your global time back to the previously saved default global time, click the reset button.
Individual cells can be unlinked from the global time and set to an independent time frame.
To view a different time frame on a single cell, edit the cell and use the toggle to unlink it from Global Time. Change the time frame using the time picker or by scrubbing on the graph. Changes made in edit mode are saved automatically when you click Done. To discard your changes, click Cancel instead of Done.
Notebook types
Notebooks can be grouped into types, giving you quick access to relevant information. Notebooks built from other products like Incident Management or Monitors may automatically assign a type. Hover over the notebook title to display the option to add or edit the type. Click + Add Type, or to edit the type, click the pencil icon that appears next to it on hover.
Graph snapshots
Notebooks can be set to automatically take snapshots of graphs that might expire. Enable this by clicking Turn on snapshots in the cog menu of any notebook. Use the cog menu to view snapshots or turn off automatic snapshots. Turn off automatic snapshots to remove access to existing snapshots.
Notebooks with snapshots enabled automatically capture a static image of any graphs with a fixed time range (for example, Aug 18, 12:00 am - Aug 19, 11:59 pm). These snapshots update when the graph is updated, as long as the new graph also has a fixed time range. Changing the graph to a global time range (like Past 1 Hour) removes the snapshot.
You can preview the existing snapshot on any fixed-time graph by hovering over the camera icon while in edit mode.
To share a version of your notebook with snapshots, from the cog menu, click View snapshots. Copy the URL, or append &view=snapshots to the URL of any notebook that has snapshots enabled.
Template variables
Notebooks support template variables. Dynamically scope visualizations by adding and selecting template variable values. For more information, see Template Variables.
Cell configuration
To add cells, use the + button that appears to the left of the cell, or select an option from the Add New Cell section at the bottom of the notebook. Use the action tray that appears above the cell on hover to share, clone, or delete cells. Graph cells can be exported to a dashboard, or downloaded as a PNG or a CSV of graph data. Changes made in edit mode are saved automatically when you click Done. To discard your changes, click Cancel instead of Done.
Edit options
Click on More options in the inline editor of a widget to edit widget options. Add details like event overlays, markers, and y-axis controls.
Layout options
In a Notebook cell, click Edit to view the cell configuration in edit mode. You can also see the available layout options, which vary based on the cell content type, but include the following:
- Graph size: Choose between
XS,S,M(default),L, andXL. - Graph legend: Uncheck the box to hide the legend. Legends are automatically disabled for
XSandSgraphs. - Grouping: Display one graph per tag value to see small multiples of your visualization.
Note: Changing any of these settings only affects the targeted cell.
Types of content
Notebooks support visualizations and text cells. Text cells are formatted with Markdown, which enables the use of headings, subheadings, links, images, lists, and code blocks. Notebooks also support diagrams formatted with MermaidJS.
Graphs in notebooks support all Datadog data sources: metrics, log events, Indexed Spans, live processes, network traffic, RUM events, profiling metrics, security signals, and more. Graphs are created with the Datadog query editor. Notebooks support:
- Text
- Images
- Timeseries
- Top List
- Table
- Query Value
- Heatmap
- Distribution
- List
- Profiling Flame Graph
- Funnel
- Pie
- Treemap
- Geomap
- SLO
Limit edit access
By default, all users have full access to notebooks.
Use granular access controls to limit the roles that may edit a particular notebook:
- While viewing a notebook, click on the cog in the upper right. The settings menu opens.
- Select Permissions.
- Click Restrict Access.
- The dialog box updates to show that members of your organization have Viewer access by default.
- Use the dropdown to select one or more roles, teams, or users that may edit the notebook.
- Click Add.
- The dialog box updates to show that the role you selected has the Editor permission.
- Click Save
Note: To maintain your edit access to the notebook, the system requires you to include at least one role that you are a member of before saving.
To restore general access to a notebook with restricted access, follow the steps below:
- While viewing the notebook, click on the cog in the upper right. The settings menu opens.
- Select Permissions.
- Click Restore Full Access.
- Click Save.
Further Reading
Additional helpful documentation, links, and articles:


