- Essentials
- Getting Started
- Agent
- API
- APM Tracing
- Containers
- Dashboards
- Database Monitoring
- Datadog
- Datadog Site
- DevSecOps
- Incident Management
- Integrations
- Internal Developer Portal
- Logs
- Monitors
- OpenTelemetry
- Profiler
- Session Replay
- Security
- Serverless for AWS Lambda
- Software Delivery
- Synthetic Monitoring and Testing
- Tags
- Workflow Automation
- Learning Center
- Support
- Glossary
- Standard Attributes
- Guides
- Agent
- Integrations
- Developers
- Authorization
- DogStatsD
- Custom Checks
- Integrations
- Create an Agent-based Integration
- Create an API Integration
- Create a Log Pipeline
- Integration Assets Reference
- Build a Marketplace Offering
- Create a Tile
- Create an Integration Dashboard
- Create a Monitor Template
- Create a Cloud SIEM Detection Rule
- OAuth for Integrations
- Install Agent Integration Developer Tool
- Service Checks
- IDE Plugins
- Community
- Guides
- OpenTelemetry
- Administrator's Guide
- API
- Partners
- Datadog Mobile App
- DDSQL Reference
- CoScreen
- CoTerm
- Cloudcraft (Standalone)
- In The App
- Dashboards
- Notebooks
- DDSQL Editor
- Reference Tables
- Sheets
- Monitors and Alerting
- Metrics
- Watchdog
- Bits AI
- Internal Developer Portal
- Error Tracking
- Change Tracking
- Service Management
- Actions & Remediations
- Infrastructure
- Cloudcraft
- Resource Catalog
- Universal Service Monitoring
- Hosts
- Containers
- Processes
- Serverless
- Network Monitoring
- Cloud Cost
- Application Performance
- APM
- APM Terms and Concepts
- Application Instrumentation
- APM Metrics Collection
- Trace Pipeline Configuration
- Correlate Traces with Other Telemetry
- Trace Explorer
- Recommendations
- Code Origins for Spans
- Service Observability
- Endpoint Observability
- Dynamic Instrumentation
- Live Debugger
- Error Tracking
- Data Security
- Guides
- Troubleshooting
- Continuous Profiler
- Database Monitoring
- Agent Integration Overhead
- Setup Architectures
- Setting Up Postgres
- Setting Up MySQL
- Setting Up SQL Server
- Setting Up Oracle
- Setting Up Amazon DocumentDB
- Setting Up MongoDB
- Connecting DBM and Traces
- Data Collected
- Exploring Database Hosts
- Exploring Query Metrics
- Exploring Query Samples
- Exploring Database Schemas
- Exploring Recommendations
- Troubleshooting
- Guides
- Data Streams Monitoring
- Data Jobs Monitoring
- Data Observability
- Digital Experience
- Real User Monitoring
- Synthetic Testing and Monitoring
- Continuous Testing
- Product Analytics
- Software Delivery
- CI Visibility
- CD Visibility
- Deployment Gates
- Test Optimization
- Quality Gates
- DORA Metrics
- Security
- Security Overview
- Cloud SIEM
- Code Security
- Cloud Security
- App and API Protection
- Workload Protection
- Sensitive Data Scanner
- AI Observability
- Log Management
- Observability Pipelines
- Log Management
- Administration
Investigate Alerts
Get started with alert investigations
You can configure Bits to automatically investigate when a monitor triggers an alert, or you can manually start an investigation as needed.
Enable Bits on monitors for automated investigations
There are a few ways to enable Bits for automated investigations:
- Option 1: Use the Bits-Enabled Monitors list
- In Bits AI, go to the Bits-Enabled Monitors page.
- In the Monitors tab, select one or more monitors, then click Enable Bits AI.
- Option 2: Add the Bits AI tag to a single monitor
- Open a monitor, click on the gear icon in the upper right corner, and select Edit.
- Add the
bitsai:enabledtag. - Save your changes.
- Option 3: Add the Bits AI tag in bulk
- In the Monitor List, select multiple monitors, then click Edit tags.
- Add the
bitsai:enabledtag to the selected monitors.
You can also add the tag to your desired monitors using the Datadog API or Terraform.
An investigation initiates when a monitor transitions to the alert state. Transitions to the warn or no data state, renotifications, and test notifications do not trigger investigations. Additionally, noisy monitors are automatically rate-limited to avoid unnecessary investigations and protect your budget.
Manually start an investigation
Alternatively, you can manually invoke Bits on an individual monitor event.
- Option 1: Monitor Status Page
- On the monitor status page, select an alert event, then click Investigate with Bits AI.
- Option 2: Monitor Event Side Panel
- On the monitor event side panel, click Investigate with Bits AI.
- Option 3: Slack
- In Slack, reply to a monitor notification with
@Datadog Investigate this alert.
- In Slack, reply to a monitor notification with
Monitor requirements for Bits AI SRE
Bits is able to run investigations on monitors that fulfill all three of the following requirements:
Monitor Type: The monitor must be a metric, logs, APM (
query_alerttype only), anomaly, forecast, integration, or outlier monitor.Service scope: The monitor must have one of the following:
- A monitor query filtered by a service
- A monitor query grouped by a service
- A service tag on the monitor
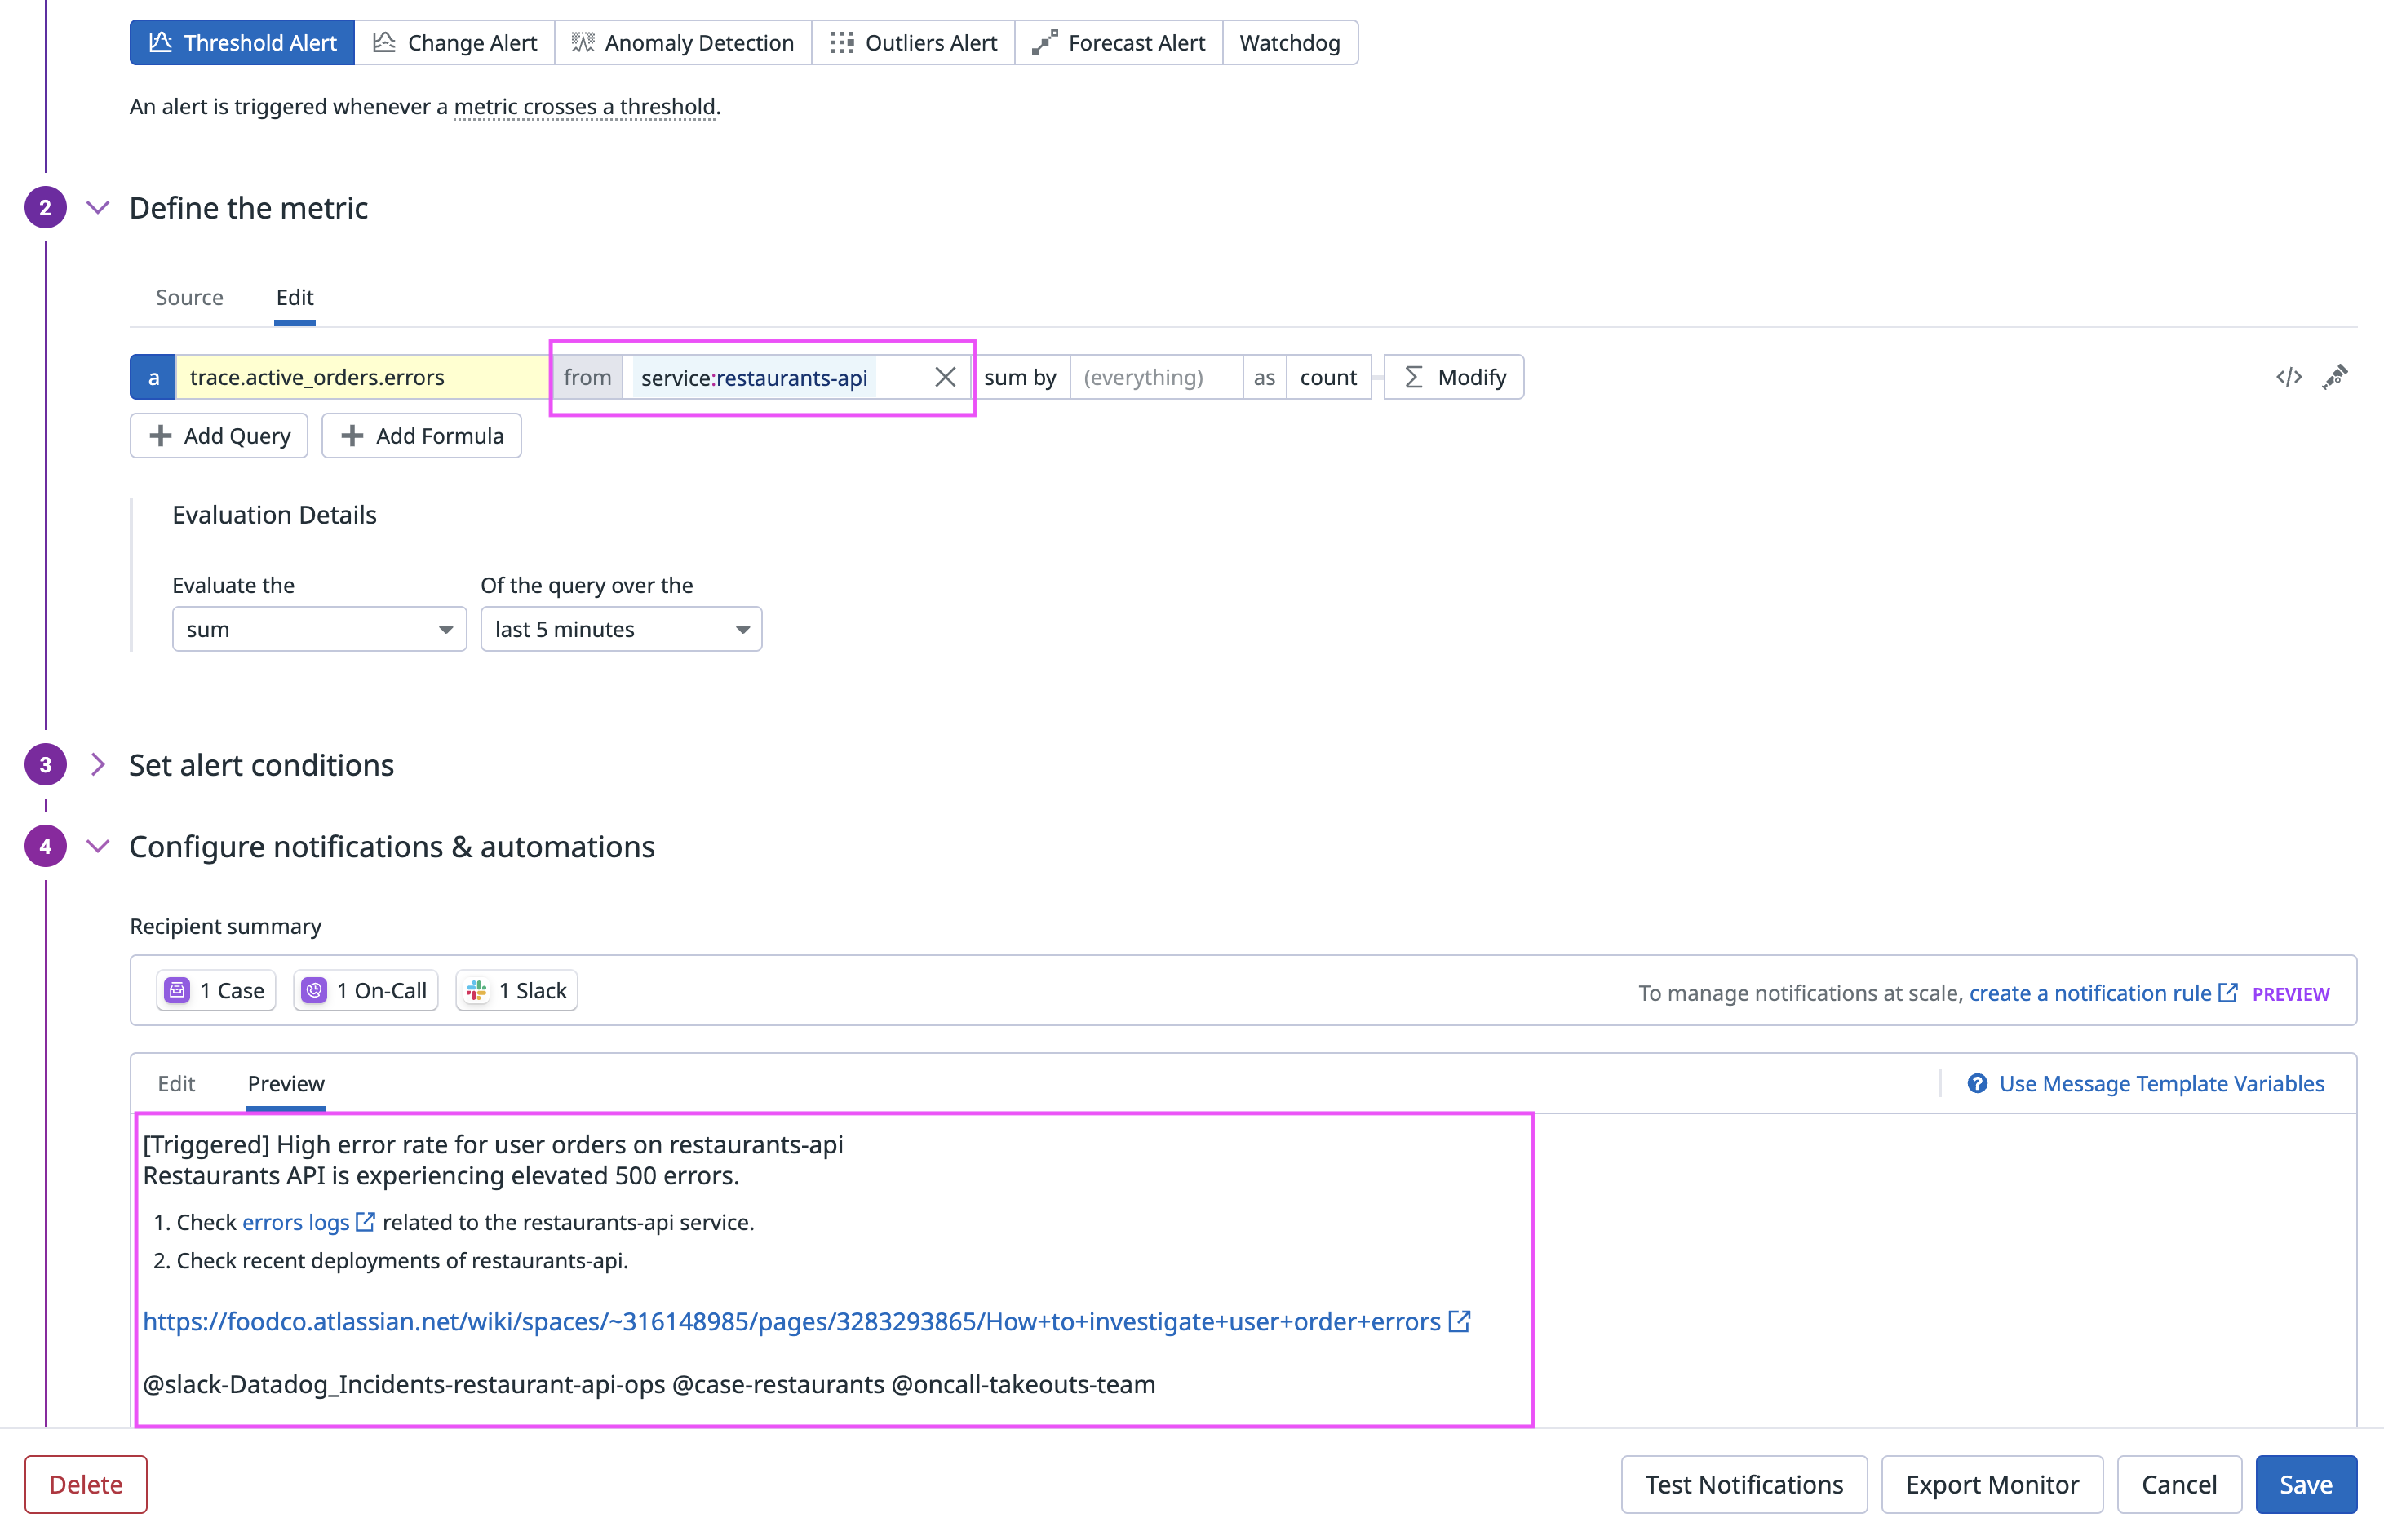
Telemetry links: For metric, anomaly, forecast, integration, and outlier monitors, the monitor message must include at least one helpful Datadog link:
- A Datadog dashboard: A custom or an integration dashboard. Host dashboards are not supported.
- A logs query
- A trace query
- A Datadog notebook with helpful widgets
Think of the first page you’d navigate to in Datadog if this monitor were to fire. These links provide Bits with valuable context to kickstart its investigation. Links are not required for APM and log monitors.
Configure where investigation results are sent
Bits can send investigation results to several destinations. By default, results appear in two places:
- Full investigation results are available on the Bits AI Investigations page.
- A summary of the results is available on the status page for the monitor.
Additionally, if you have already configured @slack or @case notifications in your monitor, Bits automatically writes to those places. If not, you can add them as destinations for investigation results to appear:
Slack
Slack
- Ensure the Datadog Slack app is installed in your workspace.
- Go to Bits AI > Settings > Integrations and connect your Slack workspace.
- Go to a monitor. Under Configure notifications and automations, add the
@slack-{channel-name}handle to send results to Slack.
Case Management
Case Management
In the Configure notifications and automations section, add the @case-{project-name} handle.
How Bits AI SRE investigates
Investigations happen in two phases:
- Initial context gathering
- Bits begins by identifying any Datadog links that you have added to the monitor’s message and uses them as entry points into the investigation.
- It also automatically queries your Datadog environment to gather additional context about what’s happening around the alert.
- If you have previously interacted with an investigation for the same monitor, Bits will recall any memories associated with the monitor to inform and accelerate the current investigation.
- Root cause hypothesis generation and testing
- Using the gathered context, Bits performs a more thorough investigation by building multiple root cause hypotheses and testing them in parallel. Today, Bits is able to query:
- Metrics
- Traces
- Logs
- Dashboards
- Change events
- Watchdog alerts
- Monitor alerts
- Incidents
- Hypotheses can end in one of three states: validated, invalidated, or inconclusive.
- Using the gathered context, Bits performs a more thorough investigation by building multiple root cause hypotheses and testing them in parallel. Today, Bits is able to query:
Chat with Bits AI SRE about the investigation
On the Bits AI Investigations page, you can chat with Bits to gather additional information about the investigation or the services involved. Click the Suggested replies bubble for examples.
| Functionality | Example prompts | Data source |
|---|---|---|
| Understand the status of its investigation | What's the latest status of the investigation? | Investigation findings |
| Ask for elaborations of its findings | Tell me more about the {issue}. | Investigation findings |
| Look up information about a service | Are there any ongoing incidents for {example-service}? | Software Catalog service definitions |
| Find recent changes for a service | Were there any recent changes on {example-service}? | Change Tracking events |
| Find a dashboard | Give me the {example-service} dashboard. | Dashboards |
| Query APM request, error, and duration metrics | What's the current error rate for {example-service}? | APM metrics |
Help Bits AI SRE learn
Reviewing Bits’ findings not only validates their accuracy, but also helps Bits learn from any mistakes it makes, enabling it to produce faster and more accurate investigations in the future.
During the investigation
You can guide Bits’ learning by:
- Improving a step: Share a link to a better query Bits should have made.
- Remembering a step: Tell Bits to remember any helpful queries it generated. This instructs Bits to prioritize running these queries the next time the same monitor fires.
After the investigation
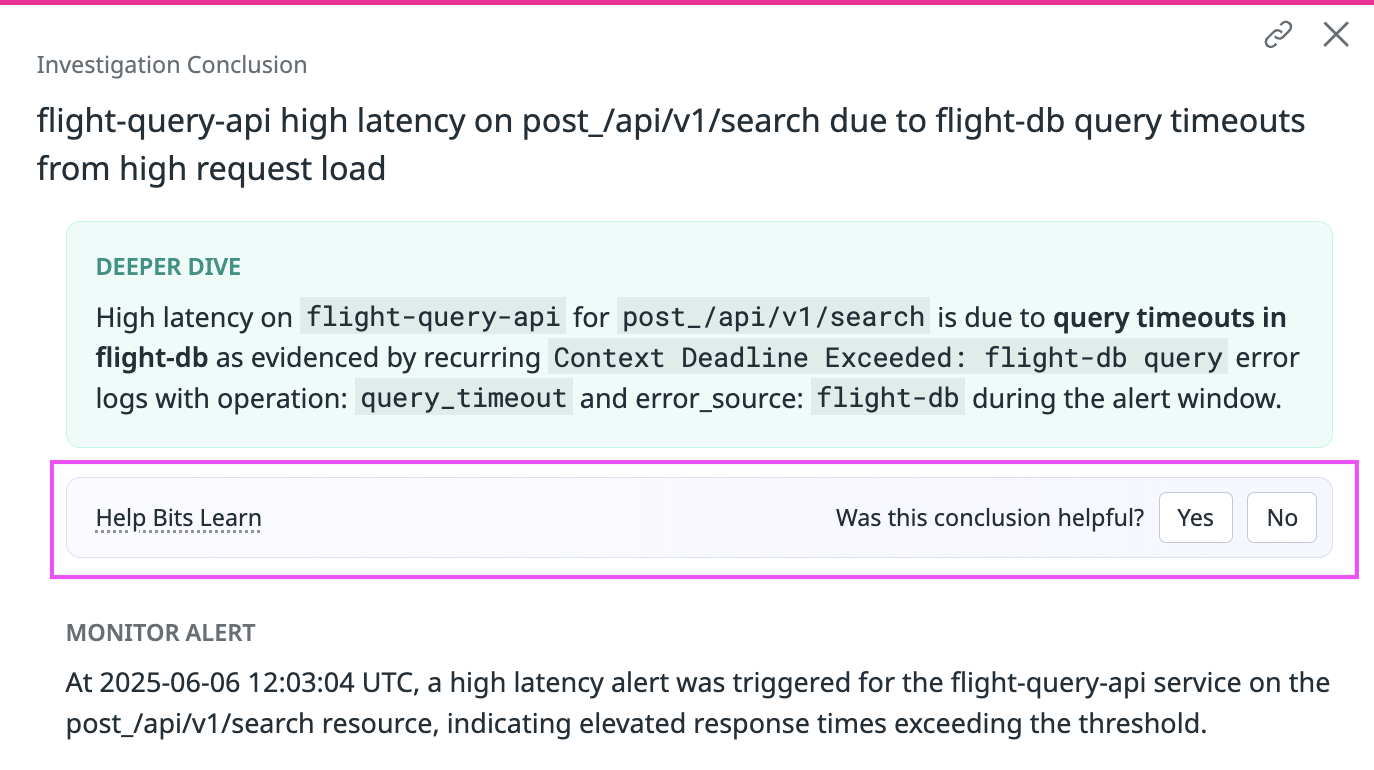
At the end of an investigation, let Bits know if the conclusion it made was correct or not. If it was inaccurate, provide Bits with the correct root cause so that it can learn from the discrepancy.
Manage memories
Every piece of feedback you give generates a memory. Bits uses these memories to enhance future investigations by recalling relevant patterns, queries, and corrections. You can navigate to Bits-Enabled Monitors to view and delete memories in the Memories column.


