- 重要な情報
- はじめに
- Datadog
- Datadog サイト
- DevSecOps
- AWS Lambda のサーバーレス
- エージェント
- インテグレーション
- コンテナ
- ダッシュボード
- アラート設定
- ログ管理
- トレーシング
- プロファイラー
- タグ
- API
- Service Catalog
- Session Replay
- Continuous Testing
- Synthetic モニタリング
- Incident Management
- Database Monitoring
- Cloud Security Management
- Cloud SIEM
- Application Security Management
- Workflow Automation
- CI Visibility
- Test Visibility
- Intelligent Test Runner
- Code Analysis
- Learning Center
- Support
- 用語集
- Standard Attributes
- ガイド
- インテグレーション
- エージェント
- OpenTelemetry
- 開発者
- 認可
- DogStatsD
- カスタムチェック
- インテグレーション
- Create an Agent-based Integration
- Create an API Integration
- Create a Log Pipeline
- Integration Assets Reference
- Build a Marketplace Offering
- Create a Tile
- Create an Integration Dashboard
- Create a Recommended Monitor
- Create a Cloud SIEM Detection Rule
- OAuth for Integrations
- Install Agent Integration Developer Tool
- サービスのチェック
- IDE インテグレーション
- コミュニティ
- ガイド
- Administrator's Guide
- API
- モバイルアプリケーション
- CoScreen
- Cloudcraft
- アプリ内
- Service Management
- インフラストラクチャー
- アプリケーションパフォーマンス
- APM
- Continuous Profiler
- データベース モニタリング
- Data Streams Monitoring
- Data Jobs Monitoring
- Digital Experience
- Software Delivery
- CI Visibility (CI/CDの可視化)
- CD Visibility
- Test Visibility
- Intelligent Test Runner
- Code Analysis
- Quality Gates
- DORA Metrics
- セキュリティ
- セキュリティの概要
- Cloud SIEM
- クラウド セキュリティ マネジメント
- Application Security Management
- AI Observability
- ログ管理
- Observability Pipelines(観測データの制御)
- ログ管理
- 管理
Investigate Alerts
このページは日本語には対応しておりません。随時翻訳に取り組んでいます。
翻訳に関してご質問やご意見ございましたら、お気軽にご連絡ください。
翻訳に関してご質問やご意見ございましたら、お気軽にご連絡ください。
Get started with alert investigations
Enable Bits on monitors for automated investigations
There are two main ways to enable Bits for automated investigations:
- Option 1: Use the Bits-Enabled Monitors list
- In Bits AI, go to the Bits-Enabled Monitors page.
- In the Monitors tab, select one or more monitors, then click Enable Bits AI.
- Option 2: Add the Bits AI tag to a monitor
- In the Monitor List, select one or more monitors to edit.
- To edit one monitor, click the monitor to open it, then click Edit.
- To edit multiple monitors, select them, then click Edit tags.
- Add the
bitsai:enabledtag to your selected monitors.
- In the Monitor List, select one or more monitors to edit.
You can also add the tag to your desired monitors using the Datadog API or Terraform.
Bits only supports metric, logs, APM, anomaly, forecast, integration, and outlier monitors for investigations.
Configure where investigation results are sent
Bits can send investigation results to several destinations. By default, results appear in two places:
- Full investigation results are available on the Bits AI Investigations page.
- A summary of the results is available on the status page for the monitor.
Additionally, if you have already configured @slack, @oncall, or @case notifications in your monitor, Bits automatically writes to those places. If not, you can add them as destinations for investigation results to appear:
Slack
Slack
- Ensure the Datadog Slack app is installed in your workspace.
- Go to Bits AI > Settings > Integrations and connect your Slack workspace.
- Go to a monitor. Under Configure notifications and automations, add the
@slack-{channel-name}handle to send results to Slack.
On-Call
On-Call
In the Configure notifications and automations section, add the @oncall-{team} handle.
Case Management
Case Management
In the Configure notifications and automations section, add the @case-{project-name} handle.
Manually start an investigation
Alternatively, you can manually invoke Bits on an individual monitor event.
- Option 1: Monitor Status Page
- On the monitor status page for an alert event, click Investigate with Bits AI.
- Option 2: Slack
- Under a monitor notification in Slack, type,
@Datadog Investigate this alert.
- Under a monitor notification in Slack, type,
For best results, see Optimize monitors for Bits AI SRE.
Optimize monitors for Bits AI SRE
To help Bits produce the most accurate and helpful investigation results, follow these guidelines:
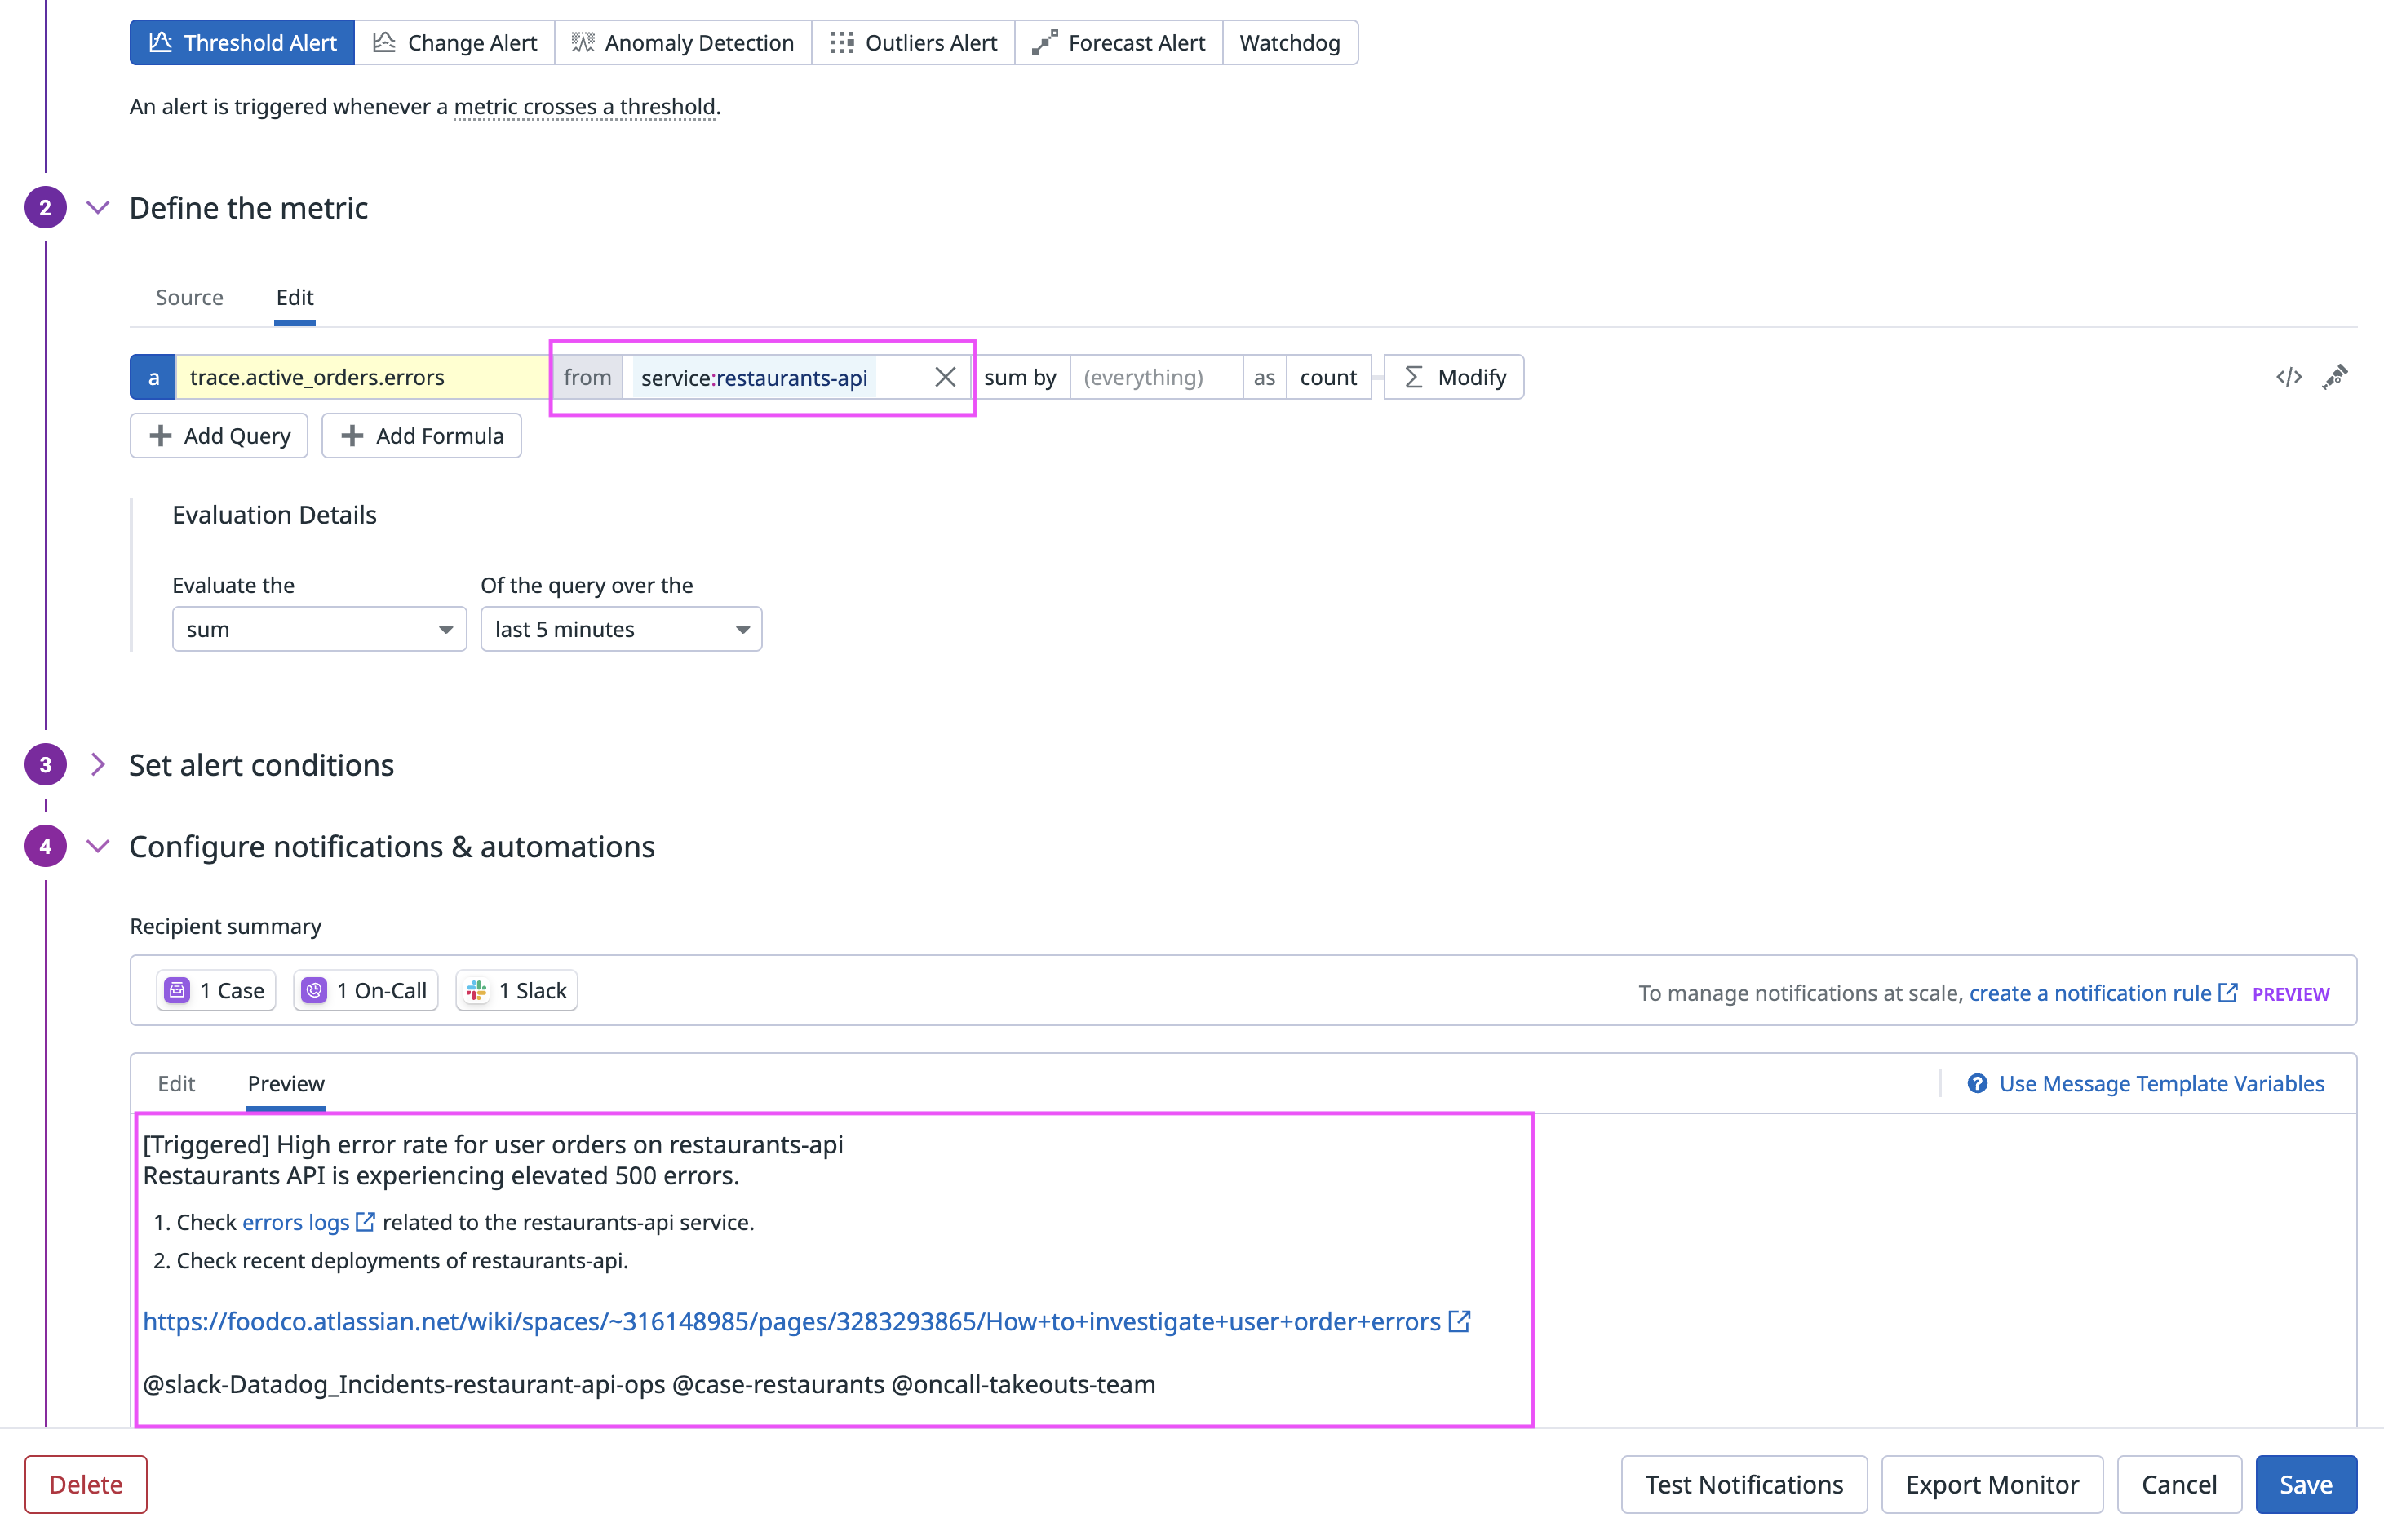
- Scope the monitor to a service by either filtering the query to a specific service or grouping it by service, where appropriate.
- Tag the monitor with a service, where appropriate.
- Add relevant troubleshooting steps to the monitor message to give Bits a starting point. Think of the first page you’d visit in Datadog if this monitor were to fire. Consider including:
- Plain-language instructions
- At least one helpful link to:
- A Datadog dashboard
- A logs query
- A trace query
- A Datadog notebook with key graphs or instructions
How Bits AI SRE investigates
Investigations happen in two phases:
- Initial context gathering
- Bits begins by looking at any troubleshooting steps, Confluence pages, or Datadog links that you’ve added to the monitor’s message, and uses them to make relevant queries.
- It also automatically scans your Datadog environment for additional context.
- Thirdly, if you’ve interacted with a previous investigation for the same monitor, Bits will recall any memories associated with the monitor.
- Root cause hypothesis generation and testing
- Using the gathered context, Bits performs a more thorough investigation by building multiple root cause hypotheses and testing them in parallel. Today, Bits is able to query:
- Metrics
- Traces
- Logs
- Dashboards
- Change events
- Watchdog insights
- Monitor alerts
- Incidents
- Hypotheses can end in one of three states: validated, invalidated, or inconclusive.
- Using the gathered context, Bits performs a more thorough investigation by building multiple root cause hypotheses and testing them in parallel. Today, Bits is able to query:
For best results, see Optimize monitors for Bits AI SRE.
Chat with Bits AI SRE about the investigation
On the Bits AI Investigations page, you can chat with Bits to gather additional information about the investigation or the services involved. Click the Suggested replies bubble for examples.
| Functionality | Example prompts | Data source |
|---|---|---|
| Understand the status of its investigation | What's the latest status of the investigation? | Investigation findings |
| Ask for elaborations of its findings | Tell me more about the {issue}. | Investigation findings |
| Look up information about a service | Are there any ongoing incidents for {example-service}? | Software Catalog service definitions |
| Find recent changes for a service | Were there any recent changes on {example-service}? | Change Tracking events |
| Find a dashboard | Give me the {example-service} dashboard. | Dashboards |
| Query APM request, error, and duration metrics | What's the current error rate for {example-service}? | APM metrics |
| Search for information in Confluence | Find me the runbook in Confluence to rollback deployments for {example-service}. | Confluence |
Help Bits AI SRE learn
Reviewing Bits’ findings not only validates their accuracy, but also helps Bits learn from any mistakes it makes, enabling it to produce faster and more accurate investigations in the future.
During the investigation
You can guide Bits’ learning by:
- Improving a step: Share a link to a better query Bits should have made.
- Remembering a step: Tell Bits to remember any helpful queries it generated. This instructs Bits to prioritize running these queries the next time the same monitor fires.
After the investigation
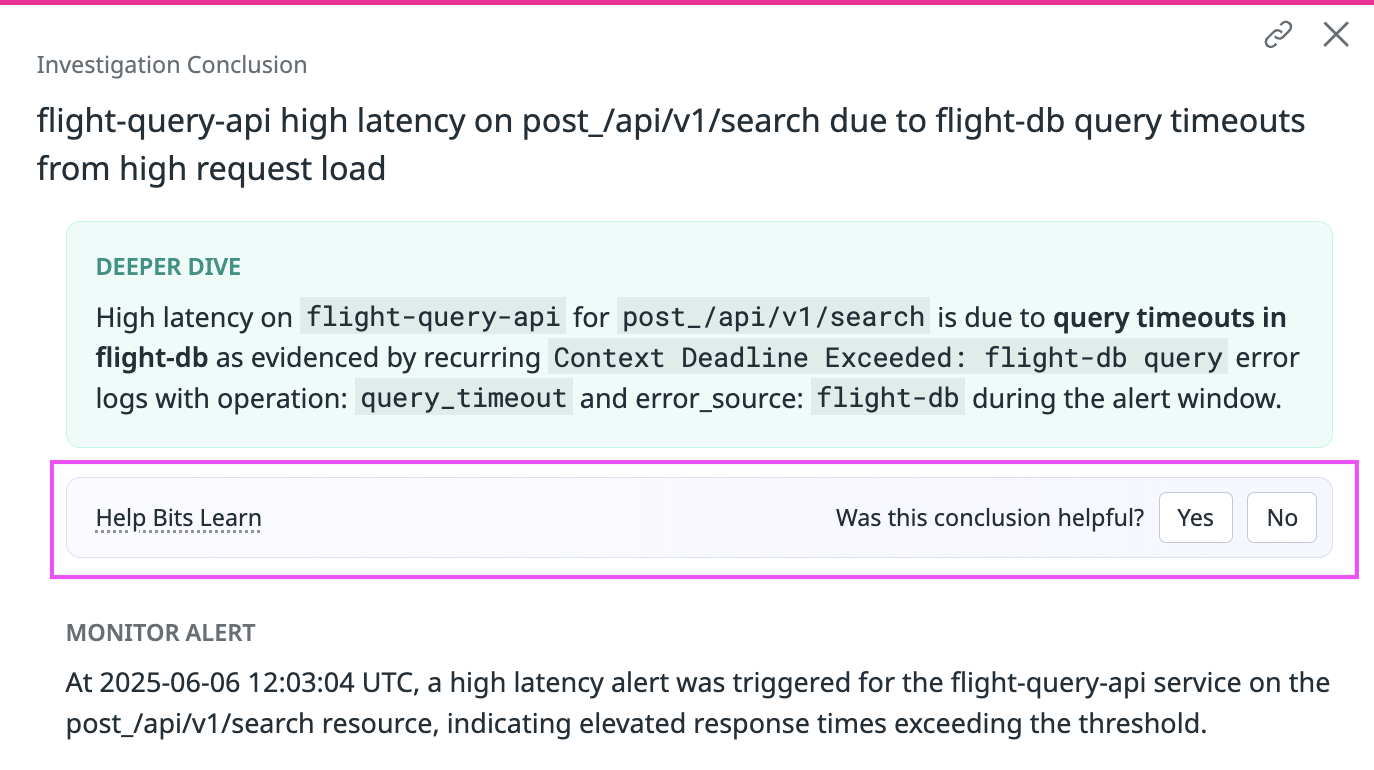
At the end of an investigation, let Bits know if the conclusion it made was correct or not. If it was inaccurate, provide Bits with the correct root cause so that it can learn from the discrepancy.
Manage memories
Every piece of feedback you give generates a memory. Bits uses these memories to enhance future investigations by recalling relevant patterns, queries, and corrections. You can navigate to Bits-Enabled Monitors to view and delete memories in the Memories column.


