- Essentials
- Getting Started
- Agent
- API
- APM Tracing
- Containers
- Dashboards
- Database Monitoring
- Datadog
- Datadog Site
- DevSecOps
- Incident Management
- Integrations
- Internal Developer Portal
- Logs
- Monitors
- OpenTelemetry
- Profiler
- Session Replay
- Security
- Serverless for AWS Lambda
- Software Delivery
- Synthetic Monitoring and Testing
- Tags
- Workflow Automation
- Learning Center
- Support
- Glossary
- Standard Attributes
- Guides
- Agent
- Integrations
- Developers
- Authorization
- DogStatsD
- Custom Checks
- Integrations
- Create an Agent-based Integration
- Create an API Integration
- Create a Log Pipeline
- Integration Assets Reference
- Build a Marketplace Offering
- Create a Tile
- Create an Integration Dashboard
- Create a Monitor Template
- Create a Cloud SIEM Detection Rule
- OAuth for Integrations
- Install Agent Integration Developer Tool
- Service Checks
- IDE Plugins
- Community
- Guides
- OpenTelemetry
- Administrator's Guide
- API
- Partners
- Datadog Mobile App
- DDSQL Reference
- CoScreen
- CoTerm
- Cloudcraft (Standalone)
- In The App
- Dashboards
- Notebooks
- DDSQL Editor
- Reference Tables
- Sheets
- Monitors and Alerting
- Metrics
- Watchdog
- Bits AI
- Internal Developer Portal
- Error Tracking
- Change Tracking
- Service Management
- Actions & Remediations
- Infrastructure
- Cloudcraft
- Resource Catalog
- Universal Service Monitoring
- Hosts
- Containers
- Processes
- Serverless
- Network Monitoring
- Cloud Cost
- Application Performance
- APM
- APM Terms and Concepts
- Application Instrumentation
- APM Metrics Collection
- Trace Pipeline Configuration
- Correlate Traces with Other Telemetry
- Trace Explorer
- Recommendations
- Code Origins for Spans
- Service Observability
- Endpoint Observability
- Dynamic Instrumentation
- Live Debugger
- Error Tracking
- Data Security
- Guides
- Troubleshooting
- Continuous Profiler
- Database Monitoring
- Agent Integration Overhead
- Setup Architectures
- Setting Up Postgres
- Setting Up MySQL
- Setting Up SQL Server
- Setting Up Oracle
- Setting Up Amazon DocumentDB
- Setting Up MongoDB
- Connecting DBM and Traces
- Data Collected
- Exploring Database Hosts
- Exploring Query Metrics
- Exploring Query Samples
- Exploring Database Schemas
- Exploring Recommendations
- Troubleshooting
- Guides
- Data Streams Monitoring
- Data Jobs Monitoring
- Data Observability
- Digital Experience
- Real User Monitoring
- Synthetic Testing and Monitoring
- Continuous Testing
- Product Analytics
- Software Delivery
- CI Visibility
- CD Visibility
- Deployment Gates
- Test Optimization
- Quality Gates
- DORA Metrics
- Security
- Security Overview
- Cloud SIEM
- Code Security
- Cloud Security
- App and API Protection
- Workload Protection
- Sensitive Data Scanner
- AI Observability
- Log Management
- Observability Pipelines
- Log Management
- Administration
Exploring Database Schemas
Schemas help you monitor performance, usage, and changes in your data models, enabling quicker issue identification and remediation.
Schema Tracking is available for PostgreSQL, SQL Server, and MySQL.
Configuration
To enable the schemas feature, add the collect_schemas parameter to your Database Monitoring configuration:
init_config:
instances:
  - dbm: true
    host: localhost
    port: 5432
    username: datadog
    password: 'ENC[datadog_user_database_password]'
    collect_schemas: true
    ## Optional: Connect to a different database if needed for `custom_queries`
    # dbname: '<DB_NAME>'
Tables overview
The Tables overview lists all tracked tables across your databases, grouped by table name, with the following columns:
| Column | Description |
|---|---|
| # Variants | Number of distinct versions of the table across all hosts. |
| # Instances | Total number of table instances across all hosts. For example, if a table has two variants with seven and eight instances respectively, the total number of instances is 15. |
| # Columns | Count of unique columns across all variants of the table on all hosts. For example, if one variant has columns A, B, C and another has A, B, D, the total unique columns would be four (A, B, C, D). |
| Databases | Names of all databases containing this table across all hosts. |
| Schemas | Schemas in which this table appears across all hosts. |
| Database Hosts | Hosts where this table is present. |
Each table row can be expanded to view its table variants and the following columns:
| Column | Description |
|---|---|
| Variant ID | Unique identifier for a variant (version) of this table. |
| # Instances | Number of instances of this table for this variant. |
| # Columns | Number of unique columns in this table variant. |
| Databases | Alphabetically sorted list of databases containing this table variant. |
| Schemas | Alphabetically sorted list of schemas containing this table variant. |
| Database Hosts | Alphabetically sorted list of hosts where this table variant appears. |
Viewing table variant details
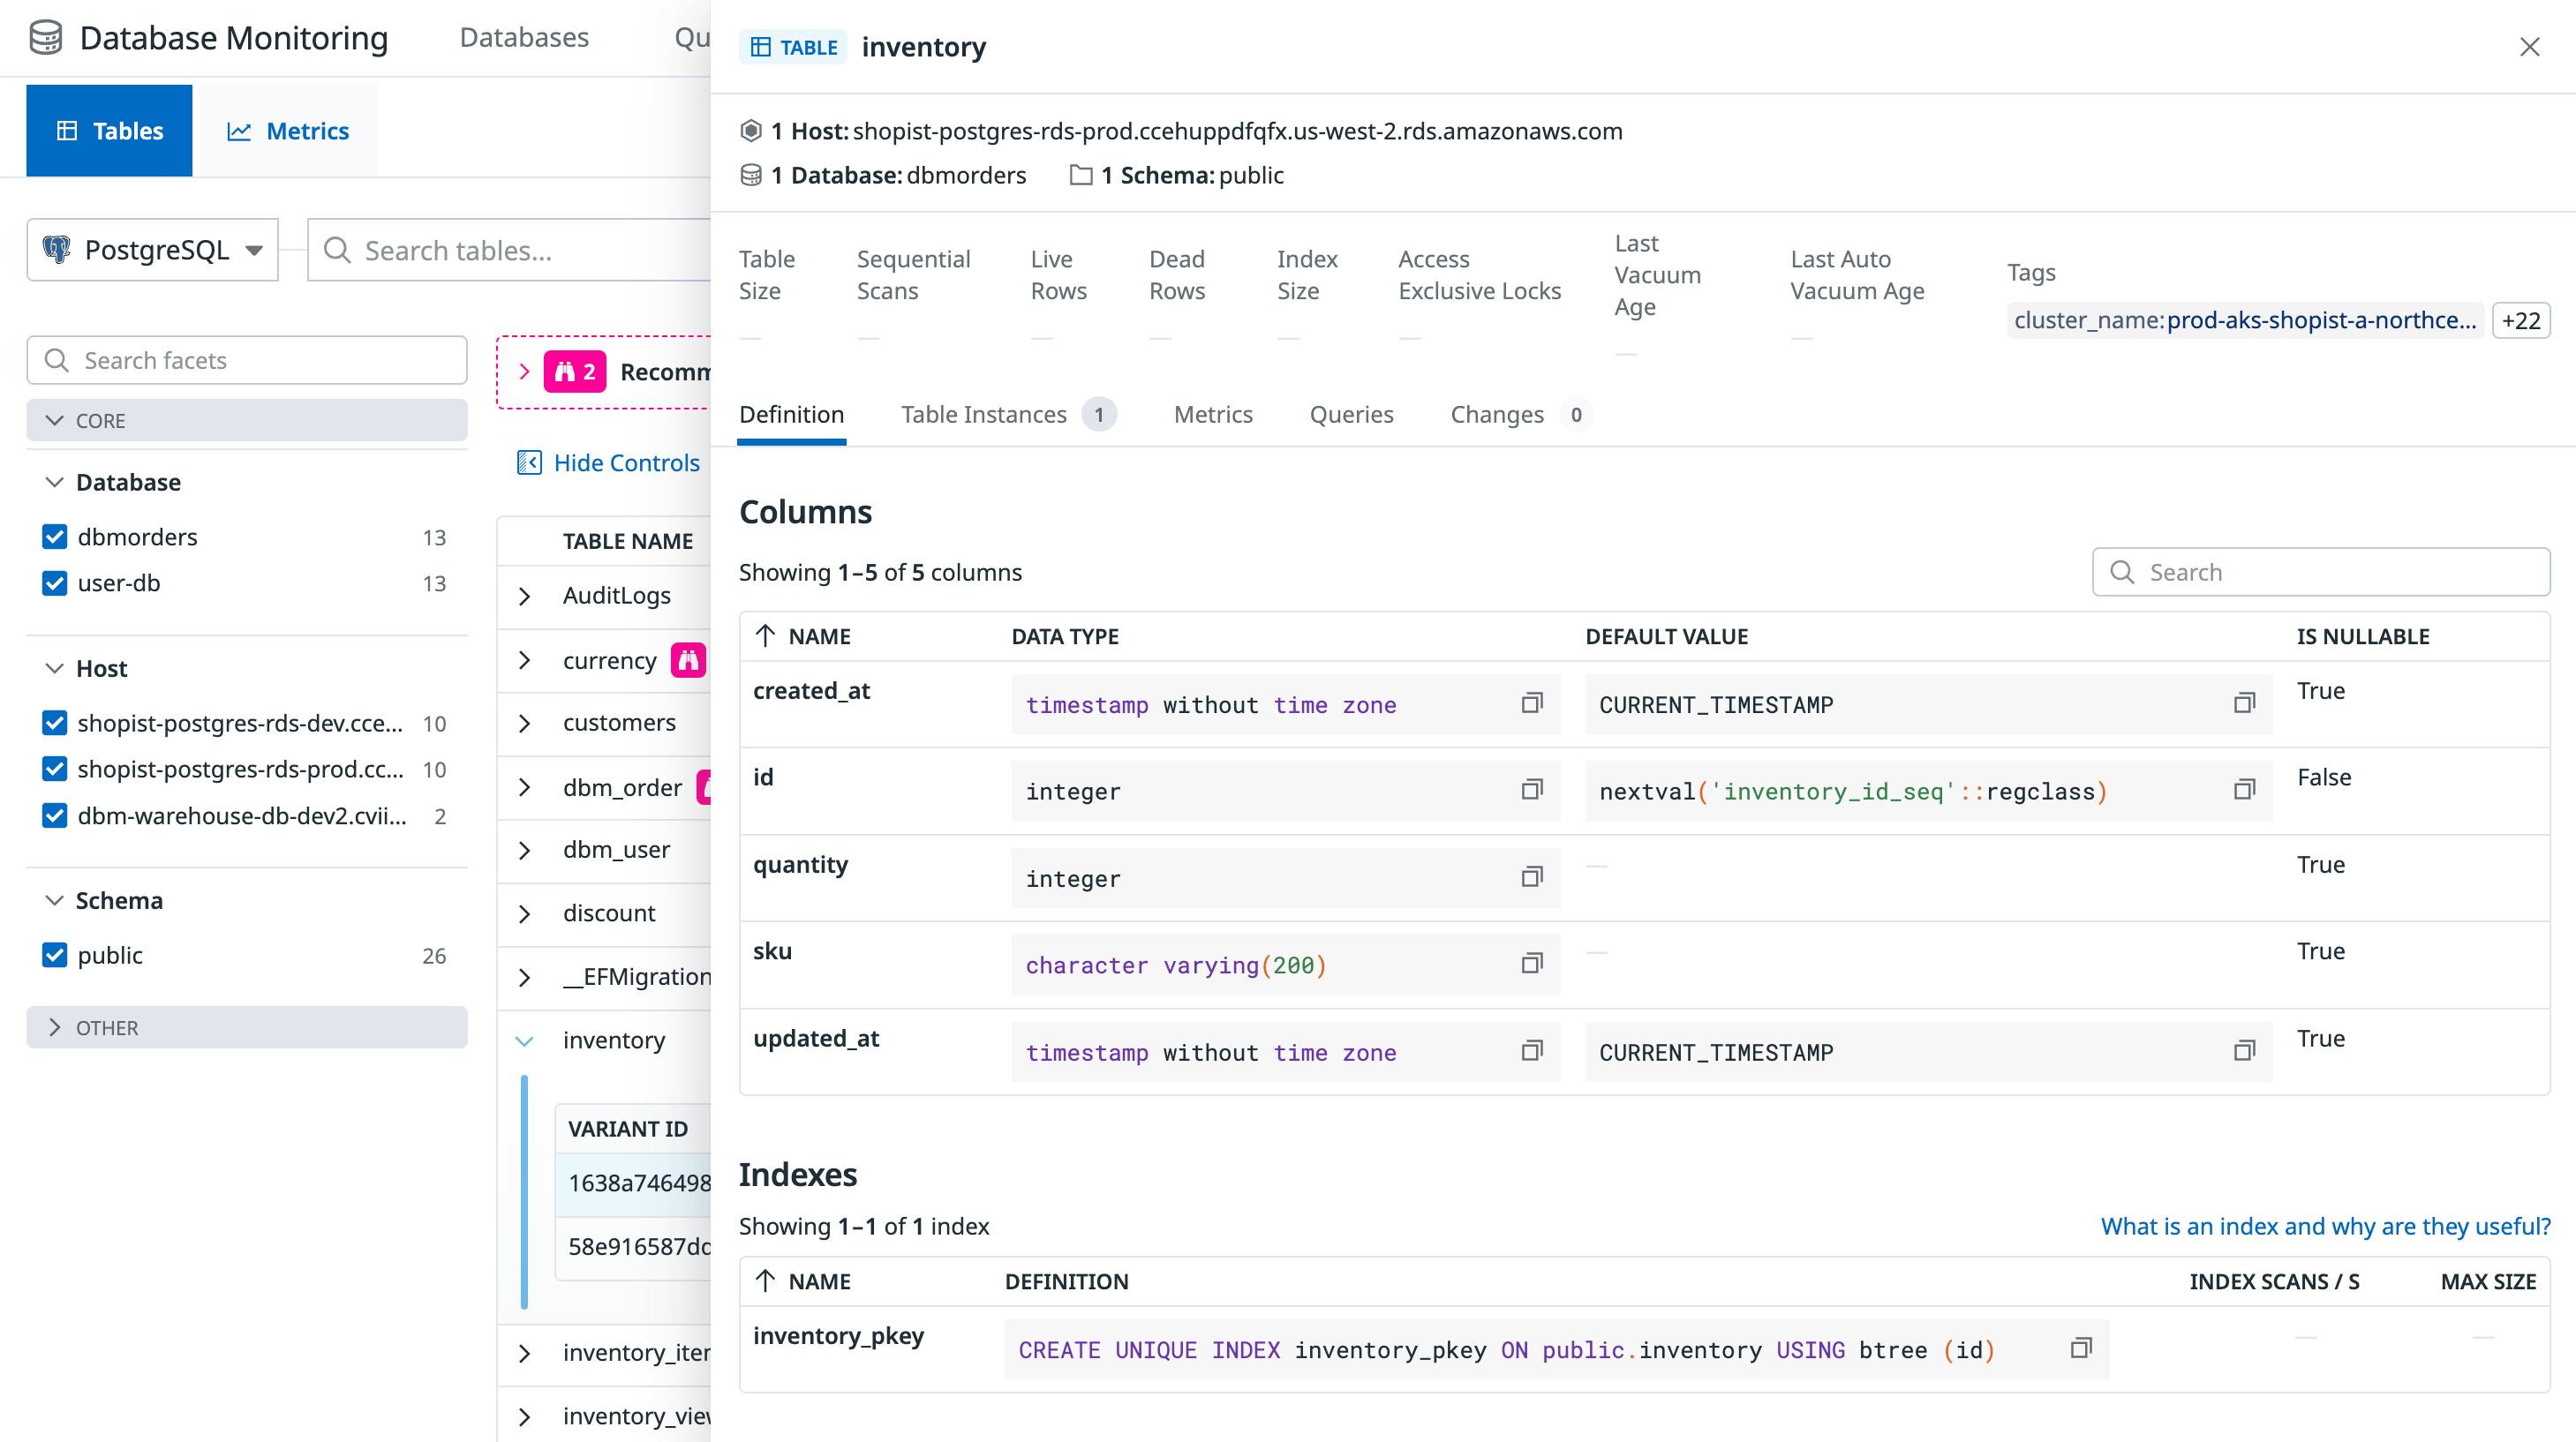
To view more details about a table variant, click its row to open the table variant panel.
This panel shows you information about the variant (version), such as:
- Definition: Includes columns, indexes, and foreign keys for this table variant.
- Table Instances: All instances associated with this table variant.
- Metrics: Table size, sequential scans, and other related metrics (last 7 days by default).
- Queries: Queries involving this table variant (last 7 days by default).
- Changes: Schema changes affecting this table variant (last 7 days by default).
Viewing table instance details
To view details for a specific table instance, go to the Table Instances tab in the table variant panel and click on a row.
This opens a view similar to the table variant panel, showing the following information for the selected table instance:
- Definition: Includes columns, indexes, and foreign keys for this table instance.
- Metrics: Table size, sequential scans, and other related metrics (last 7 days by default).
- Queries: Queries involving this table instance (last 7 days by default).
- Changes: Schema changes affecting this table instance (last 7 days by default).
Recommendations
Recommendations highlight potential opportunities for schema optimization across your tables.
Each recommendation includes:
- A detected issue, such as a missing primary key or an inefficient index.
- An explanation of why the issue matters and how it impacts database performance or integrity.
- A suggested fix, often an SQL statement that can be executed on the affected database.
Recommendations are available in aggregate (at the top of the page) and per table, with each applicable table showing its corresponding recommendations. For more information, see Recommendations.
Metrics overview
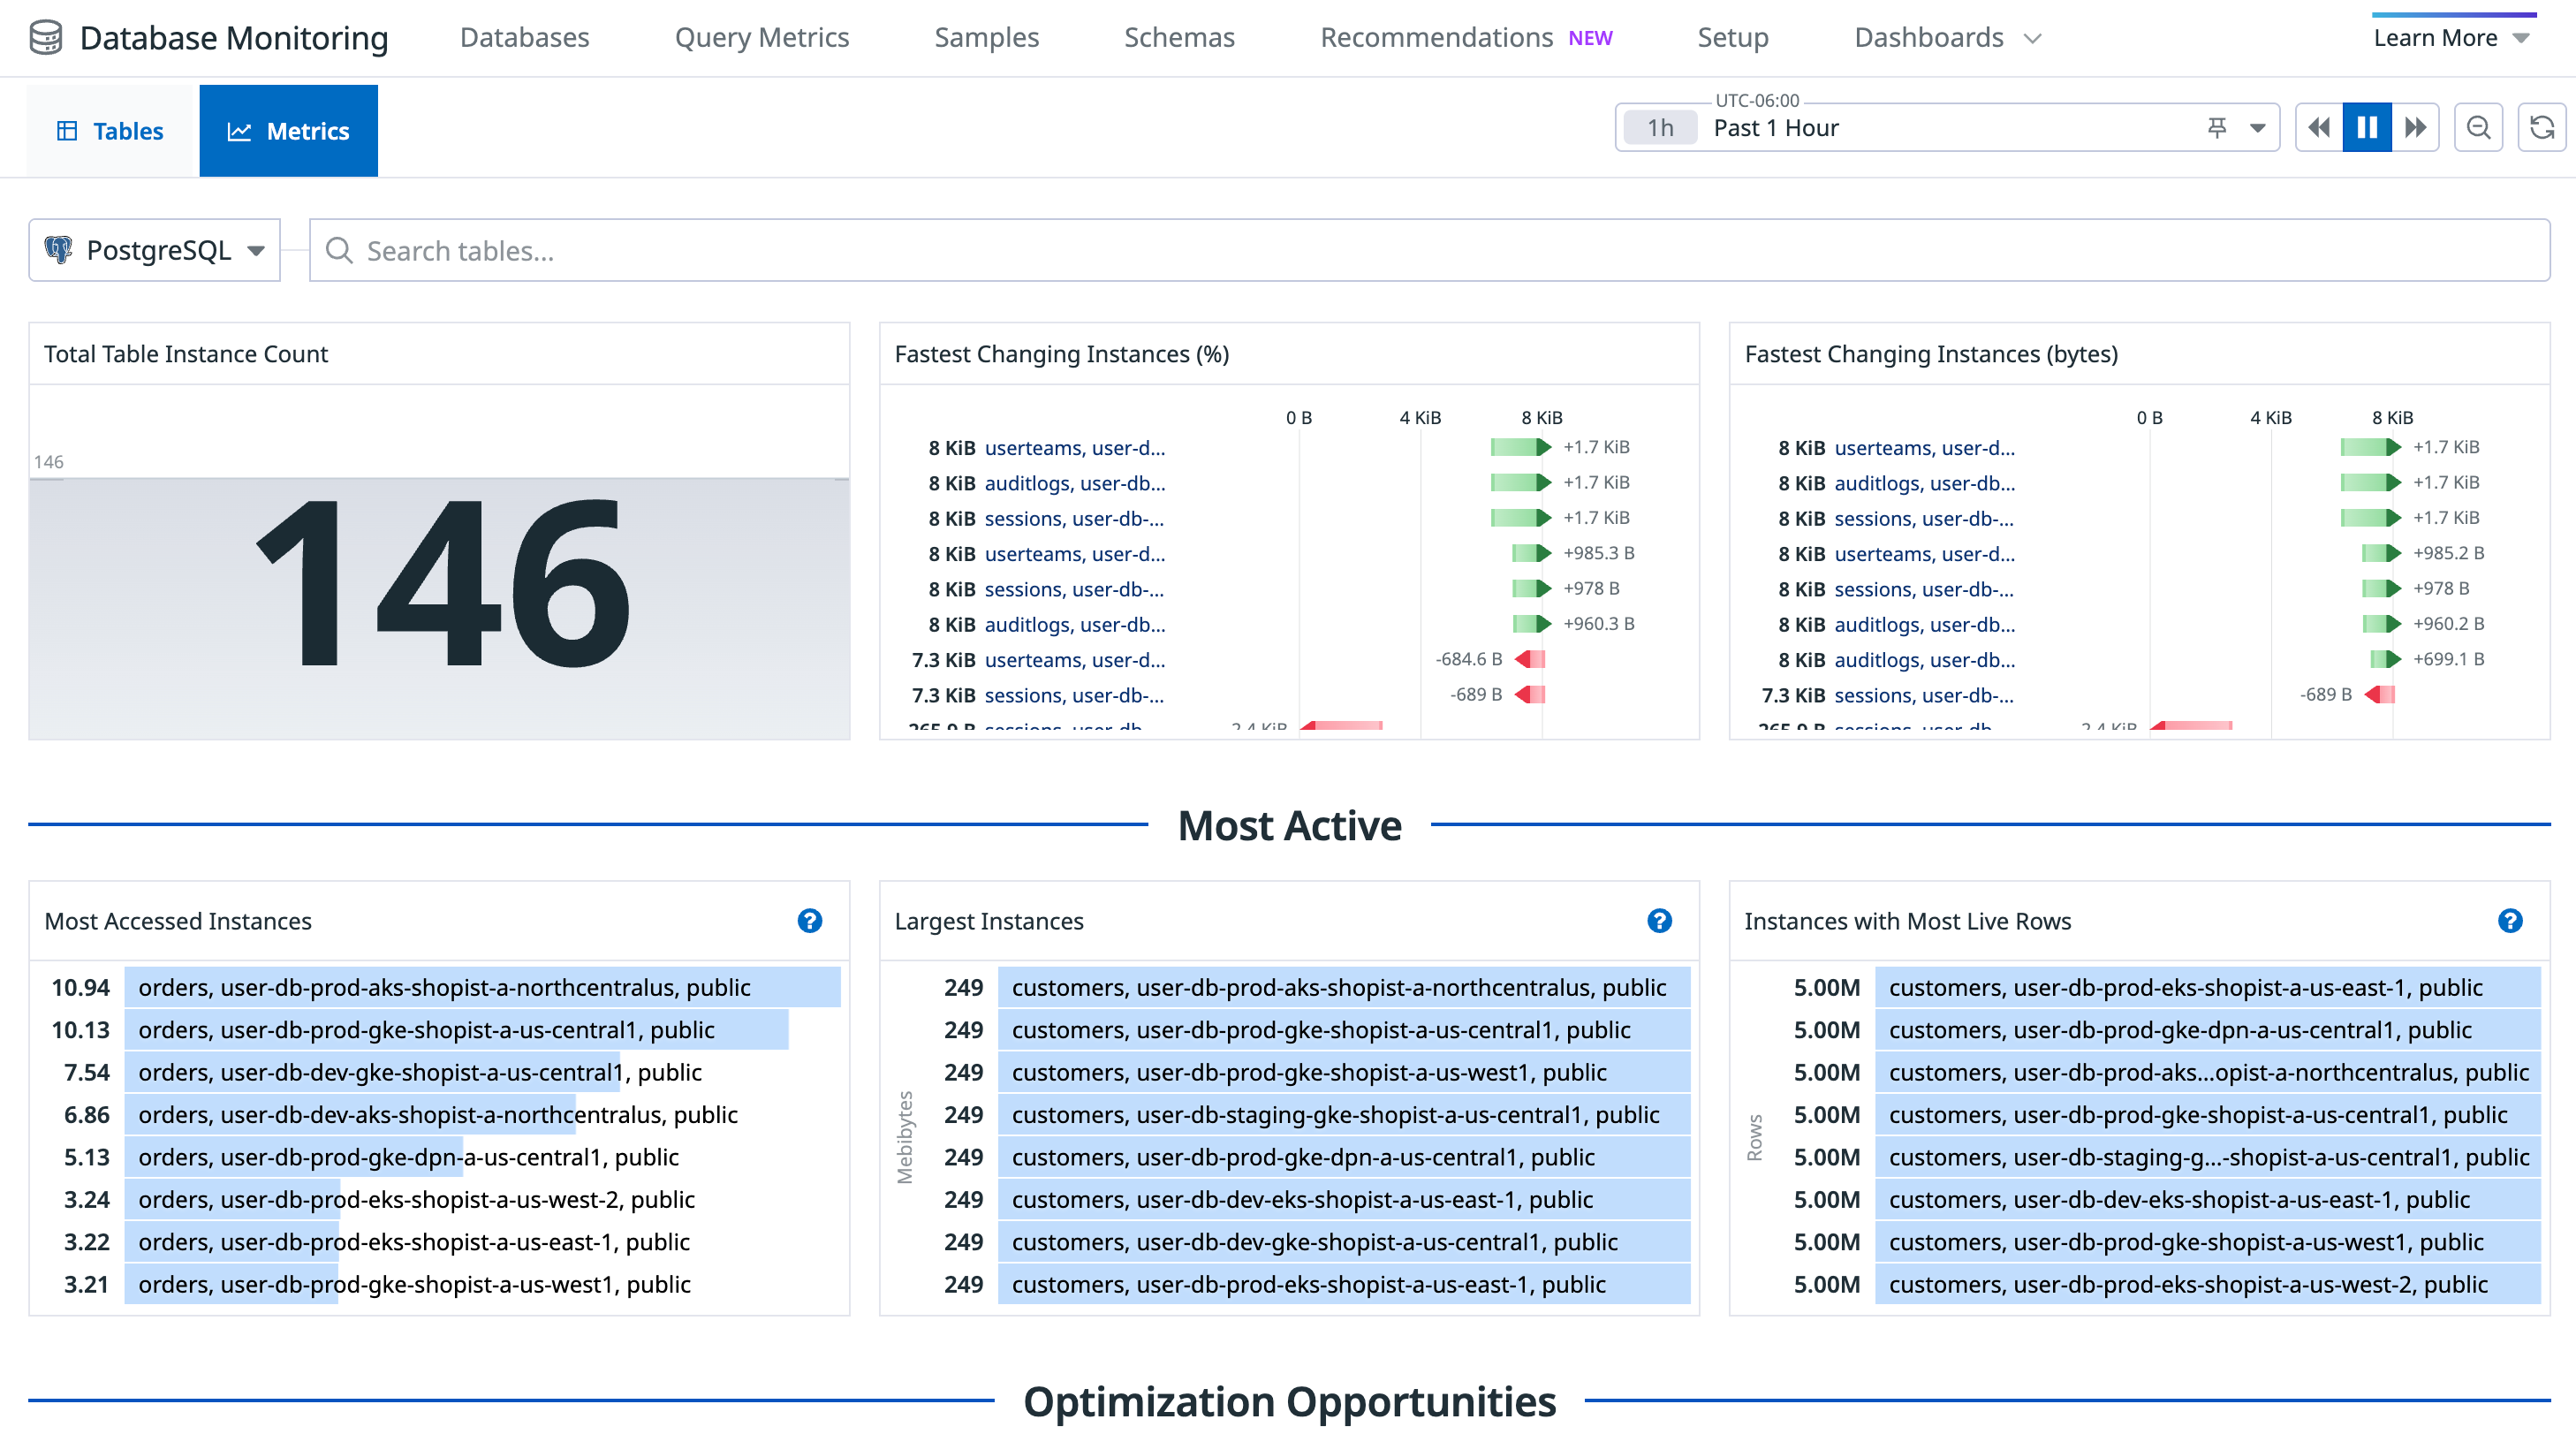
The Metrics overview displays dashboards for metrics associated with tracked tables across each DBMS.
Each dashboard includes the following metrics:
- Total Table Instance Count
- Fastest Changing Instances (%)
- Fastest Changes Instances (bytes)
- Most Accessed Instances
- Largest Instances
- Instances with Most Live Rows
- Instances with the Largest Index Sizes
- Instances with Access Exclusive Locks
- Instances with Most Dead Rows
- Instances with the Longest Last Vacuum Age
- Instances with the Longest Last Auto Vacuum Age


