Fiddler Dashboard in DataDog
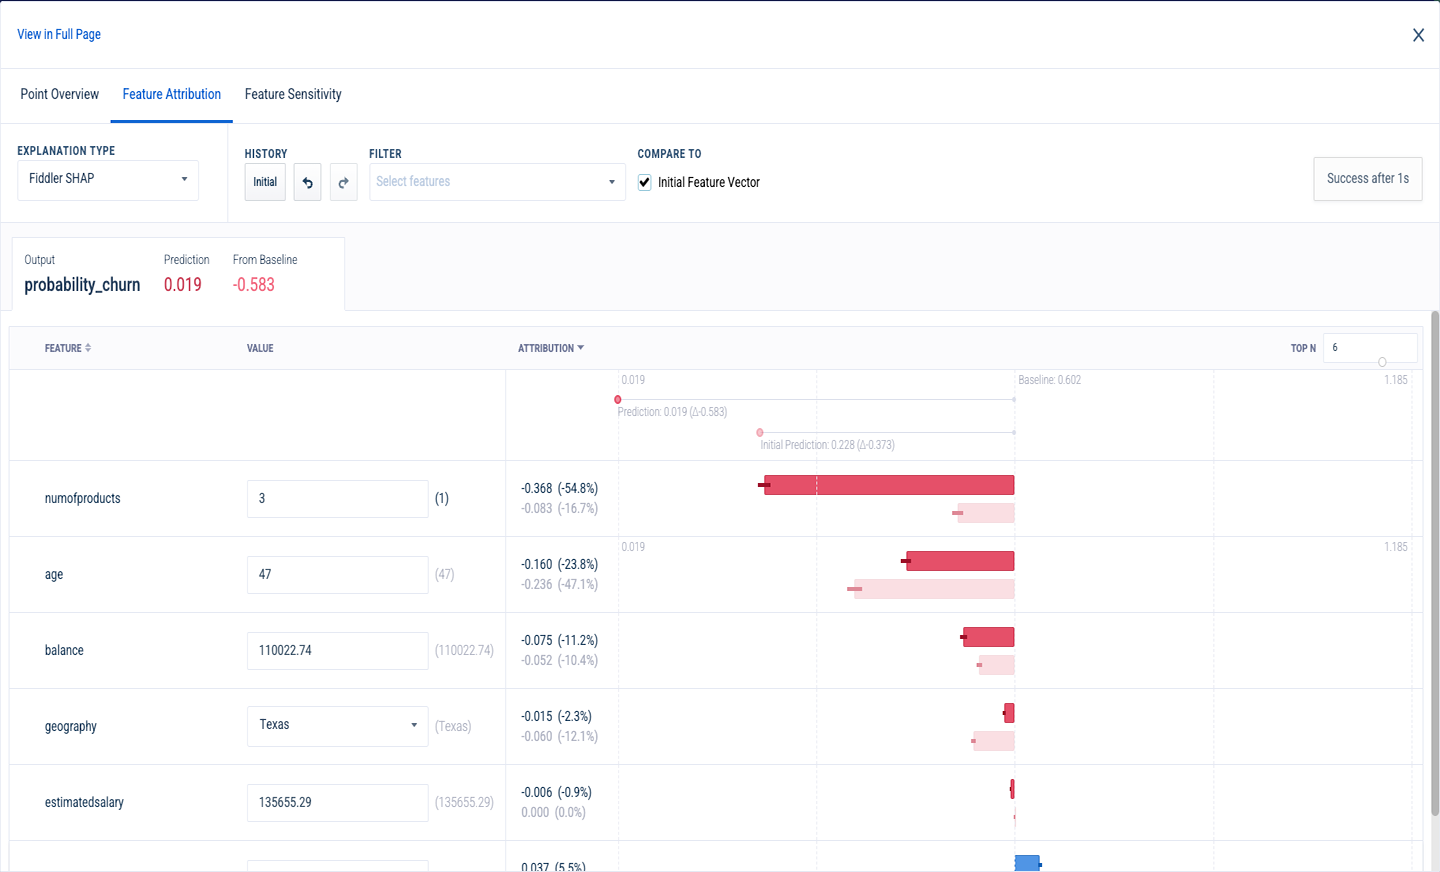
Performing counterfactual explanations
Agent Check: Fiddler
Overview
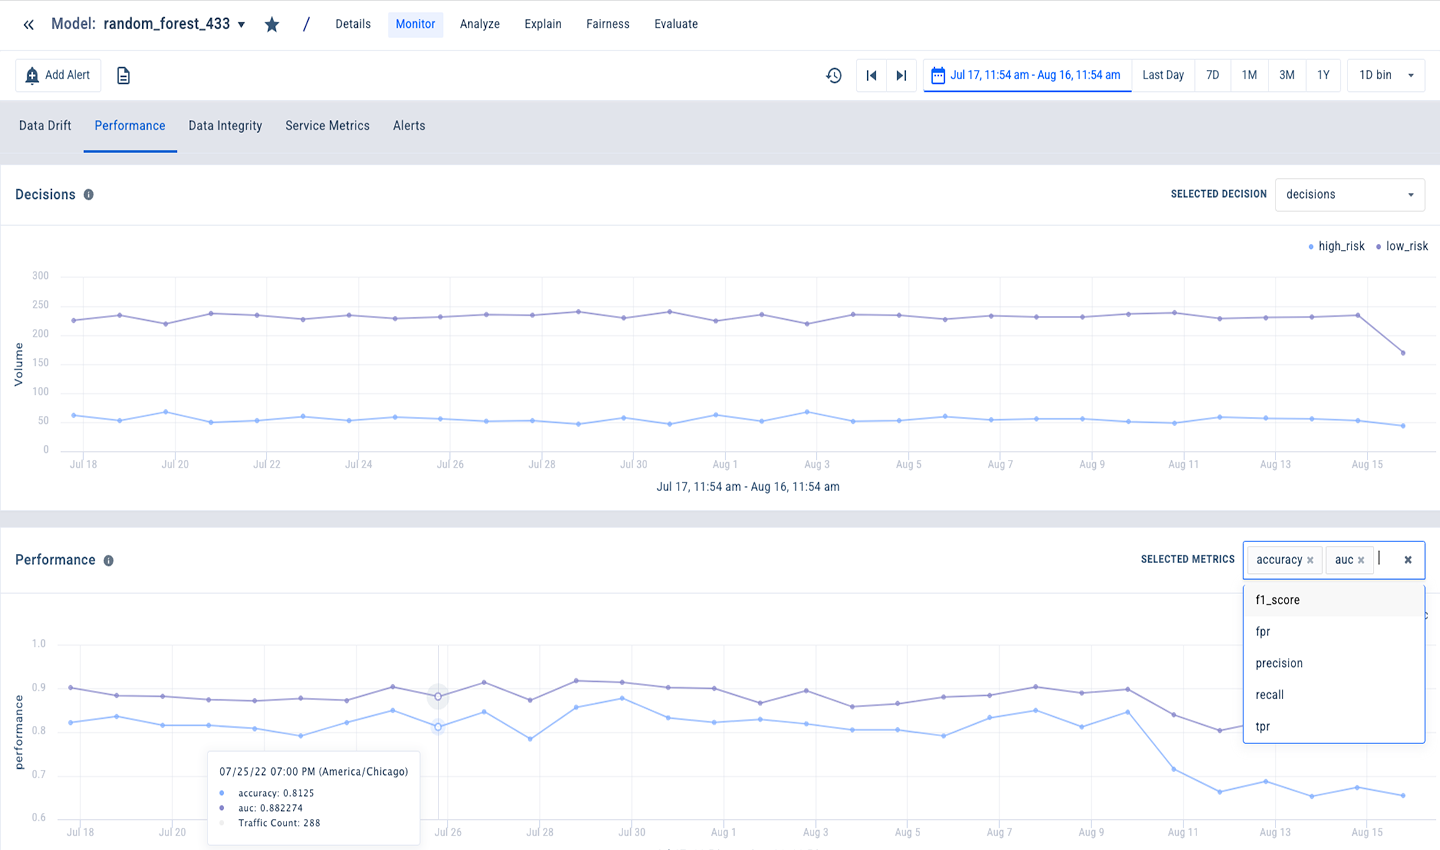
Fiddler’s Model Performance Management platform monitors Machine Learning model performance by sending real-time alerts when model performance metrics drop, allowing users to analyze inference data to understand why model performance is degrading. This integration includes metrics and an out-of-the-box dashboard that displays performance metrics such as accuracy, traffic, and drift.
Setup
The Fiddler check is not included in the Datadog Agent package, so you need to install it.
Installation
For Agent v7.21+ / v6.21+, follow the instructions below to install the Fiddler check on your host. See Use Community Integrations to install with the Docker Agent or earlier versions of the Agent.
Run the following command to install the Agent integration:
datadog-agent integration install -t datadog-fiddler==4.0.0
Configure your integration similar to Agent-based integrations.
Configuration
Edit the fiddler.d/conf.yaml file, in the conf.d/ folder at the root of your Agent’s configuration directory to start collecting your Fiddler performance data. See the sample fiddler.d/conf.yaml for all available configuration options. The url, org, and fiddler_api_key parameters need to be updated for the Fiddler environment you wish the integration to query. Fiddler also suggests setting the minimum_collection_interval setting in the conf.yaml file to 300 (5 minutes). Additionally, bin_size, v1compat and enabled_metrics can also be configured.
Restart the Agent.
Validation
Run the Agent’s status subcommand and look for fiddler under the Checks section.
Data Collected
Metrics
| |
|---|
fiddler.accuracy
(gauge) | The accuracy of the model
Shown as percent |
fiddler.histogram_drift
(gauge) | The histogram drift of the model[deprecated]
Shown as percent |
fiddler.psi
(gauge) | The PSI of the model
Shown as percent |
fiddler.jsd
(gauge) | The JSD of the model
Shown as percent |
fiddler.feature_average
(gauge) | The feature average of the model[deprecated]
Shown as percent |
fiddler.output_average
(gauge) | The output average of the model[deprecated]
Shown as percent |
fiddler.average
(gauge) | The feature average of the model
Shown as percent |
fiddler.traffic_count
(gauge) | The traffic count of the model[deprecated]
Shown as percent |
fiddler.traffic
(gauge) | The traffic count of the model
Shown as percent |
fiddler.fpr
(gauge) | The false positive rate of the model
Shown as percent |
fiddler.tpr
(gauge) | The true positive rate of the model[deprecated]
Shown as percent |
fiddler.auc
(gauge) | The AUC of the model
Shown as percent |
fiddler.f1_score
(gauge) | The F1 Score of the model
Shown as percent |
fiddler.precision
(gauge) | The precision of the model
Shown as percent |
fiddler.recall
(gauge) | The recall of the model
Shown as percent |
fiddler.mape
(gauge) | The MAPE of the model
Shown as percent |
fiddler.wmape
(gauge) | The WMAPE of the model
Shown as percent |
fiddler.mae
(gauge) | The MAE of the model
Shown as percent |
fiddler.mse
(gauge) | The MSE of the model
Shown as percent |
fiddler.r2
(gauge) | The R-squared metric of the model
Shown as percent |
fiddler.binary_cross_entropy
(gauge) | The binary cross-entropy metric of the model[deprecated]
Shown as percent |
fiddler.log_loss
(gauge) | The log-loss metric of the model
Shown as percent |
fiddler.expected_callibration_error
(gauge) | The expected calibration error of the model[deprecated]
Shown as percent |
fiddler.data_count
(gauge) | The data count metric of the model
Shown as percent |
fiddler.auroc
(gauge) | The AUROC metric of the model
Shown as percent |
fiddler.callibrated_threshold
(gauge) | The calibrated threshold metric of the model[deprecated]
Shown as percent |
fiddler.calibrated_threshold
(gauge) | The calibrated threshold metric of the model
Shown as percent |
fiddler.g_mean
(gauge) | The geometric mean metric of the model[deprecated]
Shown as percent |
fiddler.geometric_mean
(gauge) | The geometric mean metric of the model
Shown as percent |
fiddler.sum
(gauge) | The SUM of a feature the model
Shown as percent |
fiddler.expected_calibration_error
(gauge) | The Expected Callibaration Error of the model
Shown as percent |
Service Checks
fiddler.can_connect
Returns CRITICAL if the Agent is unable to connect to and collect metrics from the monitored Fiddler instance. Returns OK otherwise.
Statuses: ok, critical
Troubleshooting
Need help? Contact Fiddler support.