概要
Weaviate is an open source, AI-native vector database that helps create AI-powered applications. With Datadog’s Weaviate integration, you can:
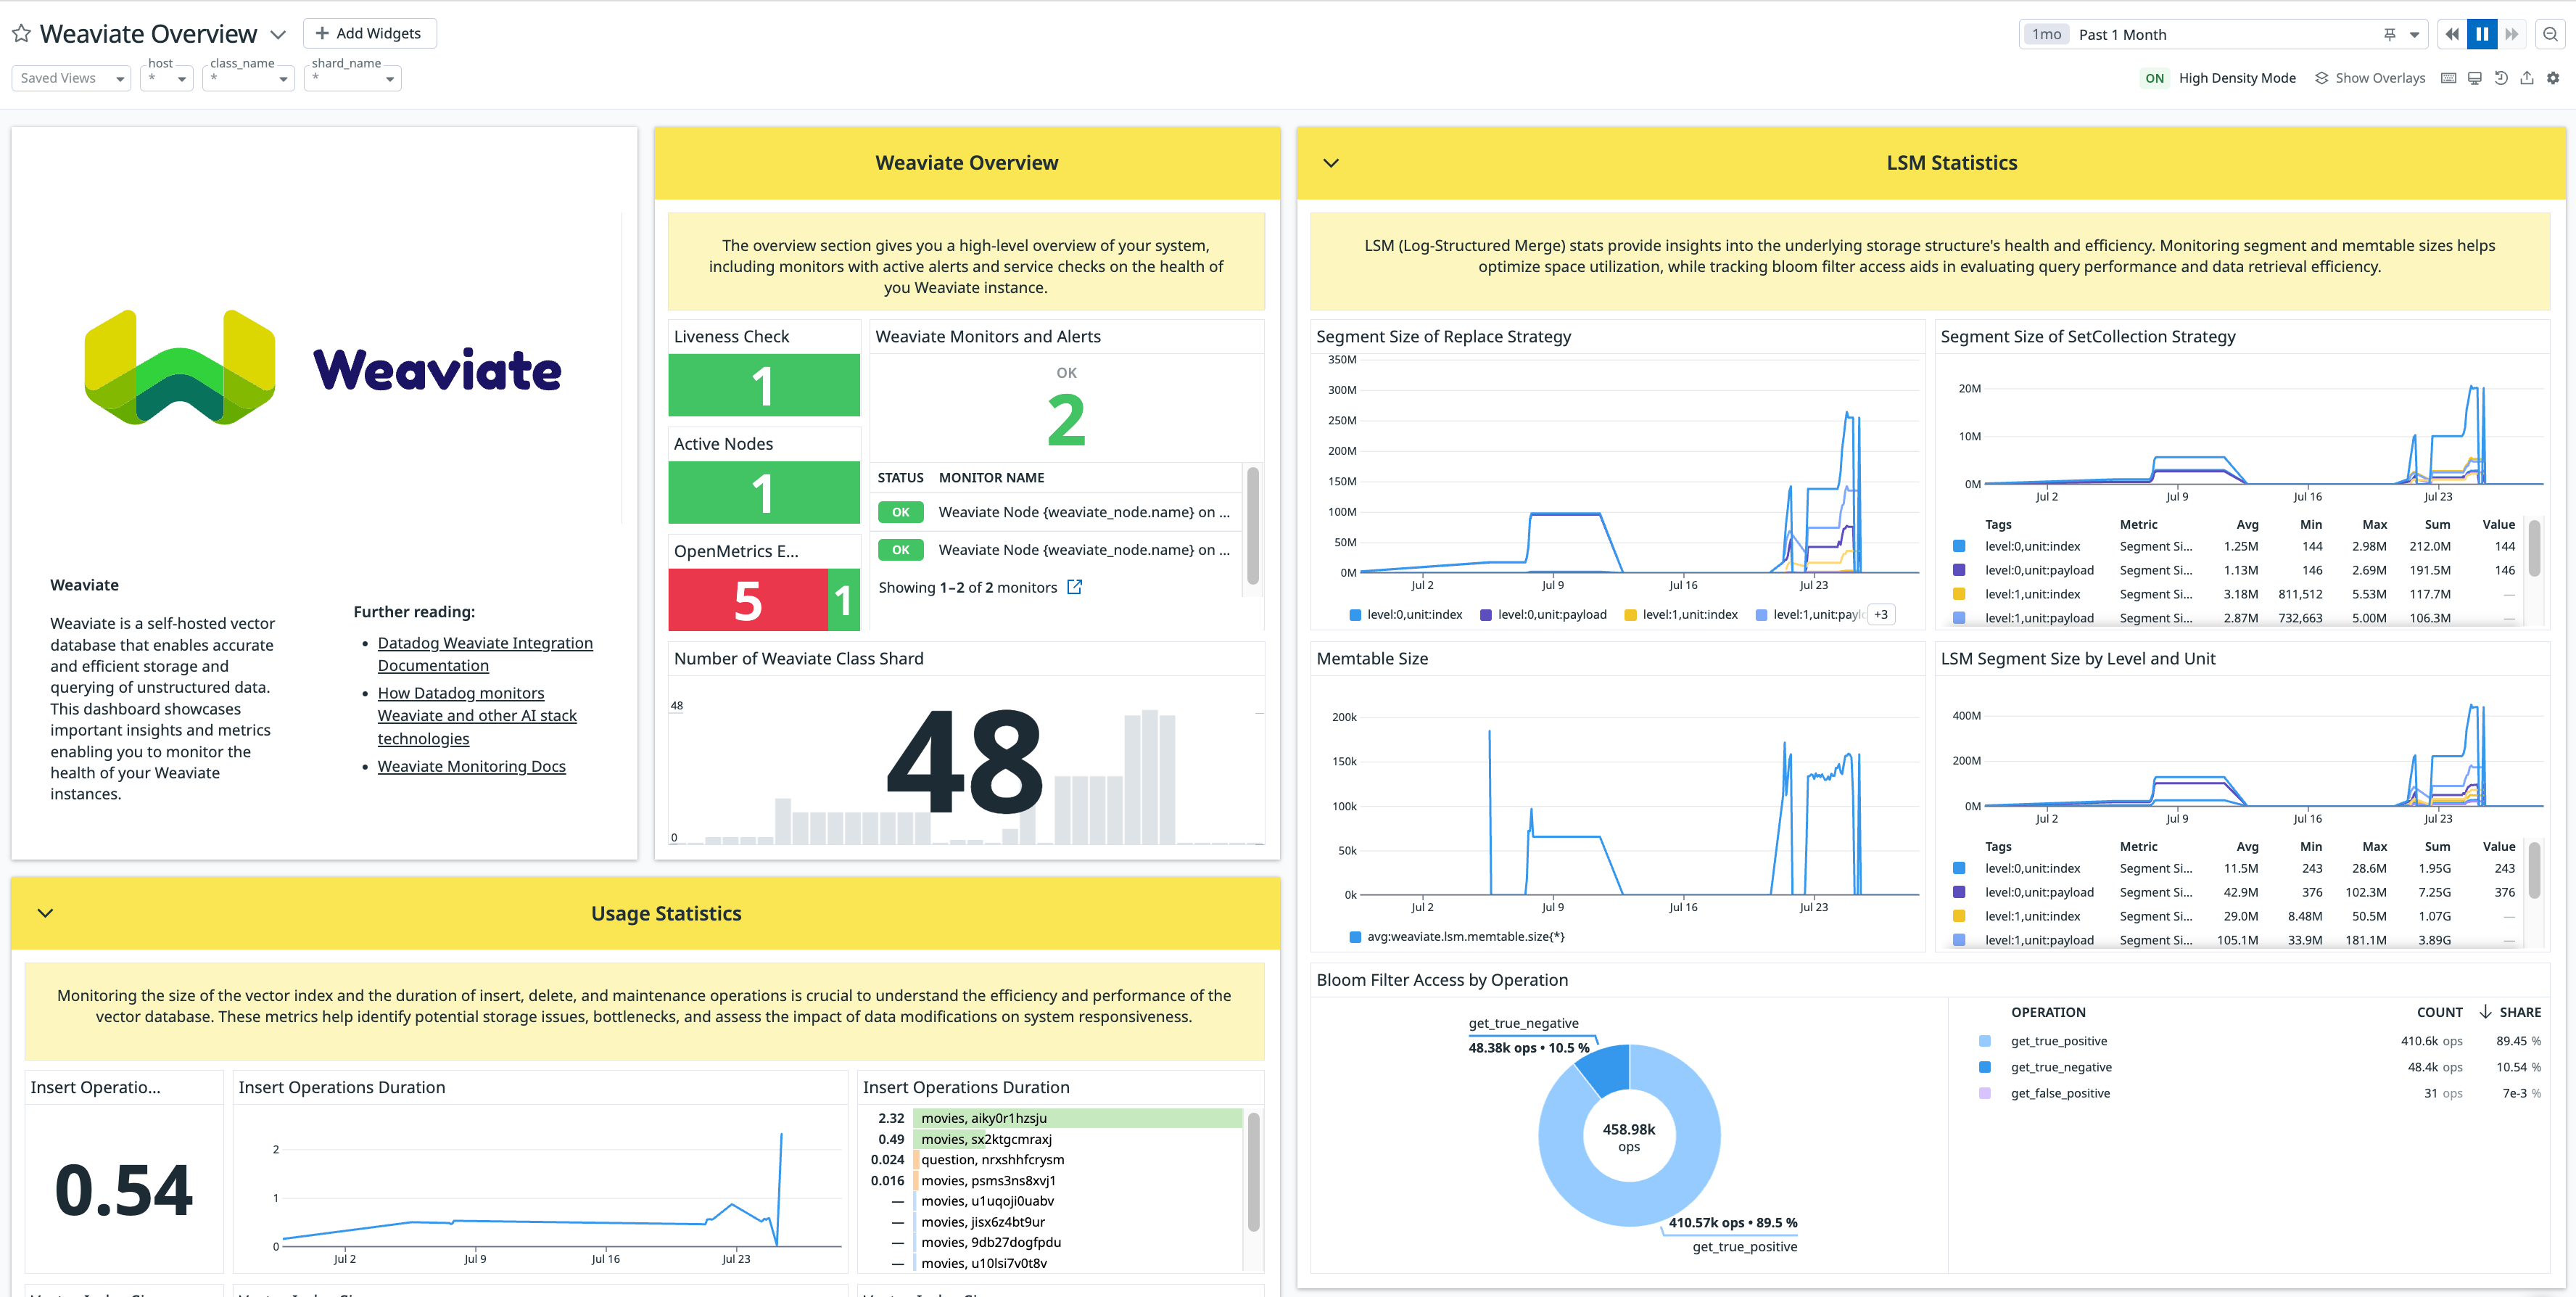
- Monitor usage statistics (such as duration of insert, delete, and maintenance operations) to identify potential storage issues, bottlenecks, and assess the impact of data modifications on system responsiveness.
- Track query latency, rate, and concurrent read/write requests to gain insight into the vector database’s overall responsiveness and load handling capabilities.
- Optimize write-heavy workloads with object statistics, like the average time taken for “put” (write) operations.
- Ensure smooth and efficient data ingestion with import-related metrics that offer insights into operations like data loading process.
This check monitors Weaviate through the Datadog Agent. For more information, see Weaviate monitoring. To learn more about Datadog’s suite of AI integrations, see this blog.
セットアップ
Follow the instructions below to install and configure this check for an Agent running on a host. For containerized environments, see the Autodiscovery Integration Templates for guidance on applying these instructions.
インストール
Starting from Agent release 7.47.0, the Weaviate check is included in the Datadog Agent package.
注: この機能を使用するには、Agent v7.47.0 以上が必要です。
構成
Weaviate can be configured to expose Prometheus-formatted metrics. The Datadog Agent can collect these metrics using the integration described below. Follow the instructions to configure data collection for your Weaviate instances. For the required configurations to expose the Prometheus metrics, see the Monitoring page in the Weaviate documentation.
In addition, a small subset of metrics can be collected by communicating with different API endpoints. Specifically:
/v1/meta: バージョン情報/v1/nodes: オブジェクトやシャードなどのノード固有のメトリクス/v1/.well-known/live: HTTP レスポンスタイムとサービスの有効性
Note: This check uses OpenMetrics for metric collection, which requires Python 3.
コンテナ化
メトリクスの収集
Make sure that the Prometheus-formatted metrics are exposed in your Weaviate cluster. You can configure and customize this by following the instructions on the Monitoring page in the Weaviate documentation. For the Agent to start collecting metrics, the Weaviate pods need to be annotated. For more information about annotations, refer to the Autodiscovery Integration Templates for guidance. You can find additional configuration options by reviewing the sample weaviate.d/conf.yaml
注: リストされたメトリクスは、利用可能な場合にのみ収集できます。一部のメトリクスは、特定のアクションが実行されたときにのみ生成されます。例えば、オブジェクト削除メトリクスは、オブジェクトが削除されたときにのみ公開されます。
Weaviate チェックの構成で最も重要なパラメーターは以下の 2 つです。
openmetrics_endpoint: This parameter should be set to the location where the Prometheus-formatted metrics are exposed. The default port is 2112, but it can be configured using the PROMETHEUS_MONITORING_PORT environment variable. In containerized environments, %%host%% should be used for host autodetection.weaviate_api_endpoint: This parameter is optional. By default, this parameter is set to <hostname>:8080 and it specifies the configuration of the RESTful API.
If authentication is required for the RESTful API endpoints, the check can be configured to provide an API key as part of the request header.
apiVersion: v1
kind: Pod
# (...)
metadata:
  name: '<POD_NAME>'
  annotations:
    ad.datadoghq.com/weaviate.checks: |
      {
        "weaviate": {
          "init_config": {},
          "instances": [
            {
              "openmetrics_endpoint": "http://%%host%%:2112/metrics",
              "weaviate_api_endpoint": "http://%%host%%:8080",
              "headers": {'Authorization': 'Bearer if_needed_for_auth'}
            }
          ]
        }
      }
    # (...)
spec:
  containers:
    - name: 'weaviate'
# (...)
Note: You can set these annotations directly in your Weaviate Helm chart using annotations key.
検証
Run the Agent’s status subcommand and look for weaviate under the Checks section.
収集データ
メトリクス
イベント
Weaviate インテグレーションには、イベントは含まれません。
サービスチェック
トラブルシューティング
ご不明な点は Datadog サポートまでお問い合わせください。
その他の参考資料
お役に立つドキュメント、リンクや記事: