- Principales informations
- Getting Started
- Datadog
- Site Datadog
- DevSecOps
- Serverless for AWS Lambda
- Agent
- Intégrations
- Conteneurs
- Dashboards
- Monitors
- Logs
- Tracing
- Profileur
- Tags
- API
- Service Catalog
- Session Replay
- Continuous Testing
- Surveillance Synthetic
- Incident Management
- Database Monitoring
- Cloud Security Management
- Cloud SIEM
- Application Security Management
- Workflow Automation
- CI Visibility
- Test Visibility
- Intelligent Test Runner
- Code Analysis
- Learning Center
- Support
- Glossary
- Standard Attributes
- Guides
- Agent
- Intégrations
- OpenTelemetry
- Développeurs
- Authorization
- DogStatsD
- Checks custom
- Intégrations
- Create an Agent-based Integration
- Create an API Integration
- Create a Log Pipeline
- Integration Assets Reference
- Build a Marketplace Offering
- Create a Tile
- Create an Integration Dashboard
- Create a Recommended Monitor
- Create a Cloud SIEM Detection Rule
- OAuth for Integrations
- Install Agent Integration Developer Tool
- Checks de service
- IDE Plugins
- Communauté
- Guides
- API
- Application mobile
- CoScreen
- Cloudcraft
- In The App
- Dashboards
- Notebooks
- DDSQL Editor
- Alertes
- Infrastructure
- Métriques
- Watchdog
- Bits AI
- Service Catalog
- API Catalog
- Error Tracking
- Service Management
- Infrastructure
- Universal Service Monitoring
- Conteneurs
- Sans serveur
- Surveillance réseau
- Cloud Cost
- Application Performance
- APM
- Profileur en continu
- Database Monitoring
- Agent Integration Overhead
- Setup Architectures
- Configuration de Postgres
- Configuration de MySQL
- Configuration de SQL Server
- Setting Up Oracle
- Setting Up MongoDB
- Connecting DBM and Traces
- Données collectées
- Exploring Database Hosts
- Explorer les métriques de requête
- Explorer des échantillons de requêtes
- Dépannage
- Guides
- Data Streams Monitoring
- Data Jobs Monitoring
- Digital Experience
- RUM et Session Replay
- Product Analytics
- Surveillance Synthetic
- Continuous Testing
- Software Delivery
- CI Visibility
- CD Visibility
- Test Visibility
- Exécuteur de tests intelligent
- Code Analysis
- Quality Gates
- DORA Metrics
- Securité
- Security Overview
- Cloud SIEM
- Cloud Security Management
- Application Security Management
- AI Observability
- Log Management
- Pipelines d'observabilité
- Log Management
- Administration
Manage Data Collection
Cette page n'est pas encore disponible en français, sa traduction est en cours.
Si vous avez des questions ou des retours sur notre projet de traduction actuel, n'hésitez pas à nous contacter.
Si vous avez des questions ou des retours sur notre projet de traduction actuel, n'hésitez pas à nous contacter.
Overview
Error Tracking provides fine-grained control of which errors to ingest, helping you reduce noise and avoid unexpected costs.
You can define what data is included in Error Tracking in two ways:
You can configure both rules and rate limits on the Logs > Error Tracking > Settings page.
Rules
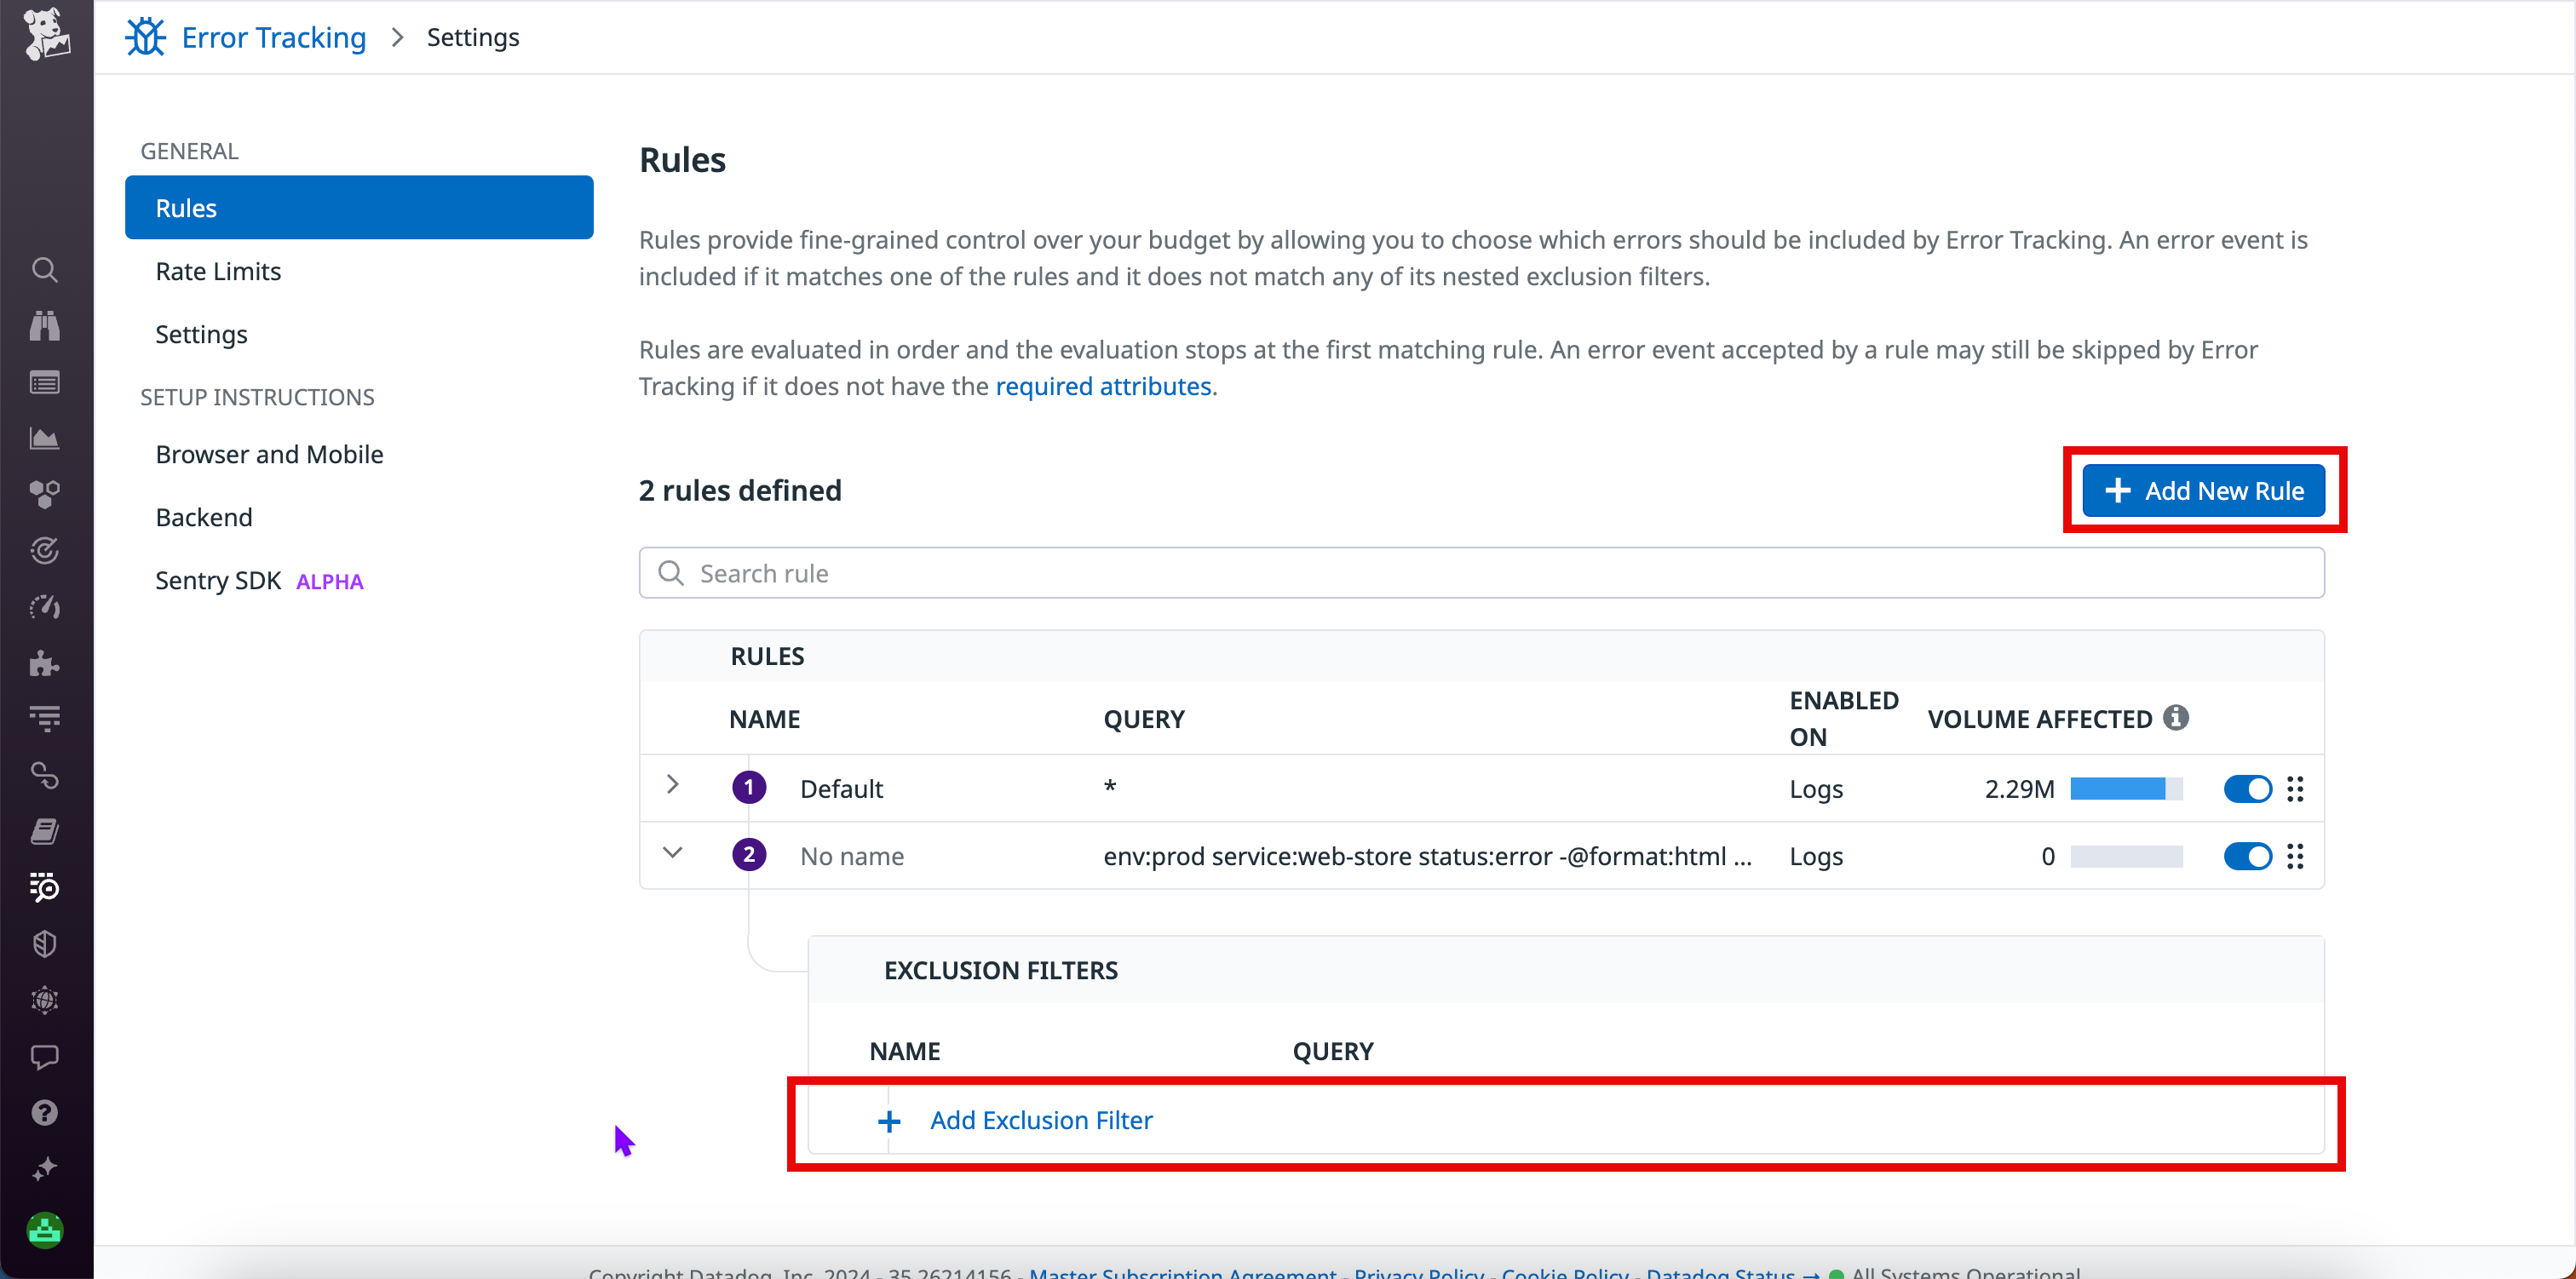
Rules allow you to select which errors are ingested into Error Tracking.
Each rule consists of:
- An inclusion filter, which contains a log search query, such as
service:my-web-store. - Optionally, one or more nested exclusion filters to further refine the rule. For example, an exclusion filter might use the
env:stagingquery to exclude staging logs.
A given rule can be toggled on or off. An error event is included if it matches a query in one of the active inclusion filters, and it does not match any active nested exclusion queries.
Note: Error events that get accepted by a rule might still be excluded from Error Tracking if they lack the required attributes.
Evaluation order
Rules are evaluated in order, with the evaluation stopping at the first matching rule. The priority of the rules and their nested filters depends on their order in the list.
Default rules
By default, Error Tracking has an * inclusion filter and no exclusion filters. This means all error logs with the requirements to be fingerprinted are ingested into Error Tracking.
Add a rule
To add a rule (inclusion filter):
- Navigate to Error Tracking Settings.
- Click Add New Rule.
- Enter a name in the Name field.
- Enter a log search query in the Define rule query field.
- Click Add new rule.
- Optionally, reorder the rules to change their evaluation order. Click and drag the six-dot icon on a given rule to move the rule up or down in the list.
Add a nested exclusion filter to a rule
- Expand the rule for which you want to add an exclusion filter.
- Click Add Exclusion Filter.
- Enter a name in the Name field.
- Enter a log search query in the Define exclusion filter query field.
- Click Save Exclusion Filter.
Rate limits
Rate limits allow you to control the number of indexed error logs included in Error Tracking per day. This cap applies to all indexed error logs that match the inclusion filter of a rule.
After the daily cap is reached, ingestion stops until the next day. You can modify or remove the cap at any time.
Set a rate limit
To set a rate limit:
- Navigate to Logs > Error Tracking > Settings.
- Click Rate Limits.
- Edit the errors/month field.
- Click Save Rate Limit.
A Rate limit applied event is generated when the rate limit is reached. See the Event Management documentation for details on viewing and using events.
Monitoring usage
You can monitor your Error Tracking usage by setting up monitors and alerts for the datadog.estimated_usage.error_tracking.logs.events metric, which tracks the number of ingested error logs.
This metric is available by default at no additional cost, and its data is retained for 15 months.
Further Reading
Documentation, liens et articles supplémentaires utiles:


