- Principales informations
- Getting Started
- Datadog
- Site Datadog
- DevSecOps
- Serverless for AWS Lambda
- Agent
- Intégrations
- Conteneurs
- Dashboards
- Monitors
- Logs
- Tracing
- Profileur
- Tags
- API
- Service Catalog
- Session Replay
- Continuous Testing
- Surveillance Synthetic
- Incident Management
- Database Monitoring
- Cloud Security Management
- Cloud SIEM
- Application Security Management
- Workflow Automation
- CI Visibility
- Test Visibility
- Intelligent Test Runner
- Code Analysis
- Learning Center
- Support
- Glossary
- Standard Attributes
- Guides
- Agent
- Intégrations
- OpenTelemetry
- Développeurs
- Authorization
- DogStatsD
- Checks custom
- Intégrations
- Create an Agent-based Integration
- Create an API Integration
- Create a Log Pipeline
- Integration Assets Reference
- Build a Marketplace Offering
- Create a Tile
- Create an Integration Dashboard
- Create a Recommended Monitor
- Create a Cloud SIEM Detection Rule
- OAuth for Integrations
- Install Agent Integration Developer Tool
- Checks de service
- IDE Plugins
- Communauté
- Guides
- API
- Application mobile
- CoScreen
- Cloudcraft
- In The App
- Dashboards
- Notebooks
- DDSQL Editor
- Alertes
- Infrastructure
- Métriques
- Watchdog
- Bits AI
- Service Catalog
- API Catalog
- Error Tracking
- Service Management
- Infrastructure
- Universal Service Monitoring
- Conteneurs
- Sans serveur
- Surveillance réseau
- Cloud Cost
- Application Performance
- APM
- Profileur en continu
- Database Monitoring
- Agent Integration Overhead
- Setup Architectures
- Configuration de Postgres
- Configuration de MySQL
- Configuration de SQL Server
- Setting Up Oracle
- Setting Up MongoDB
- Connecting DBM and Traces
- Données collectées
- Exploring Database Hosts
- Explorer les métriques de requête
- Explorer des échantillons de requêtes
- Dépannage
- Guides
- Data Streams Monitoring
- Data Jobs Monitoring
- Digital Experience
- RUM et Session Replay
- Product Analytics
- Surveillance Synthetic
- Continuous Testing
- Software Delivery
- CI Visibility
- CD Visibility
- Test Visibility
- Exécuteur de tests intelligent
- Code Analysis
- Quality Gates
- DORA Metrics
- Securité
- Security Overview
- Cloud SIEM
- Cloud Security Management
- Application Security Management
- AI Observability
- Log Management
- Pipelines d'observabilité
- Log Management
- Administration
SLO Performance Dashboard for Leadership
Cette page n'est pas encore disponible en français, sa traduction est en cours.
Si vous avez des questions ou des retours sur notre projet de traduction actuel, n'hésitez pas à nous contacter.
Si vous avez des questions ou des retours sur notre projet de traduction actuel, n'hésitez pas à nous contacter.
Overview
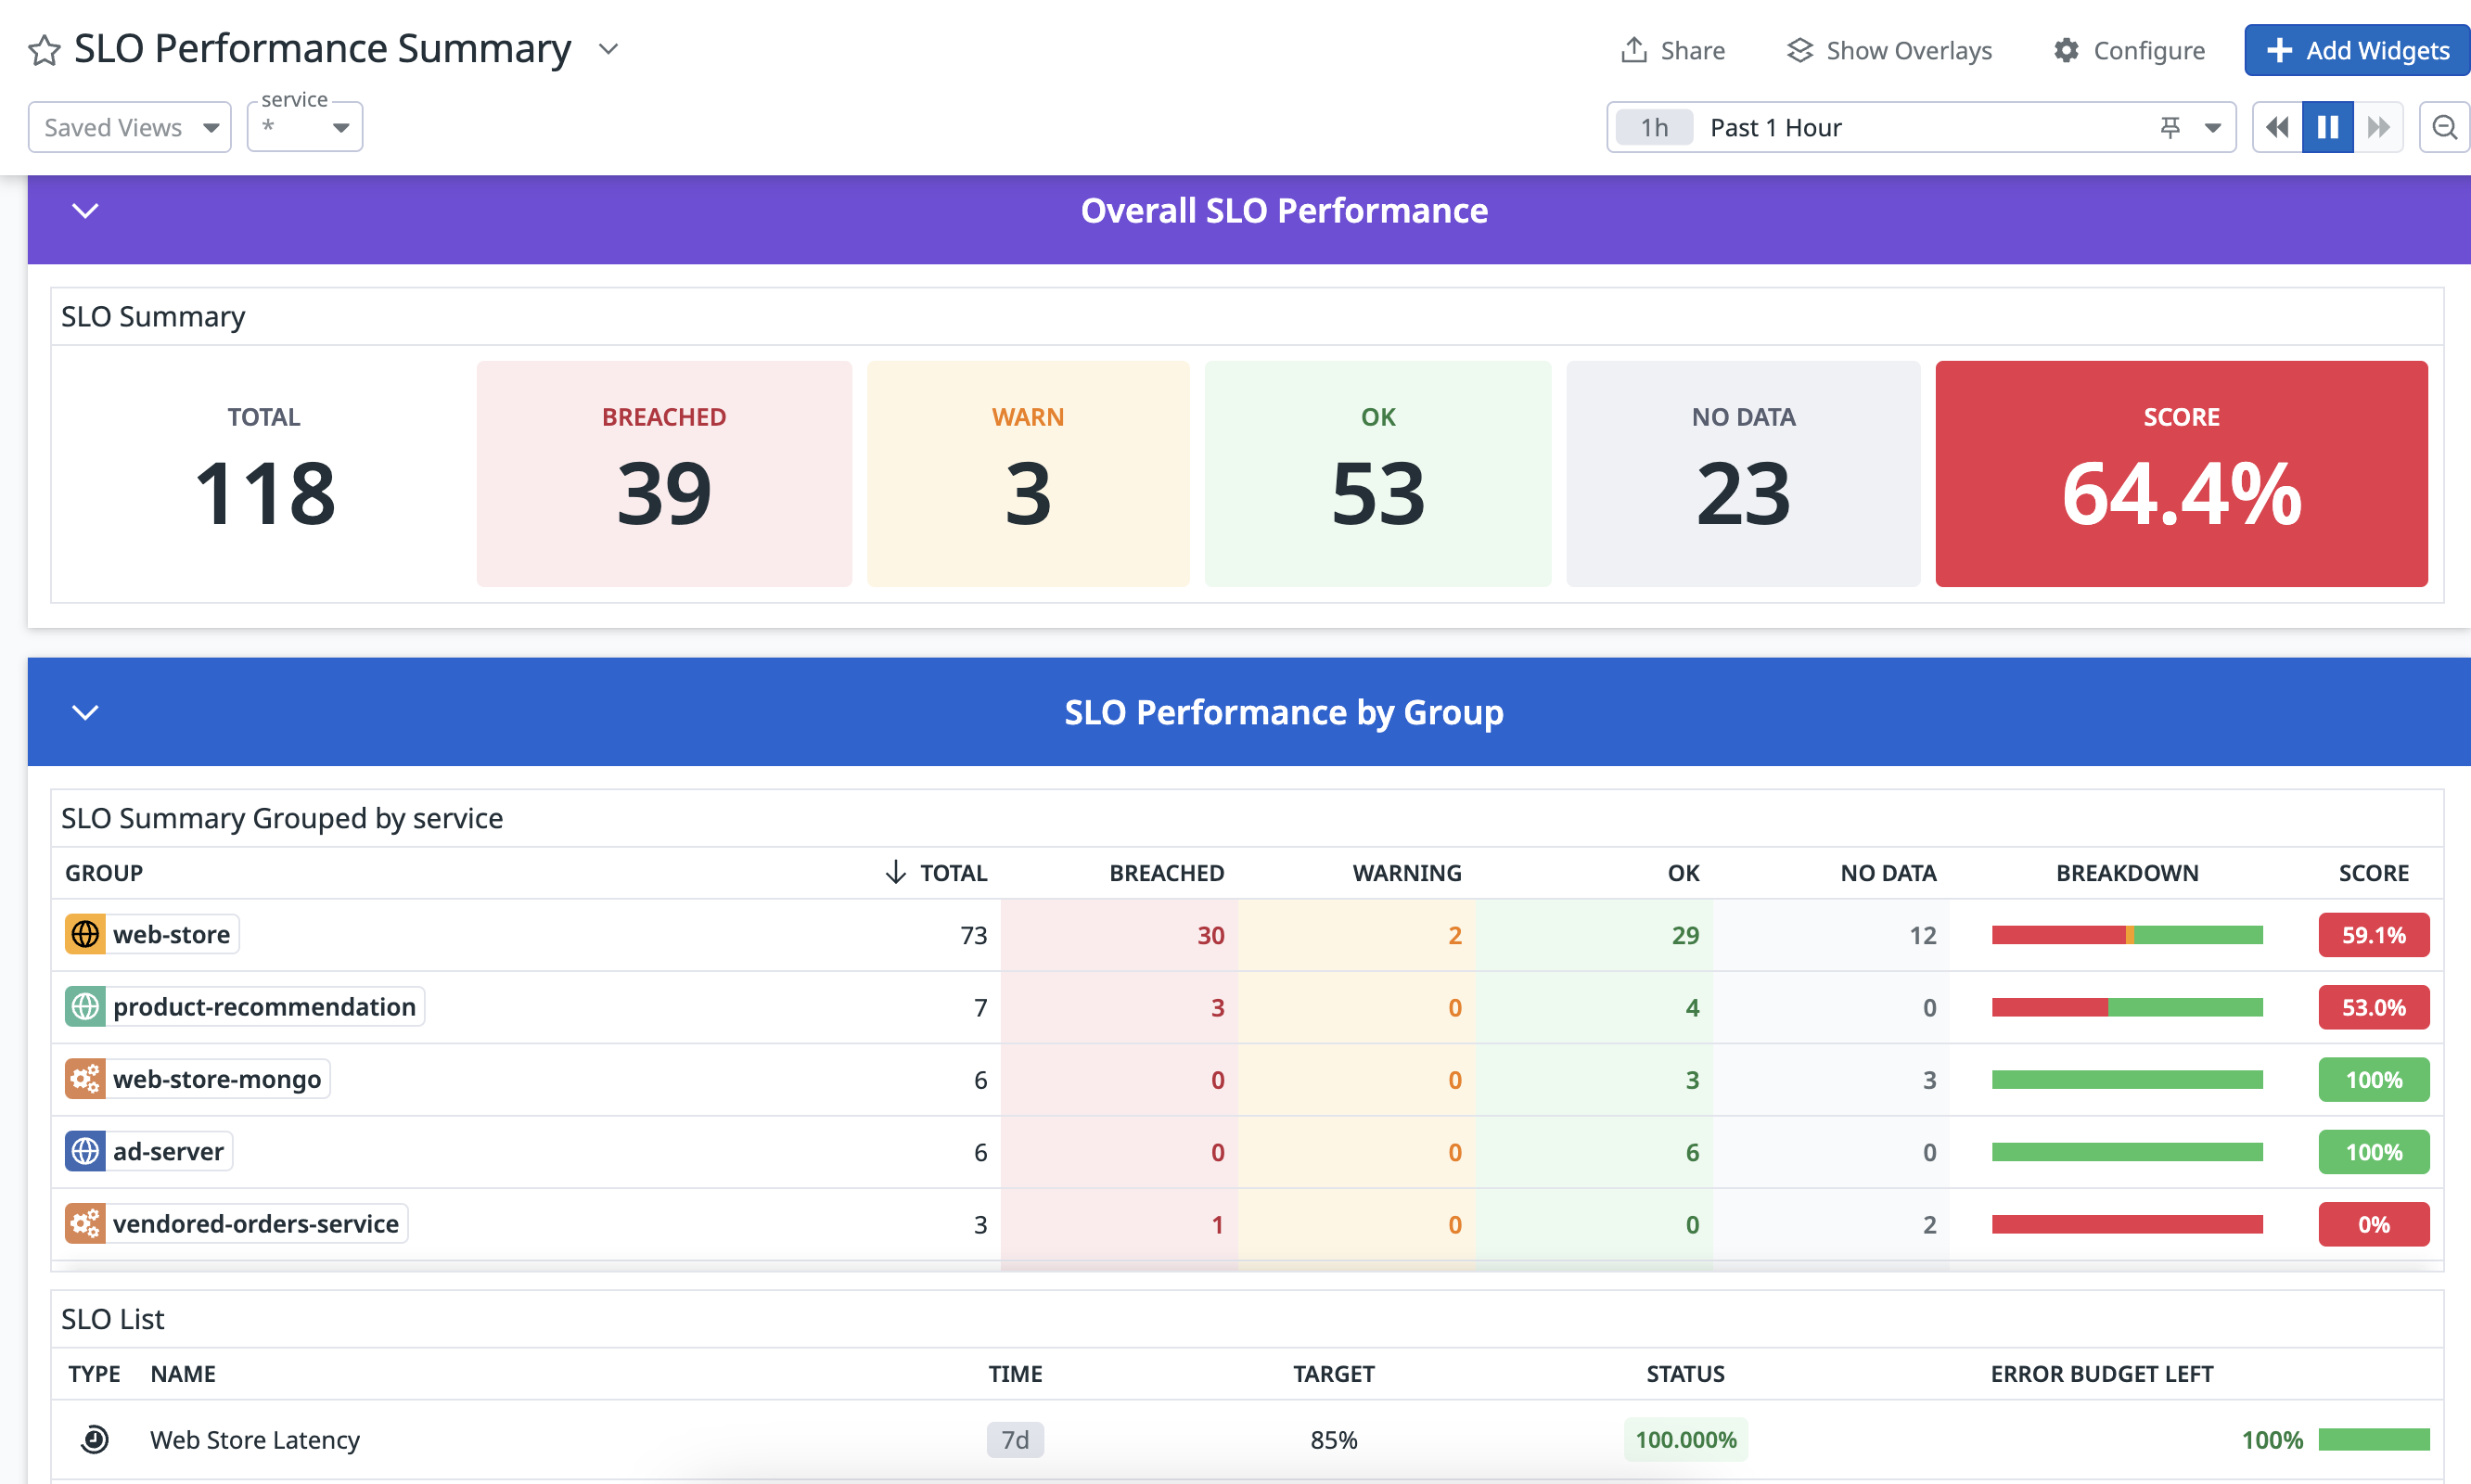
The SLO Performance Summary Dashboard supports aggregated views of SLOs to help executive leadership understand your organization’s reliability at a glance. With this out-of-the-Box (OOTB) dashboard, you can:
- Customize your SLO groupings to be based on service, team, user journey, or any other tag that has been added to your SLOs.
- Use a summary Score, based on the remaining error budget of the underlying SLOs, to understand SLO performance across different groups and identify areas of improvement.
Try Out the SLO Performance Summary Dashboard
The SLO Performance Summary Dashboard is in Private Beta. Complete the form to request access.
Request AccessAccess your OOTB SLO Performance Summary Dashbord by filtering for SLO Performance Summary in the search query of the Dashboard List or by clicking on the Analytics button on the top right corner of the SLO status page.
Interact with your SLO performance summary dashboard
By default, the SLO Performance Summary Dashbord is based on the service tag added to your SLOs. This allows you to view your organization’s SLO performance by service groupings to understand which services are performing best and worst.
Summary score
The SLO Summary widget in the OOTB dashboard includes a “Score”. It is designed as a summary metric for executive leadership to understand the performance of a group of SLOs. The Score is calculated based on the average remaining error budget of the underlying SLOs, which is then mapped to a score between 0 - 100:
- The Score is “passing” (green/yellow) when most SLOs are not breached and have remaining error budget
- The Score is “failing” (red) when many SLOs are out of error budget or a few SLOs are far out of error budget
- SLOs in the “No Data” state are not considered in the Score
Note that an average remaining error budget of 0% corresponds to a Score value of 66.667. The Score’s status and color is based on the following thresholds:
- Red: 0 ≤ Score < 66.667
- Yellow: 66.667 ≤ Score < 80
- Green: 80 ≤ Score ≤ 100
Customize your SLO performance summary dashbord
To customize your SLO Performance Summary Dashbord, click Configure in the dashboard and select Clone dashboard. The default dashboard is configured based on the service tag that’s been added to SLOs. You can update the dashboard to be based on any SLO tag by taking the following steps:
- Update the configuration for every widget in the default dashboard to use your desired tag, instead of
service - Add a template variable based on your desired tag (or replace the existing
servicetemplate variable)
For instance, if you have added a journey tag to your SLOs, you can clone the SLO Performance Summary Dashbord and customize it to be based on the journey tag:
Further Reading
Documentation, liens et articles supplémentaires utiles:

