- Essentials
- Getting Started
- Datadog
- Datadog Site
- DevSecOps
- Serverless for AWS Lambda
- Agent
- Integrations
- Containers
- Dashboards
- Monitors
- Logs
- APM Tracing
- Profiler
- Tags
- API
- Service Catalog
- Session Replay
- Continuous Testing
- Synthetic Monitoring
- Incident Management
- Database Monitoring
- Cloud Security Management
- Cloud SIEM
- Application Security Management
- Workflow Automation
- CI Visibility
- Test Visibility
- Intelligent Test Runner
- Code Analysis
- Learning Center
- Support
- Glossary
- Standard Attributes
- Guides
- Agent
- Integrations
- OpenTelemetry
- Developers
- Authorization
- DogStatsD
- Custom Checks
- Integrations
- Create an Agent-based Integration
- Create an API Integration
- Create a Log Pipeline
- Integration Assets Reference
- Build a Marketplace Offering
- Create a Tile
- Create an Integration Dashboard
- Create a Recommended Monitor
- Create a Cloud SIEM Detection Rule
- OAuth for Integrations
- Install Agent Integration Developer Tool
- Service Checks
- IDE Plugins
- Community
- Guides
- API
- Datadog Mobile App
- CoScreen
- Cloudcraft
- In The App
- Dashboards
- Notebooks
- DDSQL Editor
- Sheets
- Monitors and Alerting
- Infrastructure
- Metrics
- Watchdog
- Bits AI
- Service Catalog
- API Catalog
- Error Tracking
- Service Management
- Infrastructure
- Application Performance
- APM
- Continuous Profiler
- Database Monitoring
- Data Streams Monitoring
- Data Jobs Monitoring
- Digital Experience
- Real User Monitoring
- Product Analytics
- Synthetic Testing and Monitoring
- Continuous Testing
- Software Delivery
- CI Visibility
- CD Visibility
- Test Visibility
- Intelligent Test Runner
- Code Analysis
- Quality Gates
- DORA Metrics
- Security
- Security Overview
- Cloud SIEM
- Cloud Security Management
- Application Security Management
- AI Observability
- Log Management
- Observability Pipelines
- Log Management
- Administration
Increase Process Retention
Overview
While Live Processes data is stored for 36 hours, you can generate global and percentile distribution metrics from your processes to monitor your resource consumption long-term. Process-based metrics are stored for 15 months like any other Datadog metric. This can help you:
- Debug past and ongoing infrastructure issues
- Identify trends in the resource consumption of your critical workloads
- Assess the health of your system before and after load or stress tests
- Track the effect of software deployments on the health of your underlying hosts or containers
Generate a process-based metric
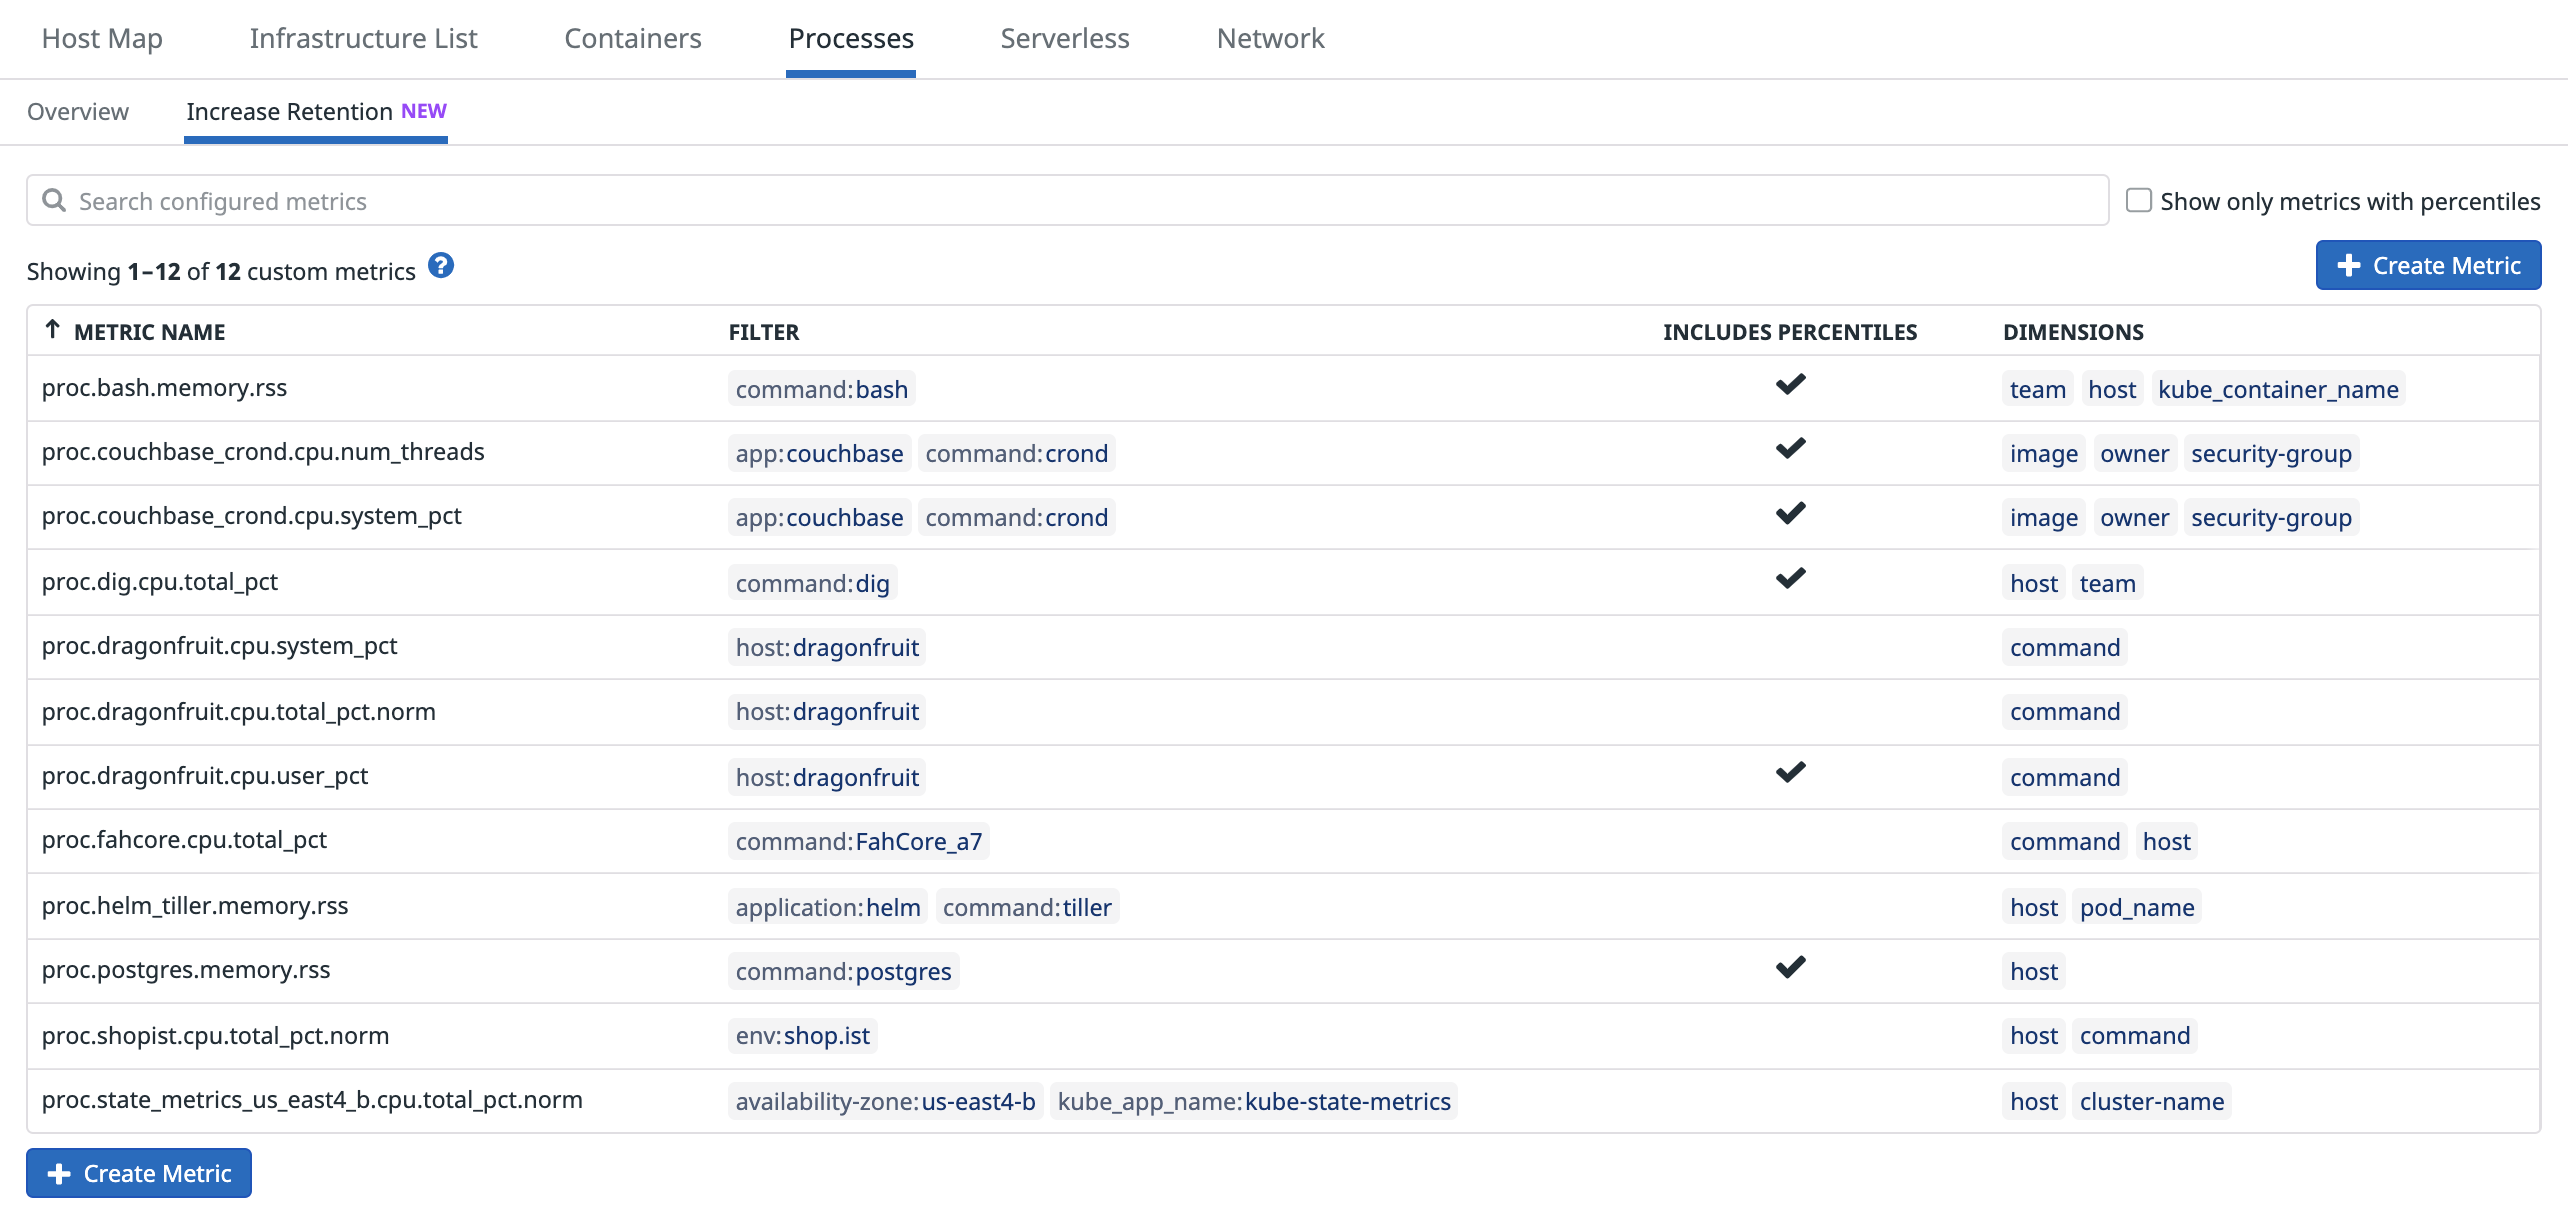
You can generate a new process-based metric directly from queries in the Live Processes page, or in the Manage Metrics tab, by clicking + New Metric.
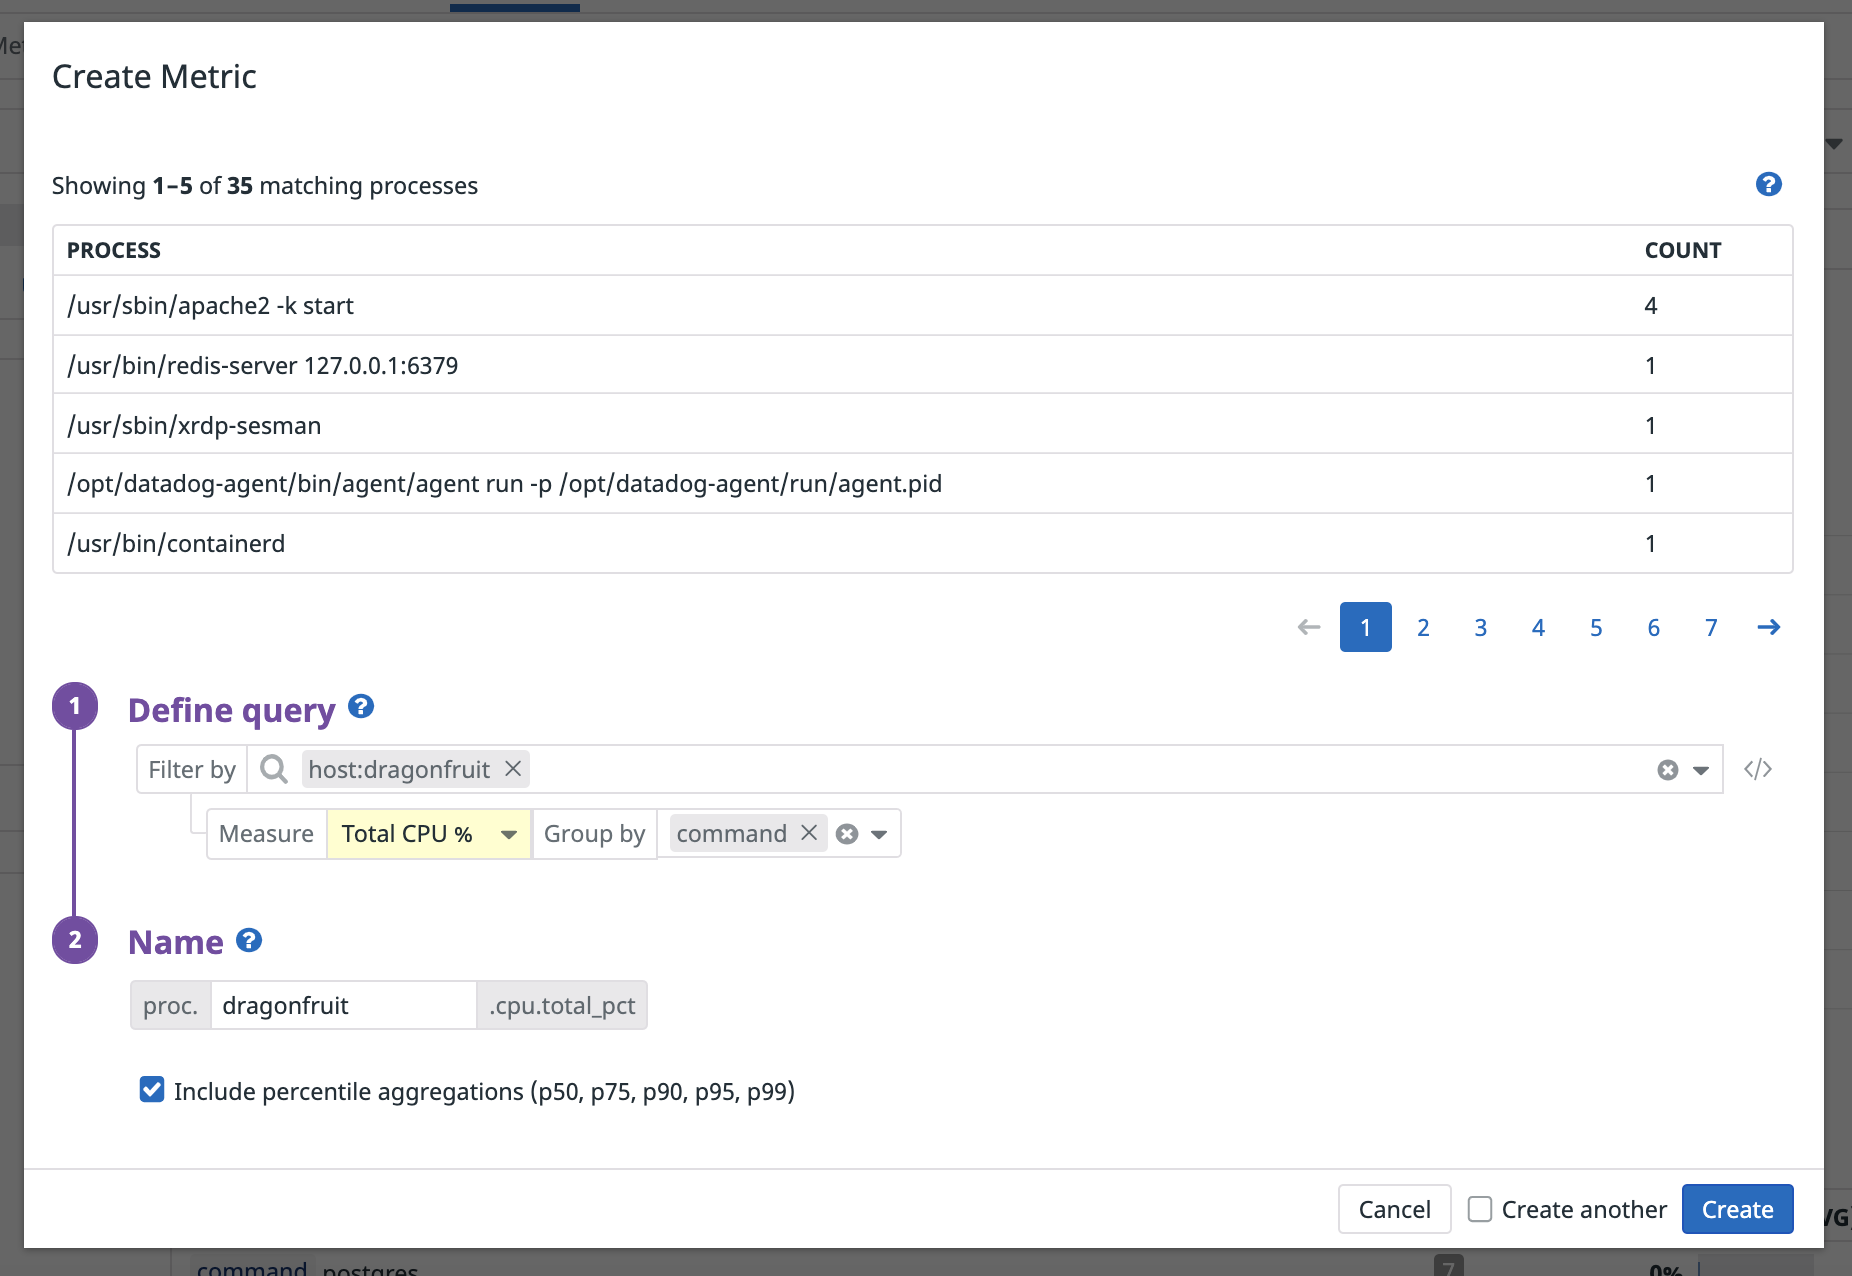
Add a new process-based metric
- Select tags to filter your query: The query syntax is the same as for Live Processes. Only processes matching the scope of your filters are considered for aggregation. Text search filters are supported only on the Live Processes page.
- Select the measure you would like to track: Enter a measure such as
Total CPU %to aggregate a numeric value and create its correspondingcount,min,max,sum, andavgaggregated metrics. - Add tags to
group by: Select tags to be added as dimensions to your metrics, so they can be filtered, aggregated, and compared. By default, metrics generated from processes do not have any tags unless explicitly added. Any tag available for Live Processes queries can be used in this field. - Name your metric: Fill in the name of your metric. Process-based metrics always have the prefix proc. and suffix [measure_selection].
- Add percentile aggregations: Select the Include percentile aggregations checkbox to generate p50, p75, p90, p95, and p99 percentiles. Percentile metrics are also considered customer metrics, and billed accordingly.
You can create multiple metrics using the same query by selecting the Create Another checkbox at the bottom of the metric creation modal. When selected, the modal remains open after your metric has been created, with the filters and aggregation groups already filled in.
Note: Data points for process-based metrics are generated at ten second intervals. There may be up to a 3-minute delay from the moment the metric is created or updated, to the moment the first data point is reported.
Process-based metrics are considered custom metrics and billed accordingly. Avoid grouping by unbounded or extremely high cardinality tags like
command and user to avoid impacting your billing.Update a process-based metric
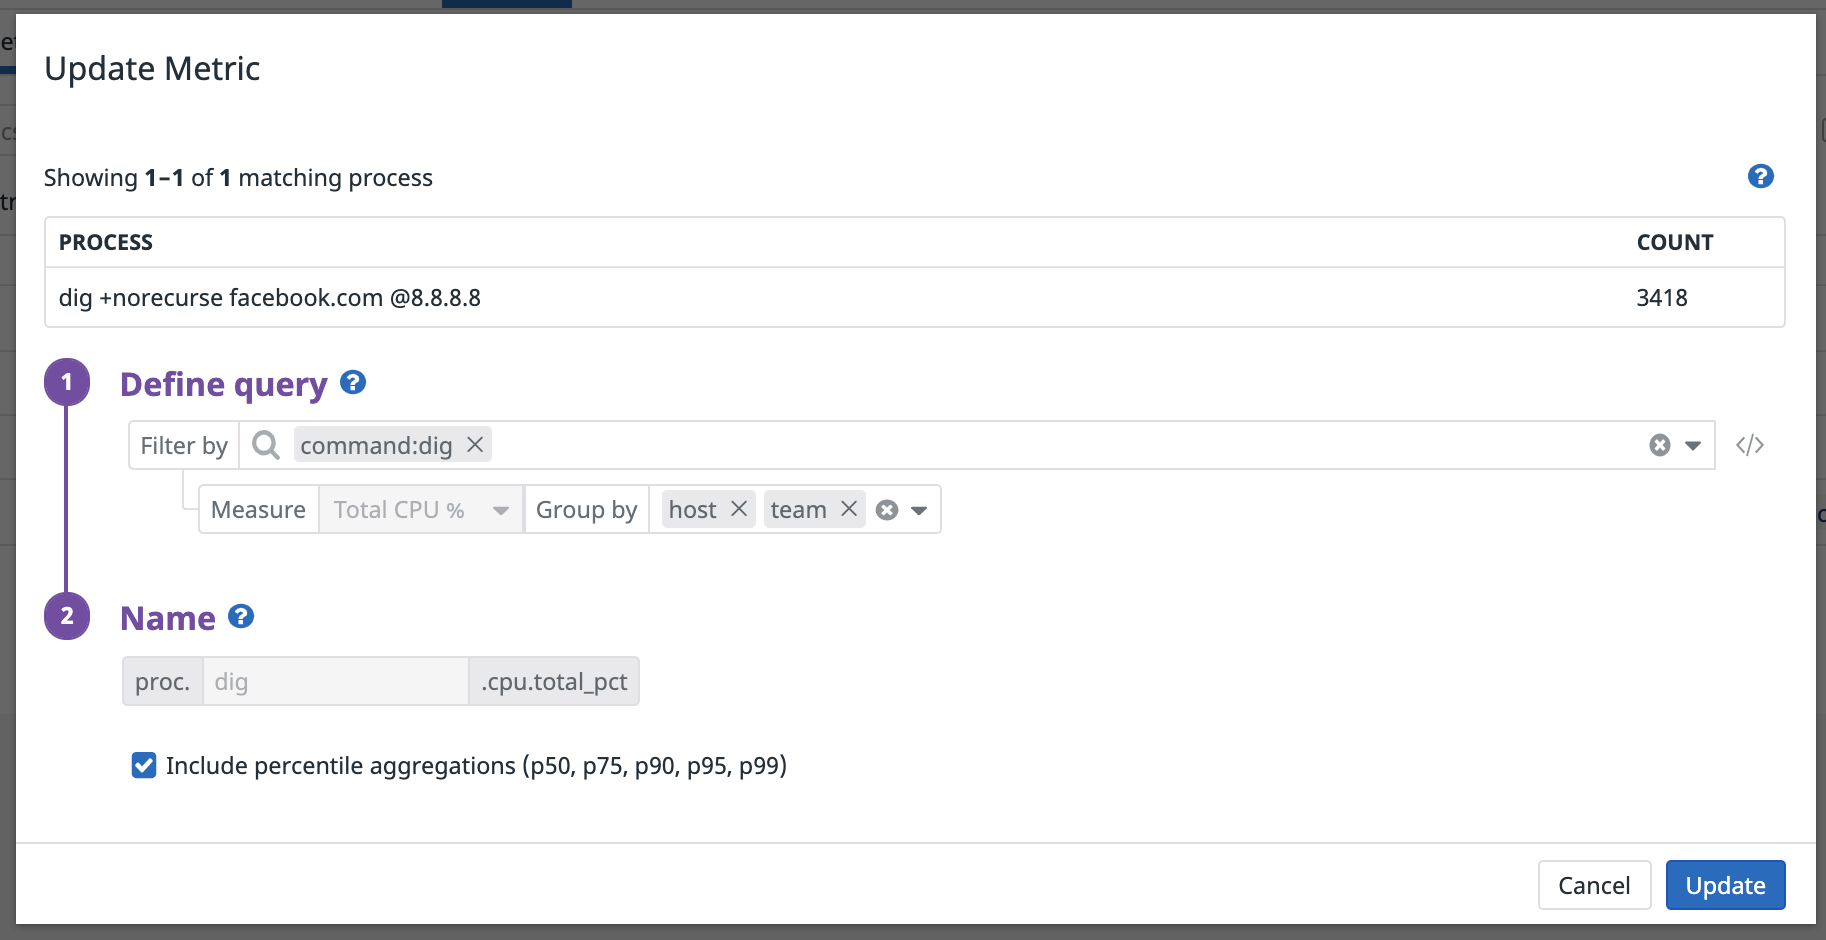
After a metric is created, the following fields can be updated:
- Filter query: Add or remove tags from the ‘Filter by’ field to change the set of matching processes for which metrics are generated.
- Aggregation groups: Add or remove tags from the ‘Group by’ field to break down your metrics in different ways, or manage their cardinality.
- Percentile selection: Check or uncheck the ‘Include percentile aggregations’ box to remove or generate percentile metrics.
To change the metric type or name, a new metric must be created.
Leverage process metrics across the Datadog platform
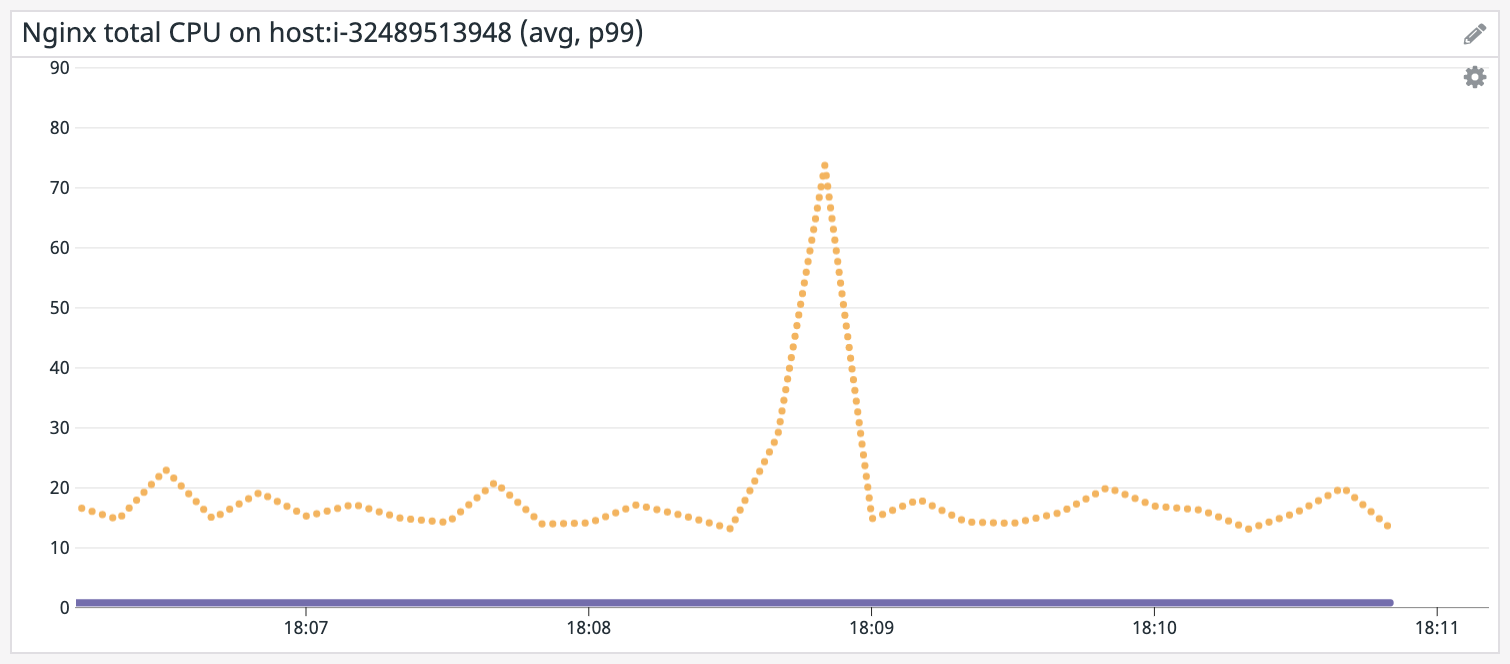
Once created, you can use process distribution aggregate and percentile metrics like any other in Datadog. For instance:
- Graph process-based metrics in dashboards and notebooks to track the historical resource consumption of important workloads
- Create threshold or anomaly-based monitors on top of process-based metrics to detect when CPU or RSS memory dips or spikes unexpectedly
- Use Metric Correlations to contextualize changes in resource consumption against internal and third-party software performance
Further reading
Additional helpful documentation, links, and articles:


