- Essentials
- Getting Started
- Datadog
- Datadog Site
- DevSecOps
- Serverless for AWS Lambda
- Agent
- Integrations
- Containers
- Dashboards
- Monitors
- Logs
- APM Tracing
- Profiler
- Tags
- API
- Service Catalog
- Session Replay
- Continuous Testing
- Synthetic Monitoring
- Incident Management
- Database Monitoring
- Cloud Security Management
- Cloud SIEM
- Application Security Management
- Workflow Automation
- CI Visibility
- Test Visibility
- Intelligent Test Runner
- Code Analysis
- Learning Center
- Support
- Glossary
- Standard Attributes
- Guides
- Agent
- Integrations
- OpenTelemetry
- Developers
- Authorization
- DogStatsD
- Custom Checks
- Integrations
- Create an Agent-based Integration
- Create an API Integration
- Create a Log Pipeline
- Integration Assets Reference
- Build a Marketplace Offering
- Create a Tile
- Create an Integration Dashboard
- Create a Recommended Monitor
- Create a Cloud SIEM Detection Rule
- OAuth for Integrations
- Install Agent Integration Developer Tool
- Service Checks
- IDE Plugins
- Community
- Guides
- API
- Datadog Mobile App
- CoScreen
- Cloudcraft
- In The App
- Dashboards
- Notebooks
- DDSQL Editor
- Sheets
- Monitors and Alerting
- Infrastructure
- Metrics
- Watchdog
- Bits AI
- Service Catalog
- API Catalog
- Error Tracking
- Service Management
- Infrastructure
- Application Performance
- APM
- Continuous Profiler
- Database Monitoring
- Data Streams Monitoring
- Data Jobs Monitoring
- Digital Experience
- Real User Monitoring
- Product Analytics
- Synthetic Testing and Monitoring
- Continuous Testing
- Software Delivery
- CI Visibility
- CD Visibility
- Test Visibility
- Intelligent Test Runner
- Code Analysis
- Quality Gates
- DORA Metrics
- Security
- Security Overview
- Cloud SIEM
- Cloud Security Management
- Application Security Management
- AI Observability
- Log Management
- Observability Pipelines
- Log Management
- Administration
Apache APISIX
Supported OS
Overview
Apache APISIX is a dynamic, real-time, high-performance API gateway, and it provides rich traffic management features such as load balancing, dynamic upstream, canary release, circuit breaking, authentication, observability, and more. For example, use Apache APISIX to handle traditional north-south traffic, as well as east-west traffic between services. It can also be used as a Kubernetes ingress controller.
The APISIX-Datadog plugin pushes its custom metrics to the DogStatsD server and comes bundled with the Datadog Agent over the UDP connection. DogStatsD is an implementation of StatsD protocol. It collects the custom metrics for Apache APISIX agent, aggregates it into a single data point, and sends it to the configured Datadog server.
Setup
Installation
Follow the configuration instructions below.
Configuration
- If you are already using Datadog and have the Datadog Agent installed, make sure port 8125/UDP is allowed through your firewall. For example, the Apache APISIX agent can reach port 8125 of the Datadog Agent. If you already have this configured, you can skip to step 3.
To learn more about how to install the Datadog Agent, see the Agent documentation.
If you are new to Datadog:
- First, create an account by visiting the Datadog website and click on the Get Started Free button.
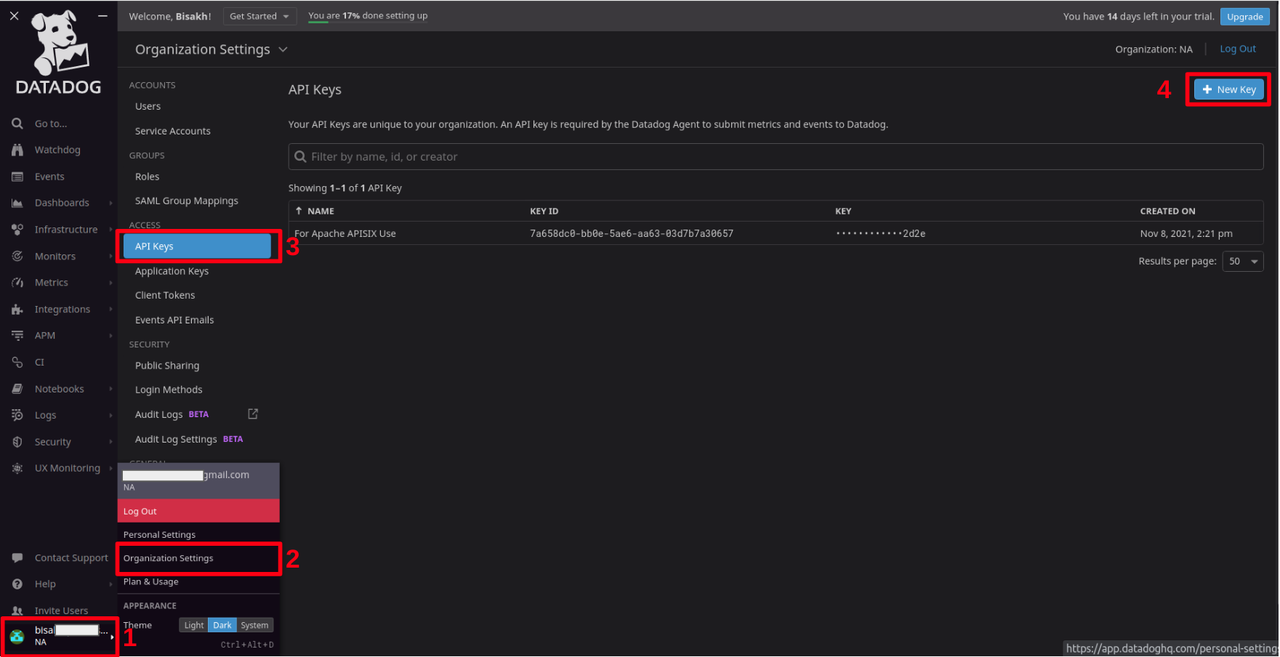
- Generate an API Key.

The APISIX-Datadog plugin requires only the DogStatsD component of
datadog/agentas the plugin asynchronously send metrics to the DogStatsD server following the statsd protocol over standard UDP socket. That’s why APISIX recommends using the standalonedatadog/dogstatsdimage instead of using the full agent. It’s extremely lightweight (only ~11 MB in size) compared to ~2.8GB ofdatadog/agentimage.
To run it as a container:
# pull the latest image
$ docker pull datadog/dogstatsd:latest
# run a detached container
$ docker run -d --name dogstatsd-agent -e DD_API_KEY=<Your API Key from step 2> -p 8125:8125/udp  datadog/dogstatsd
If you are using Kubernetes in your production environment, you can deploy dogstatsd as a Daemonset or as a Multi-Container Pod alongside Apache APISIX agent.
- The following is an example on how to activate the Datadog plugin for a specific route. This assumes the
dogstatsdagent is already up and running.
# enable plugin for a specific route
$ curl http://127.0.0.1:9080/apisix/admin/routes/1 -H 'X-API-KEY: edd1c9f034335f136f87ad84b625c8f1' -X PUT -d '
{
  "plugins": {
    "datadog": {}
  },
  "upstream": {
    "type": "roundrobin",
    "nodes": {
      "127.0.0.1:1980": 1
    }
  },
  "uri": "/hello"
}'
Now any requests to endpoint URI /hello will generate the above metrics and push it to local DogStatsD server of the Datadog Agent.
- To deactivate the plugin, remove the corresponding JSON configuration in the plugin configuration to disable
datadog. APISIX plugins are hot-reloaded, therefore there is no need to restart APISIX.
# disable plugin for a route
curl http://127.0.0.1:9080/apisix/admin/routes/1 -H 'X-API-KEY: edd1c9f034335f136f87ad84b625c8f1' -X PUT -d '
{
  "uri": "/hello",
  "plugins": {},
  "upstream": {
    "type": "roundrobin",
    "nodes": {
      "127.0.0.1:1980": 1
    }
  }
}'
- See the Datadog Plugin documentation for additional custom configuration options.
Validation
Run the Agent’s status subcommand and look for apisix under the Checks section.
Data Collected
Metrics
| apisix.request.counter (count) | Number of requests received Shown as connection |
| apisix.request.latency (gauge) | Total latency of the request response lifecycle, time taken to process the particular request. Shown as millisecond |
| apisix.upstream.latency (gauge) | The latency between time taken from proxying the request to the upstream server till a response is received. Shown as millisecond |
| apisix.apisix.latency (gauge) | The latency added by Apache APISIX, time taken by APISIX agent solely to process the request. Shown as millisecond |
| apisix.ingress.size (gauge) | The body size of incoming request before forwarding it to upstream server. Shown as byte |
| apisix.egress.size (gauge) | The body size of received response coming from the APISIX forwarded upstream server. Shown as byte |
Events
The Apache APISIX check does not include any events.
Troubleshooting
Need help? Contact Datadog support.
