- 重要な情報
- はじめに
- Datadog
- Datadog サイト
- DevSecOps
- AWS Lambda のサーバーレス
- エージェント
- インテグレーション
- コンテナ
- ダッシュボード
- アラート設定
- ログ管理
- トレーシング
- プロファイラー
- タグ
- API
- Service Catalog
- Session Replay
- Continuous Testing
- Synthetic モニタリング
- Incident Management
- Database Monitoring
- Cloud Security Management
- Cloud SIEM
- Application Security Management
- Workflow Automation
- CI Visibility
- Test Visibility
- Intelligent Test Runner
- Code Analysis
- Learning Center
- Support
- 用語集
- Standard Attributes
- ガイド
- インテグレーション
- エージェント
- OpenTelemetry
- 開発者
- 認可
- DogStatsD
- カスタムチェック
- インテグレーション
- Create an Agent-based Integration
- Create an API Integration
- Create a Log Pipeline
- Integration Assets Reference
- Build a Marketplace Offering
- Create a Tile
- Create an Integration Dashboard
- Create a Recommended Monitor
- Create a Cloud SIEM Detection Rule
- OAuth for Integrations
- Install Agent Integration Developer Tool
- サービスのチェック
- IDE インテグレーション
- コミュニティ
- ガイド
- API
- モバイルアプリケーション
- CoScreen
- Cloudcraft
- アプリ内
- Service Management
- インフラストラクチャー
- アプリケーションパフォーマンス
- APM
- Continuous Profiler
- データベース モニタリング
- Data Streams Monitoring
- Data Jobs Monitoring
- Digital Experience
- Software Delivery
- CI Visibility (CI/CDの可視化)
- CD Visibility
- Test Visibility
- Intelligent Test Runner
- Code Analysis
- Quality Gates
- DORA Metrics
- セキュリティ
- セキュリティの概要
- Cloud SIEM
- クラウド セキュリティ マネジメント
- Application Security Management
- AI Observability
- ログ管理
- Observability Pipelines(観測データの制御)
- ログ管理
- 管理
ダッシュボードで SLO 履歴データをグラフ化する
The SLO data source is in public beta. This feature is supported for Metric-based and Time Slice SLOs.
概要
Graph Metric-based and Time Slice SLOs on dashboards and track trends over 15 months. You can also leverage the scheduled dashboard reporting functionality to automatically deliver visual reports to key stakeholders.
構成
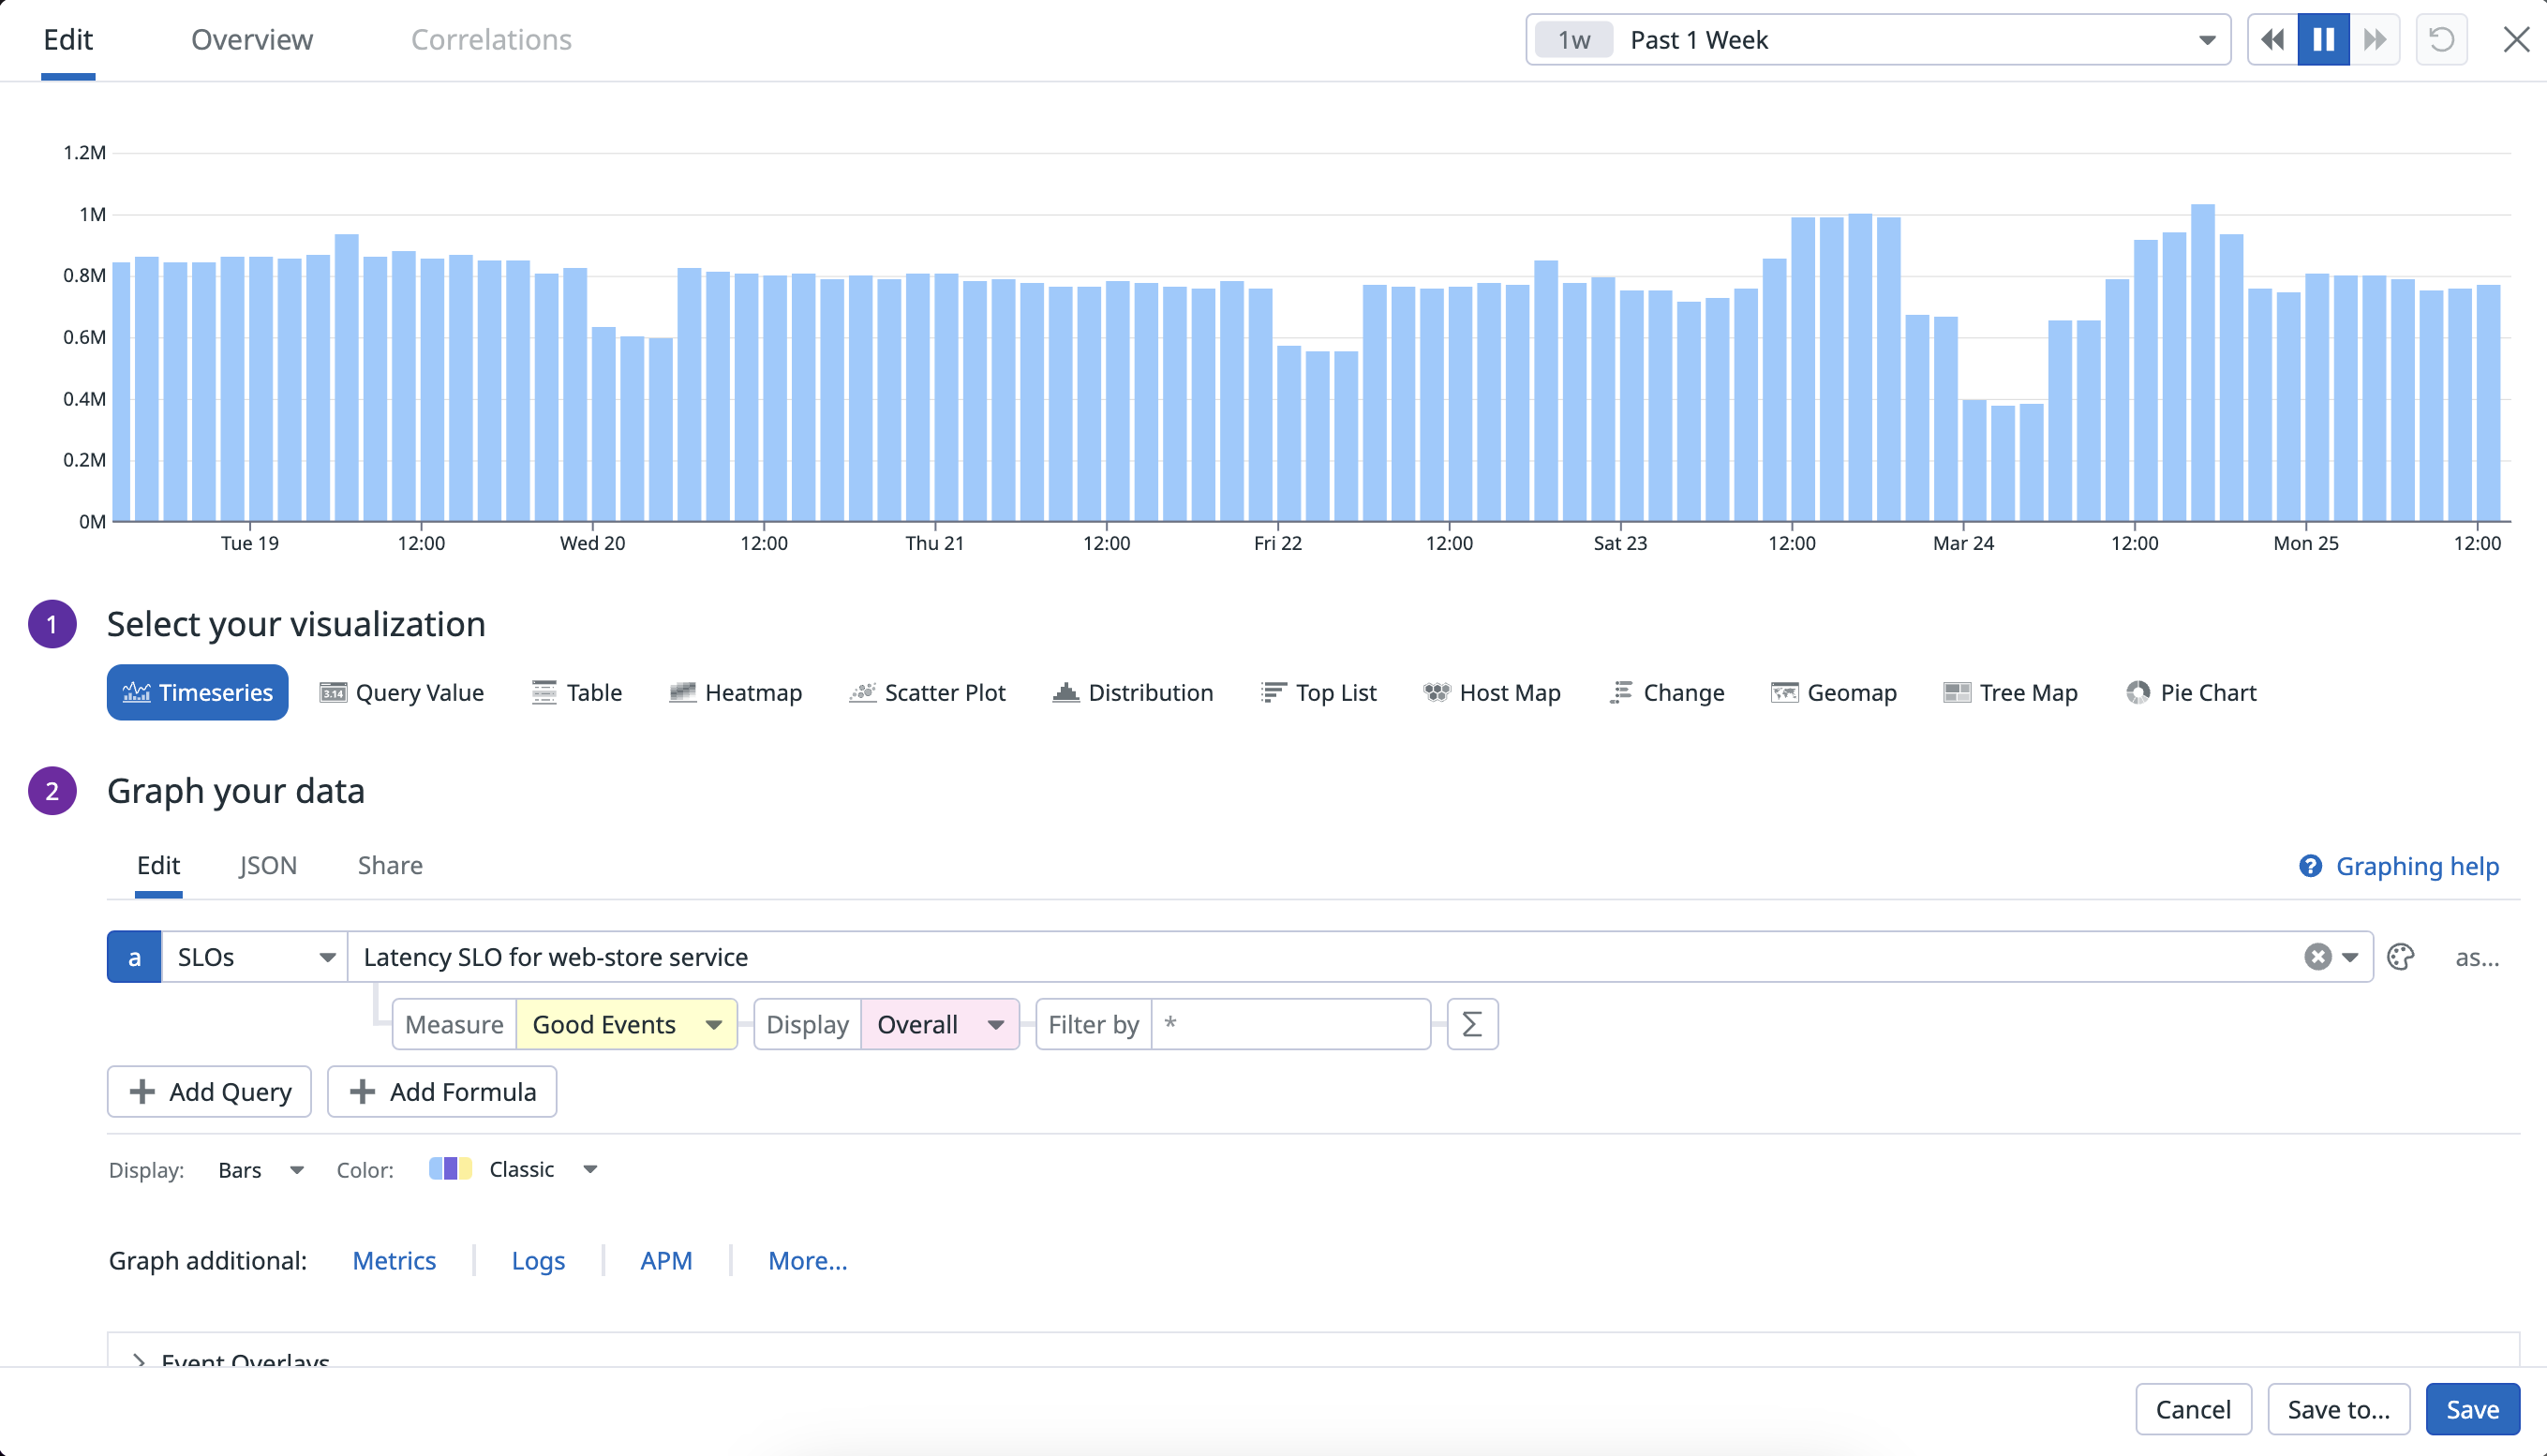
まずは、ダッシュボードのウィジェットトレイから標準的な視覚化タイプの 1 つを選択し、クエリのドロップダウンメニューで SLOs をデータソースとして選択します。
For the Measure parameter, see the table below for more information on what each measure visualizes. The Display parameter allows you to break out the query by the groups that are already configured for the SLO.
Key Information
When using an SLO data source measures in the Timeseries widget, the value shown at each point is based on the default rollup in the widget, not rolling time period of the SLO. Additionally, SLO status corrections are applied to scalar widgets only, not the timeseries widget.
| メジャー | SLO type | 時系列ウィジェット | スカラーウィジェット |
|---|---|---|---|
| 良好イベント | Metric-based | The count of good events. | The sum of good events across all groups. |
| 不良イベント | Metric-based | The count of bad events. | The sum of bad events across all groups. |
| Good minutes | Time Slice | The count of good minutes. | The sum of good minutes across all groups. |
| Bad minutes | Time Slice | The count of bad minutes. | The sum of bad minutes across all groups. |
| SLO ステータス | Metric-based or Time Slice | For each time bucket, the SLO status is calculated as the ratio of the number of good events/minutes to total events/minutes. | The ratio of the number of good events/minutes to total events/minutes. |
| エラーバジェットの残り | Metric-based or Time Slice | For each time bucket, the percentage of error budget remaining. The target for the primary time window is used in the error budget calculation. | The percentage of error budget remaining at the end of the widget’s time frame. |
| バーンレート | Metric-based or Time Slice | For each time bucket, the burn rate shows the observed error rate divided by the ideal error rate. | The burn rate over the widget’s time frame. |
| エラーバジェットバーンダウン | Metric-based or Time Slice | The error budget burned over time. It starts at 100% (unless there were bad events/minutes within the first time bucket) and decreases with bad events/minutes. | Error budget burndown is not available in scalar widgets. |

