- 重要な情報
- はじめに
- Datadog
- Datadog サイト
- DevSecOps
- AWS Lambda のサーバーレス
- エージェント
- インテグレーション
- コンテナ
- ダッシュボード
- アラート設定
- ログ管理
- トレーシング
- プロファイラー
- タグ
- API
- Service Catalog
- Session Replay
- Continuous Testing
- Synthetic モニタリング
- Incident Management
- Database Monitoring
- Cloud Security Management
- Cloud SIEM
- Application Security Management
- Workflow Automation
- CI Visibility
- Test Visibility
- Intelligent Test Runner
- Code Analysis
- Learning Center
- Support
- 用語集
- Standard Attributes
- ガイド
- インテグレーション
- エージェント
- OpenTelemetry
- 開発者
- 認可
- DogStatsD
- カスタムチェック
- インテグレーション
- Create an Agent-based Integration
- Create an API Integration
- Create a Log Pipeline
- Integration Assets Reference
- Build a Marketplace Offering
- Create a Tile
- Create an Integration Dashboard
- Create a Recommended Monitor
- Create a Cloud SIEM Detection Rule
- OAuth for Integrations
- Install Agent Integration Developer Tool
- サービスのチェック
- IDE インテグレーション
- コミュニティ
- ガイド
- API
- モバイルアプリケーション
- CoScreen
- Cloudcraft
- アプリ内
- Service Management
- インフラストラクチャー
- アプリケーションパフォーマンス
- APM
- Continuous Profiler
- データベース モニタリング
- Data Streams Monitoring
- Data Jobs Monitoring
- Digital Experience
- Software Delivery
- CI Visibility (CI/CDの可視化)
- CD Visibility
- Test Visibility
- Intelligent Test Runner
- Code Analysis
- Quality Gates
- DORA Metrics
- セキュリティ
- セキュリティの概要
- Cloud SIEM
- クラウド セキュリティ マネジメント
- Application Security Management
- AI Observability
- ログ管理
- Observability Pipelines(観測データの制御)
- ログ管理
- 管理
コンバージョン率でアラートを出す
概要
コンバージョン率は、ユーザーワークフローの成功を監視する上で非常に重要です。このガイドでは、RUM ファネルの視覚化でコンバージョン率を生成し、コンバージョン率が所定のしきい値を下回ると通知するアラートを作成する方法を説明します。
RUM エクスプローラーでファネルを作成する
In Datadog, navigate to Digital Experience > Product Analytics > Funnels.
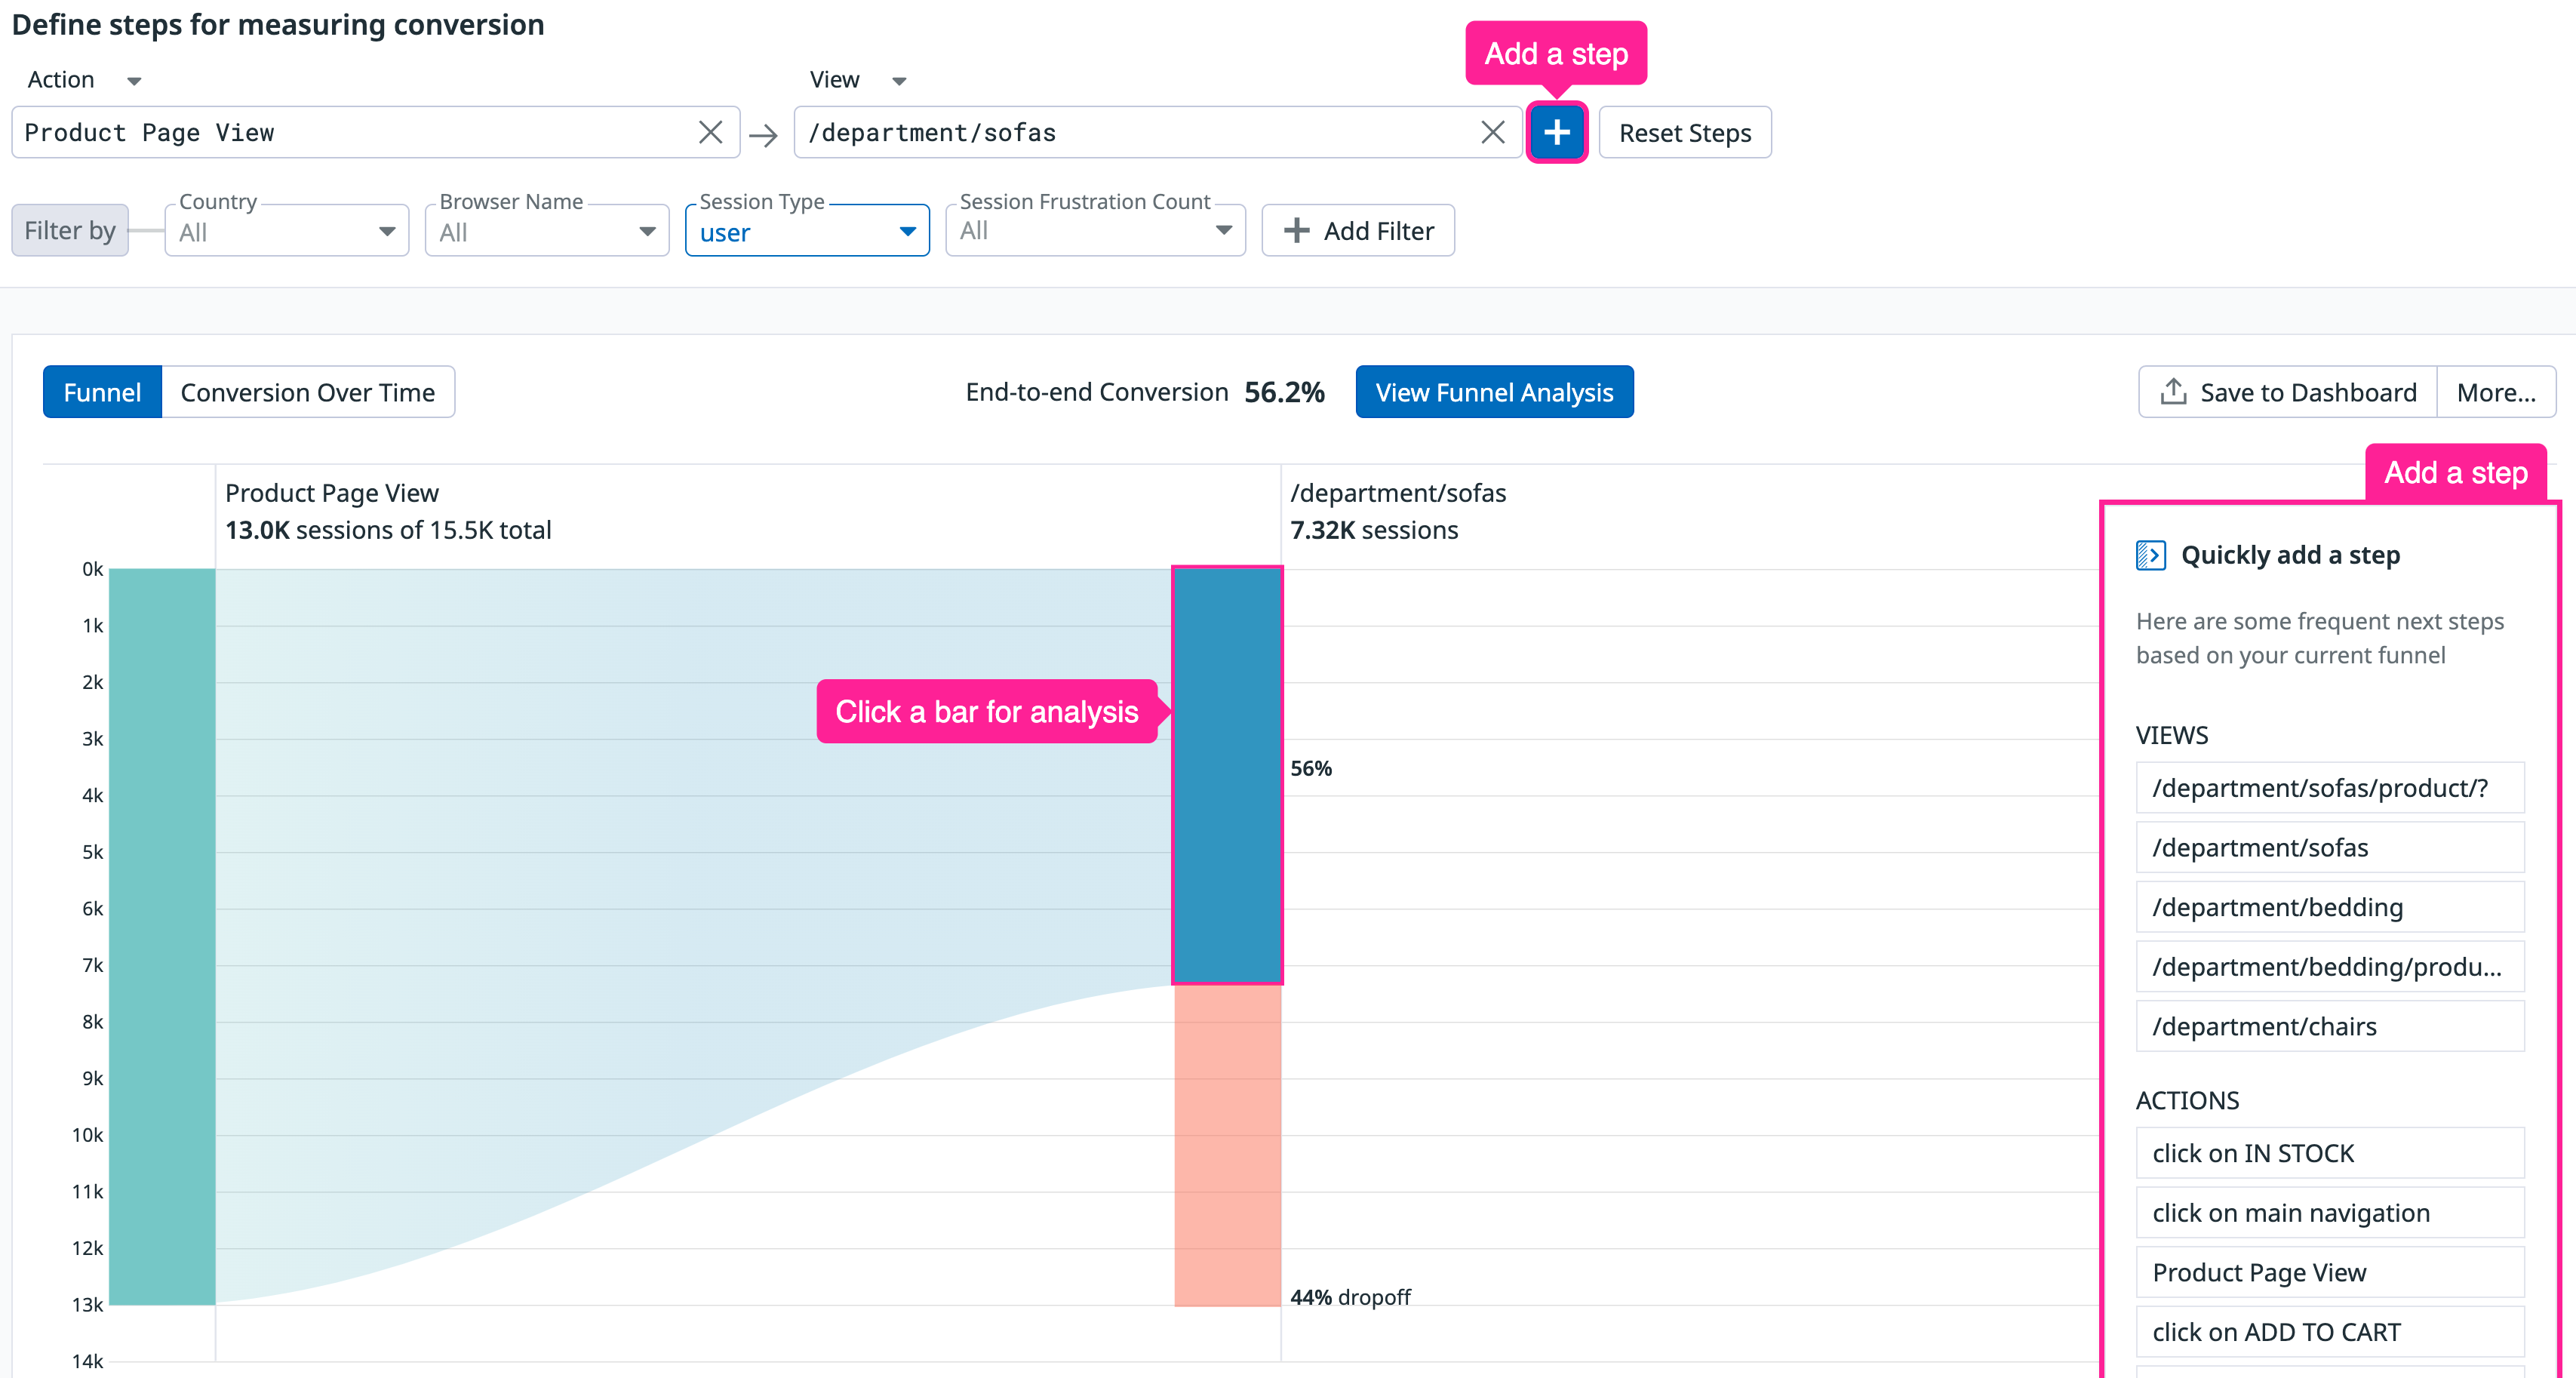
In the Define steps for measuring conversion section, create some steps from your views and actions. You can click on the bar graphs to see a side panel with analytics about user conversions and dropoffs. To add a subsequent view or action in the funnel, click + and select from frequent next steps.
Export the conversion rate graph
ファネルには、全体のコンバージョン率とドロップオフ率、コンバージョンまたはドロップオフセッションの数、コンバージョンまたはドロップオフセッションのパーセンテージが表示されます。
Click the Save to Dashboard button and select an existing dashboard from the dropdown menu to export the graph to. Optionally, click New Dashboard to create a dashboard.
Edit the conversion rate query
ダッシュボードでは、ウィジェットを編集し、Graph your data の下でコンバージョン率のクエリにアクセスすることができます。
RUM モニターの更新
別のタブで、Monitors > New Monitor に移動し、Real User Monitoring を選択します。
ダッシュボードからクエリをコピーして RUM モニターのクエリエディタに貼り付け、(a / b) * 100 を使用して数式を追加します。
高度なモニター構成
適用されたクエリを使用して、アラート条件をカスタマイズし、アラートが適切な担当者やチャンネルに通知されるように通知を設定することができます。詳しくは、リアルユーザーモニタリングモニターを参照してください。
その他の参考資料
お役に立つドキュメント、リンクや記事:


