- Essentials
- Getting Started
- Datadog
- Datadog Site
- DevSecOps
- Serverless for AWS Lambda
- Agent
- Integrations
- Containers
- Dashboards
- Monitors
- Logs
- APM Tracing
- Profiler
- Tags
- API
- Service Catalog
- Session Replay
- Continuous Testing
- Synthetic Monitoring
- Incident Management
- Database Monitoring
- Cloud Security Management
- Cloud SIEM
- Application Security Management
- Workflow Automation
- CI Visibility
- Test Visibility
- Intelligent Test Runner
- Code Analysis
- Learning Center
- Support
- Glossary
- Standard Attributes
- Guides
- Agent
- Integrations
- OpenTelemetry
- Developers
- Authorization
- DogStatsD
- Custom Checks
- Integrations
- Create an Agent-based Integration
- Create an API Integration
- Create a Log Pipeline
- Integration Assets Reference
- Build a Marketplace Offering
- Create a Tile
- Create an Integration Dashboard
- Create a Recommended Monitor
- Create a Cloud SIEM Detection Rule
- OAuth for Integrations
- Install Agent Integration Developer Tool
- Service Checks
- IDE Plugins
- Community
- Guides
- API
- Datadog Mobile App
- CoScreen
- Cloudcraft
- In The App
- Dashboards
- Notebooks
- DDSQL Editor
- Sheets
- Monitors and Alerting
- Infrastructure
- Metrics
- Watchdog
- Bits AI
- Service Catalog
- API Catalog
- Error Tracking
- Service Management
- Infrastructure
- Application Performance
- APM
- Continuous Profiler
- Database Monitoring
- Data Streams Monitoring
- Data Jobs Monitoring
- Digital Experience
- Real User Monitoring
- Product Analytics
- Synthetic Testing and Monitoring
- Continuous Testing
- Software Delivery
- CI Visibility
- CD Visibility
- Test Visibility
- Intelligent Test Runner
- Code Analysis
- Quality Gates
- DORA Metrics
- Security
- Security Overview
- Cloud SIEM
- Cloud Security Management
- Application Security Management
- AI Observability
- Log Management
- Observability Pipelines
- Log Management
- Administration
Ease Troubleshooting With Cross-Product Correlation
Overview
Unified service tagging enables high-level correlation capabilities. There may be times when the starting point of your investigation is a single log, trace, view, or Synthetic test. Correlating logs, traces, and views with other data provides helpful context in estimating business impact and identifying the root cause of an issue in quickly.
This guide walks you through how to correlate your full stack data. Depending on your use case, you may skip certain steps below. Steps that are dependent on others are explicitly stated.
- Correlate server-side logs with traces
- Correlate frontend products
- Correlate user experience with server behavior
Correlate server-side logs with traces
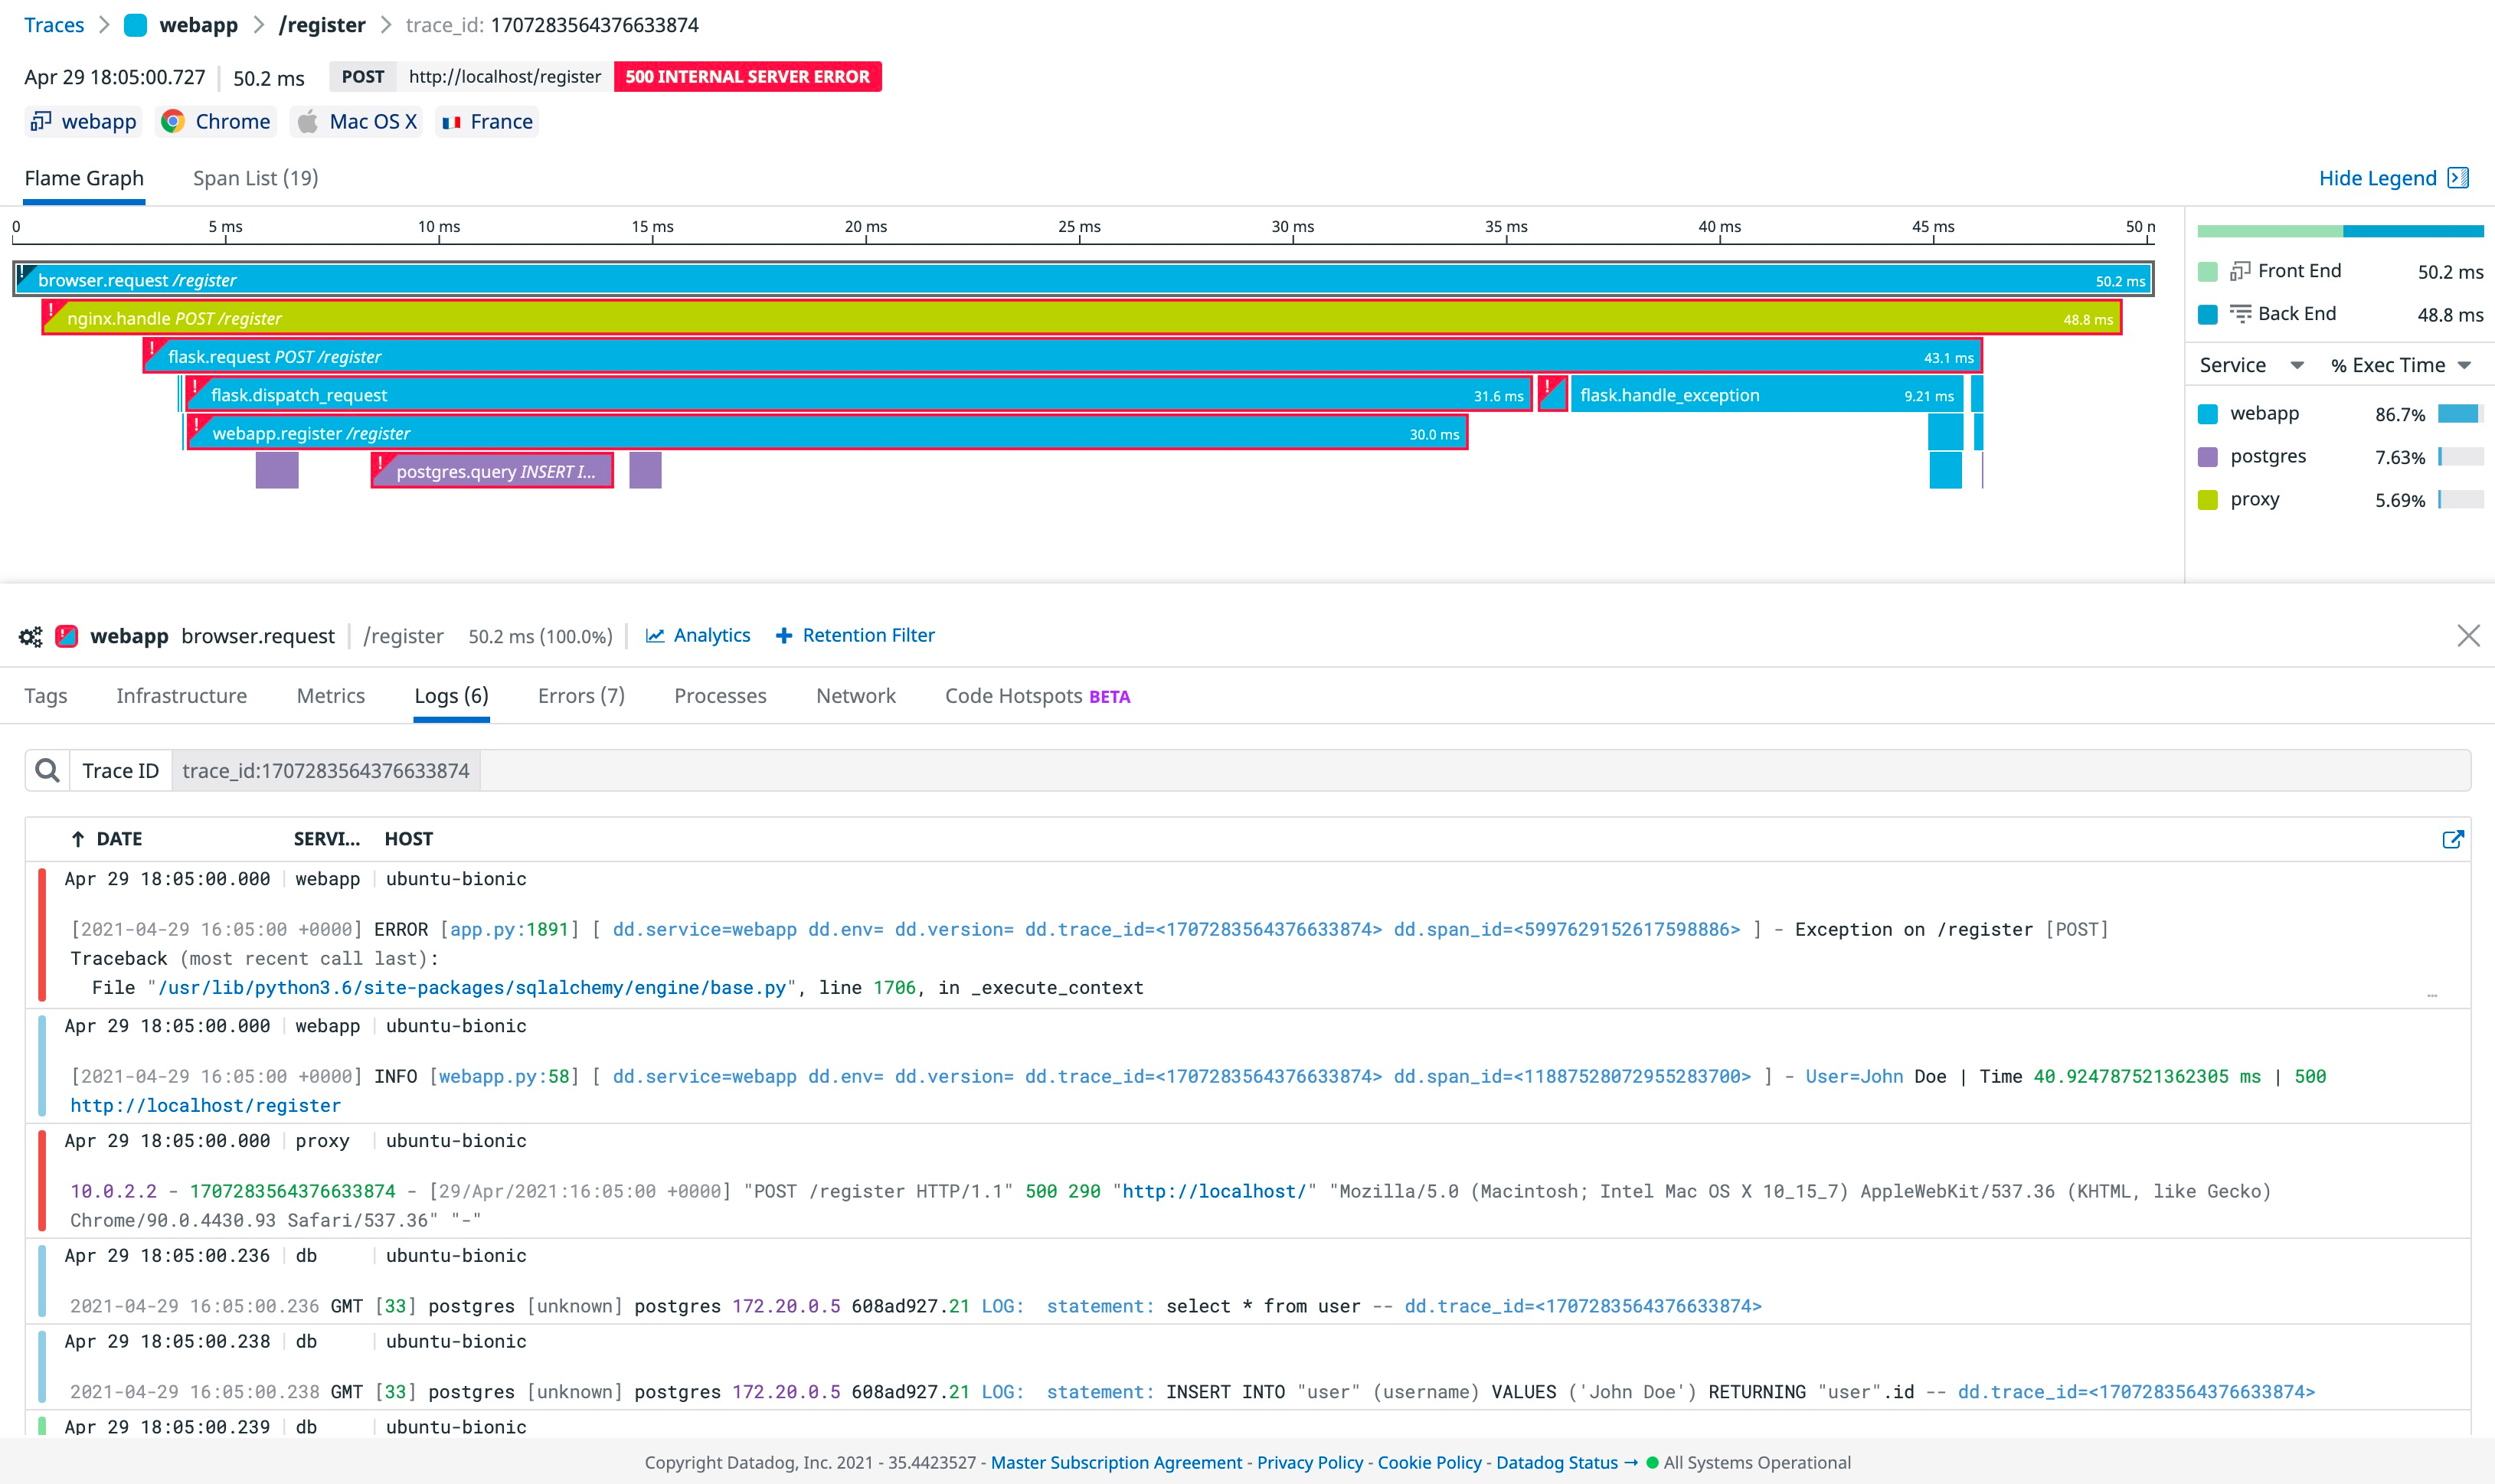
When your users are encountering errors or high latency in your application, viewing the specific logs from a problematic request can reveal exactly what went wrong. By pulling together all the logs pertaining to a given request, you can see in rich detail how it was handled from beginning to end so you can quickly diagnose the issue.
Correlating your logs with traces also eases aggressive sampling strategy without losing entity-level consistency with the use of trace_id.
Correlating application logs offers extensive visibility across your stack, but some specific use cases require correlation deeper into your stack. Follow the links to complete setup per use case:
Correlate application logs
Why?
Application logs give the most context around most code and business logic issues. They can even help you solve other services issues. For example, most ORMs log database errors.
How?
Use one of the various OOTB correlations. If you use a custom tracer or if you have any issues, follow the correlation FAQ.
Correlate proxy logs
Why?
Proxy logs provide more information than application logs as they cover more entry points and give information on static content and redirections.
How?
The application tracer generates trace IDs by default. This can be changed by injecting x-datadog-trace-id into HTTP Request headers.
NGINX
Setup opentracing
Follow NGINX tracing integration.
Inject trace ID in logs
Trace ID is stored as opentelemetry_trace_id variable. Update the NGINX log format by adding the following configuration block in the HTTP section of your NGINX configuration file /etc/nginx/nginx.conf:
http {
  log_format main '$remote_addr - $opentelemetry_trace_id $http_x_forwarded_user [$time_local] "$request" '
          '$status $body_bytes_sent "$http_referer" '
          '"$http_user_agent" "$http_x_forwarded_for" ';

  access_log /var/log/nginx/access.log;
}
Parse trace ID in pipelines
Clone the NGINX pipeline.
Customize the first grok parser:
- In Parsing rules, replace the first parsing rule with:
access.common %{_client_ip} %{_ident} %{_trace_id} %{_auth} \[%{_date_access}\] "(?>%{_method} |)%{_url}(?> %{_version}|)" %{_status_code} (?>%{_bytes_written}|-)- In Advanced settings under Helper Rules, add the line:
_trace_id %{notSpace:dd.trace_id:nullIf("-")}Add a trace ID remapper on
dd.trace_idattribute.
Correlate database logs
Why?
Database logs are often hard to contextualize due to query similarities, variable anonymization, and high usage.
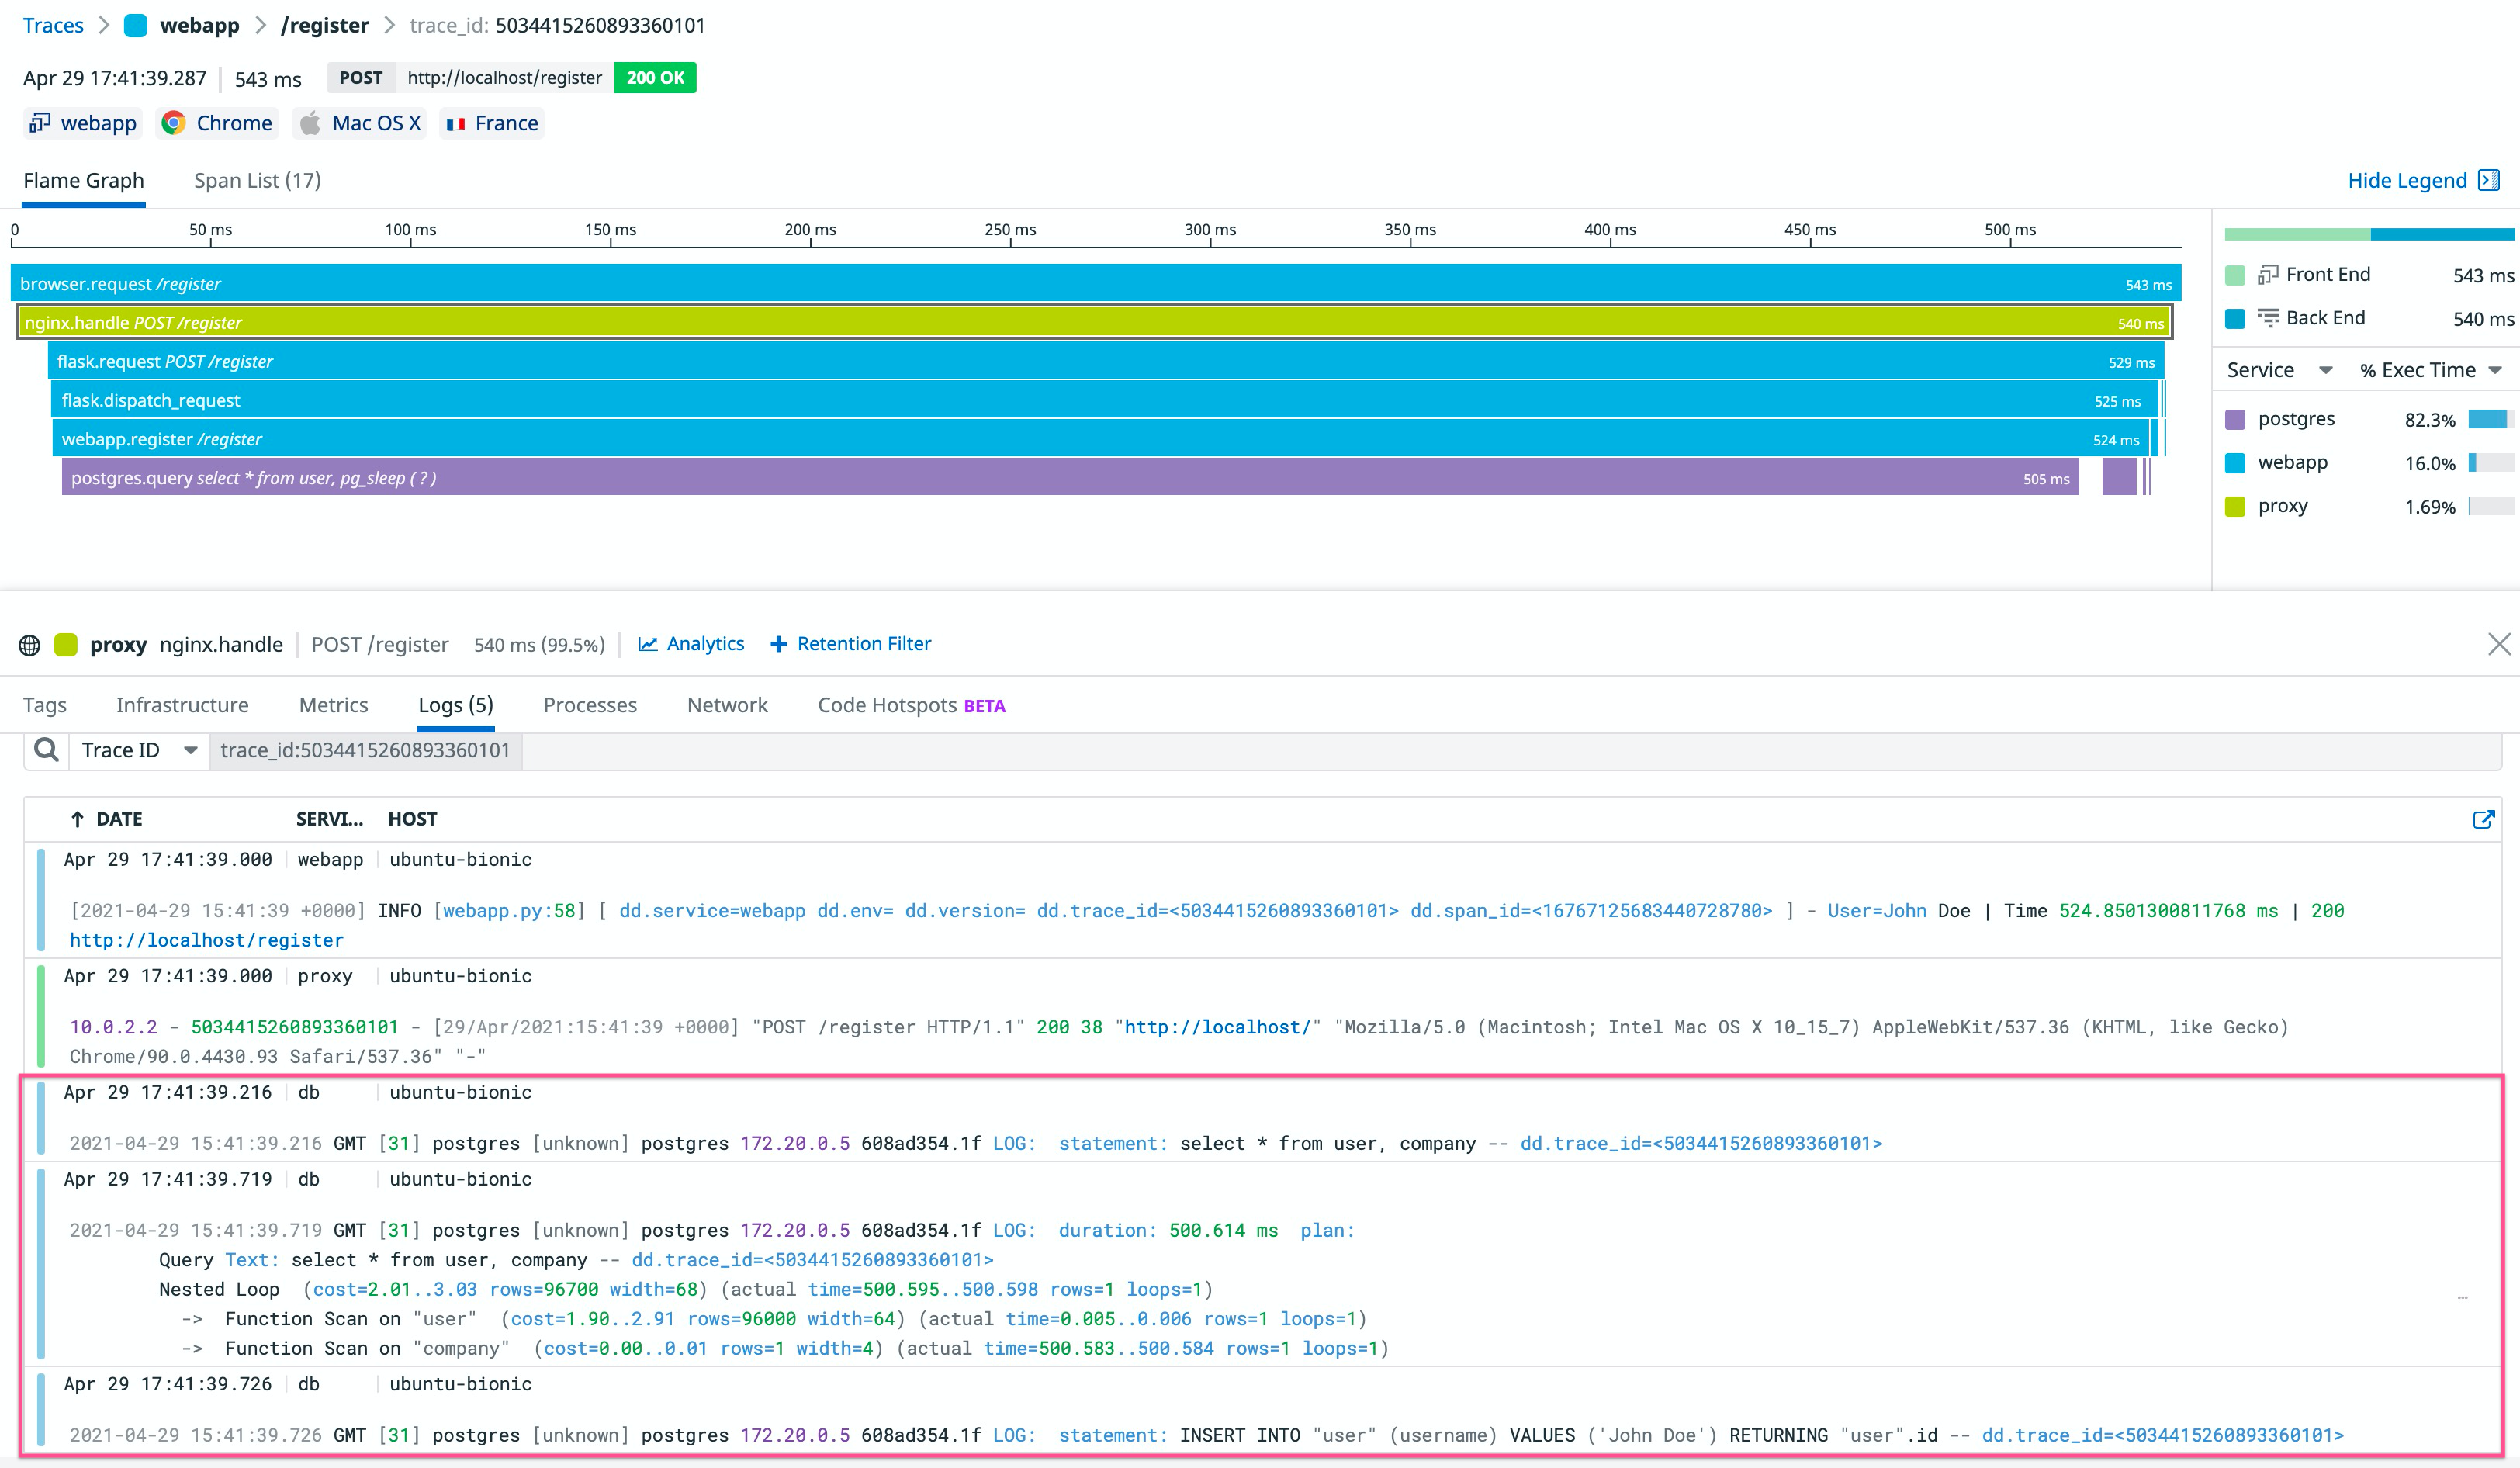
For example, production slow queries are hard to reproduce and analyze without investing a lot of time and resources. Below is an example of how to correlate slow query analysis with traces.
How?
PostgreSQL
Enrich your database logs
PostgreSQL default logs are not detailed. Follow this integration guide to enrich them.
Slow query best practices also suggests logging execution plans of slow statements automatically, so you don’t have to run EXPLAIN by hand. To run EXPLAIN automatically, update /etc/postgresql/<VERSION>/main/postgresql.conf with:
session_preload_libraries = 'auto_explain'
auto_explain.log_min_duration = '500ms'
Queries longer than 500ms log their execution plan.
Note: auto_explain.log_analyze = 'true' provides even more information, but greatly impacts performance. For more information, see the official documentation.
Inject trace_id into your database logs
Inject trace_id into most of your database logs with SQL comments. Here is an example with Flask and SQLAlchemy:
if os.environ.get('DD_LOGS_INJECTION') == 'true':
    from ddtrace import tracer
    from sqlalchemy.engine import Engine
    from sqlalchemy import event

    @event.listens_for(Engine, "before_cursor_execute", retval=True)
    def comment_sql_calls(conn, cursor, statement, parameters, context, executemany):
        trace_ctx = tracer.get_log_correlation_context()
        statement = f"{statement} -- dd.trace_id=<{trace_ctx['trace_id']}>"
        return statement, parameters
Note: This only correlates logs that include a query statement. Error logs like ERROR: duplicate key value violates unique constraint "<TABLE_KEY>" stay out of context. Most of the time you can still get error information through your application logs.
Clone and customize the PostgreSQL pipeline:
Add a new grok parser:
extract_trace %{data}\s+--\s+dd.trace_id=<%{notSpace:dd.trace_id}>\s+%{data}Add a trace ID remapper on
dd.trace_idattribute.
Here is an example of a slow query execution plan from a slow trace:
Correlate frontend products
Correlate browser logs with RUM & Session Replay
Why?
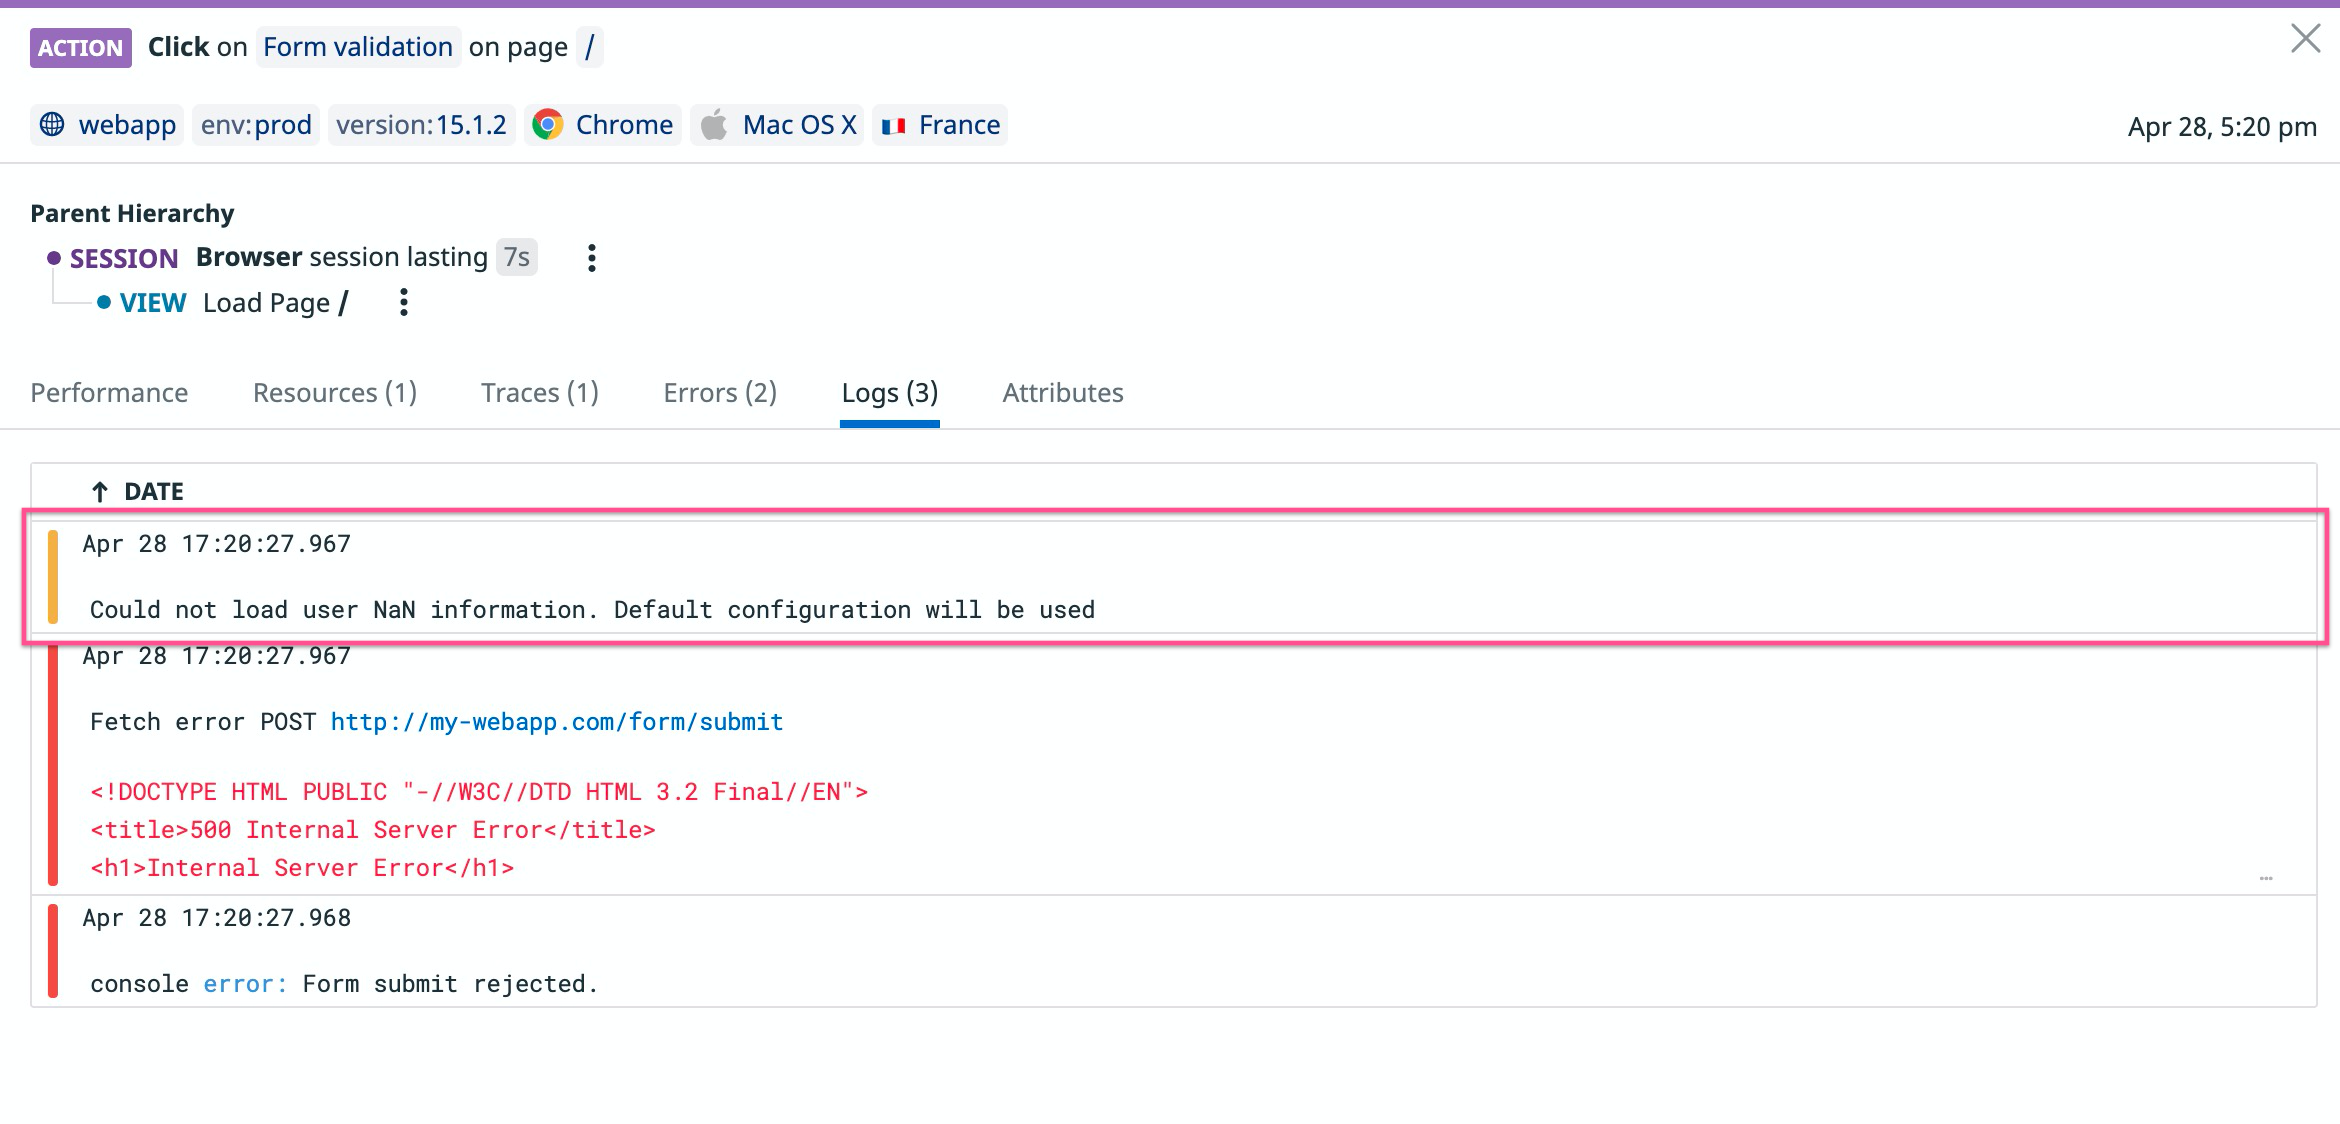
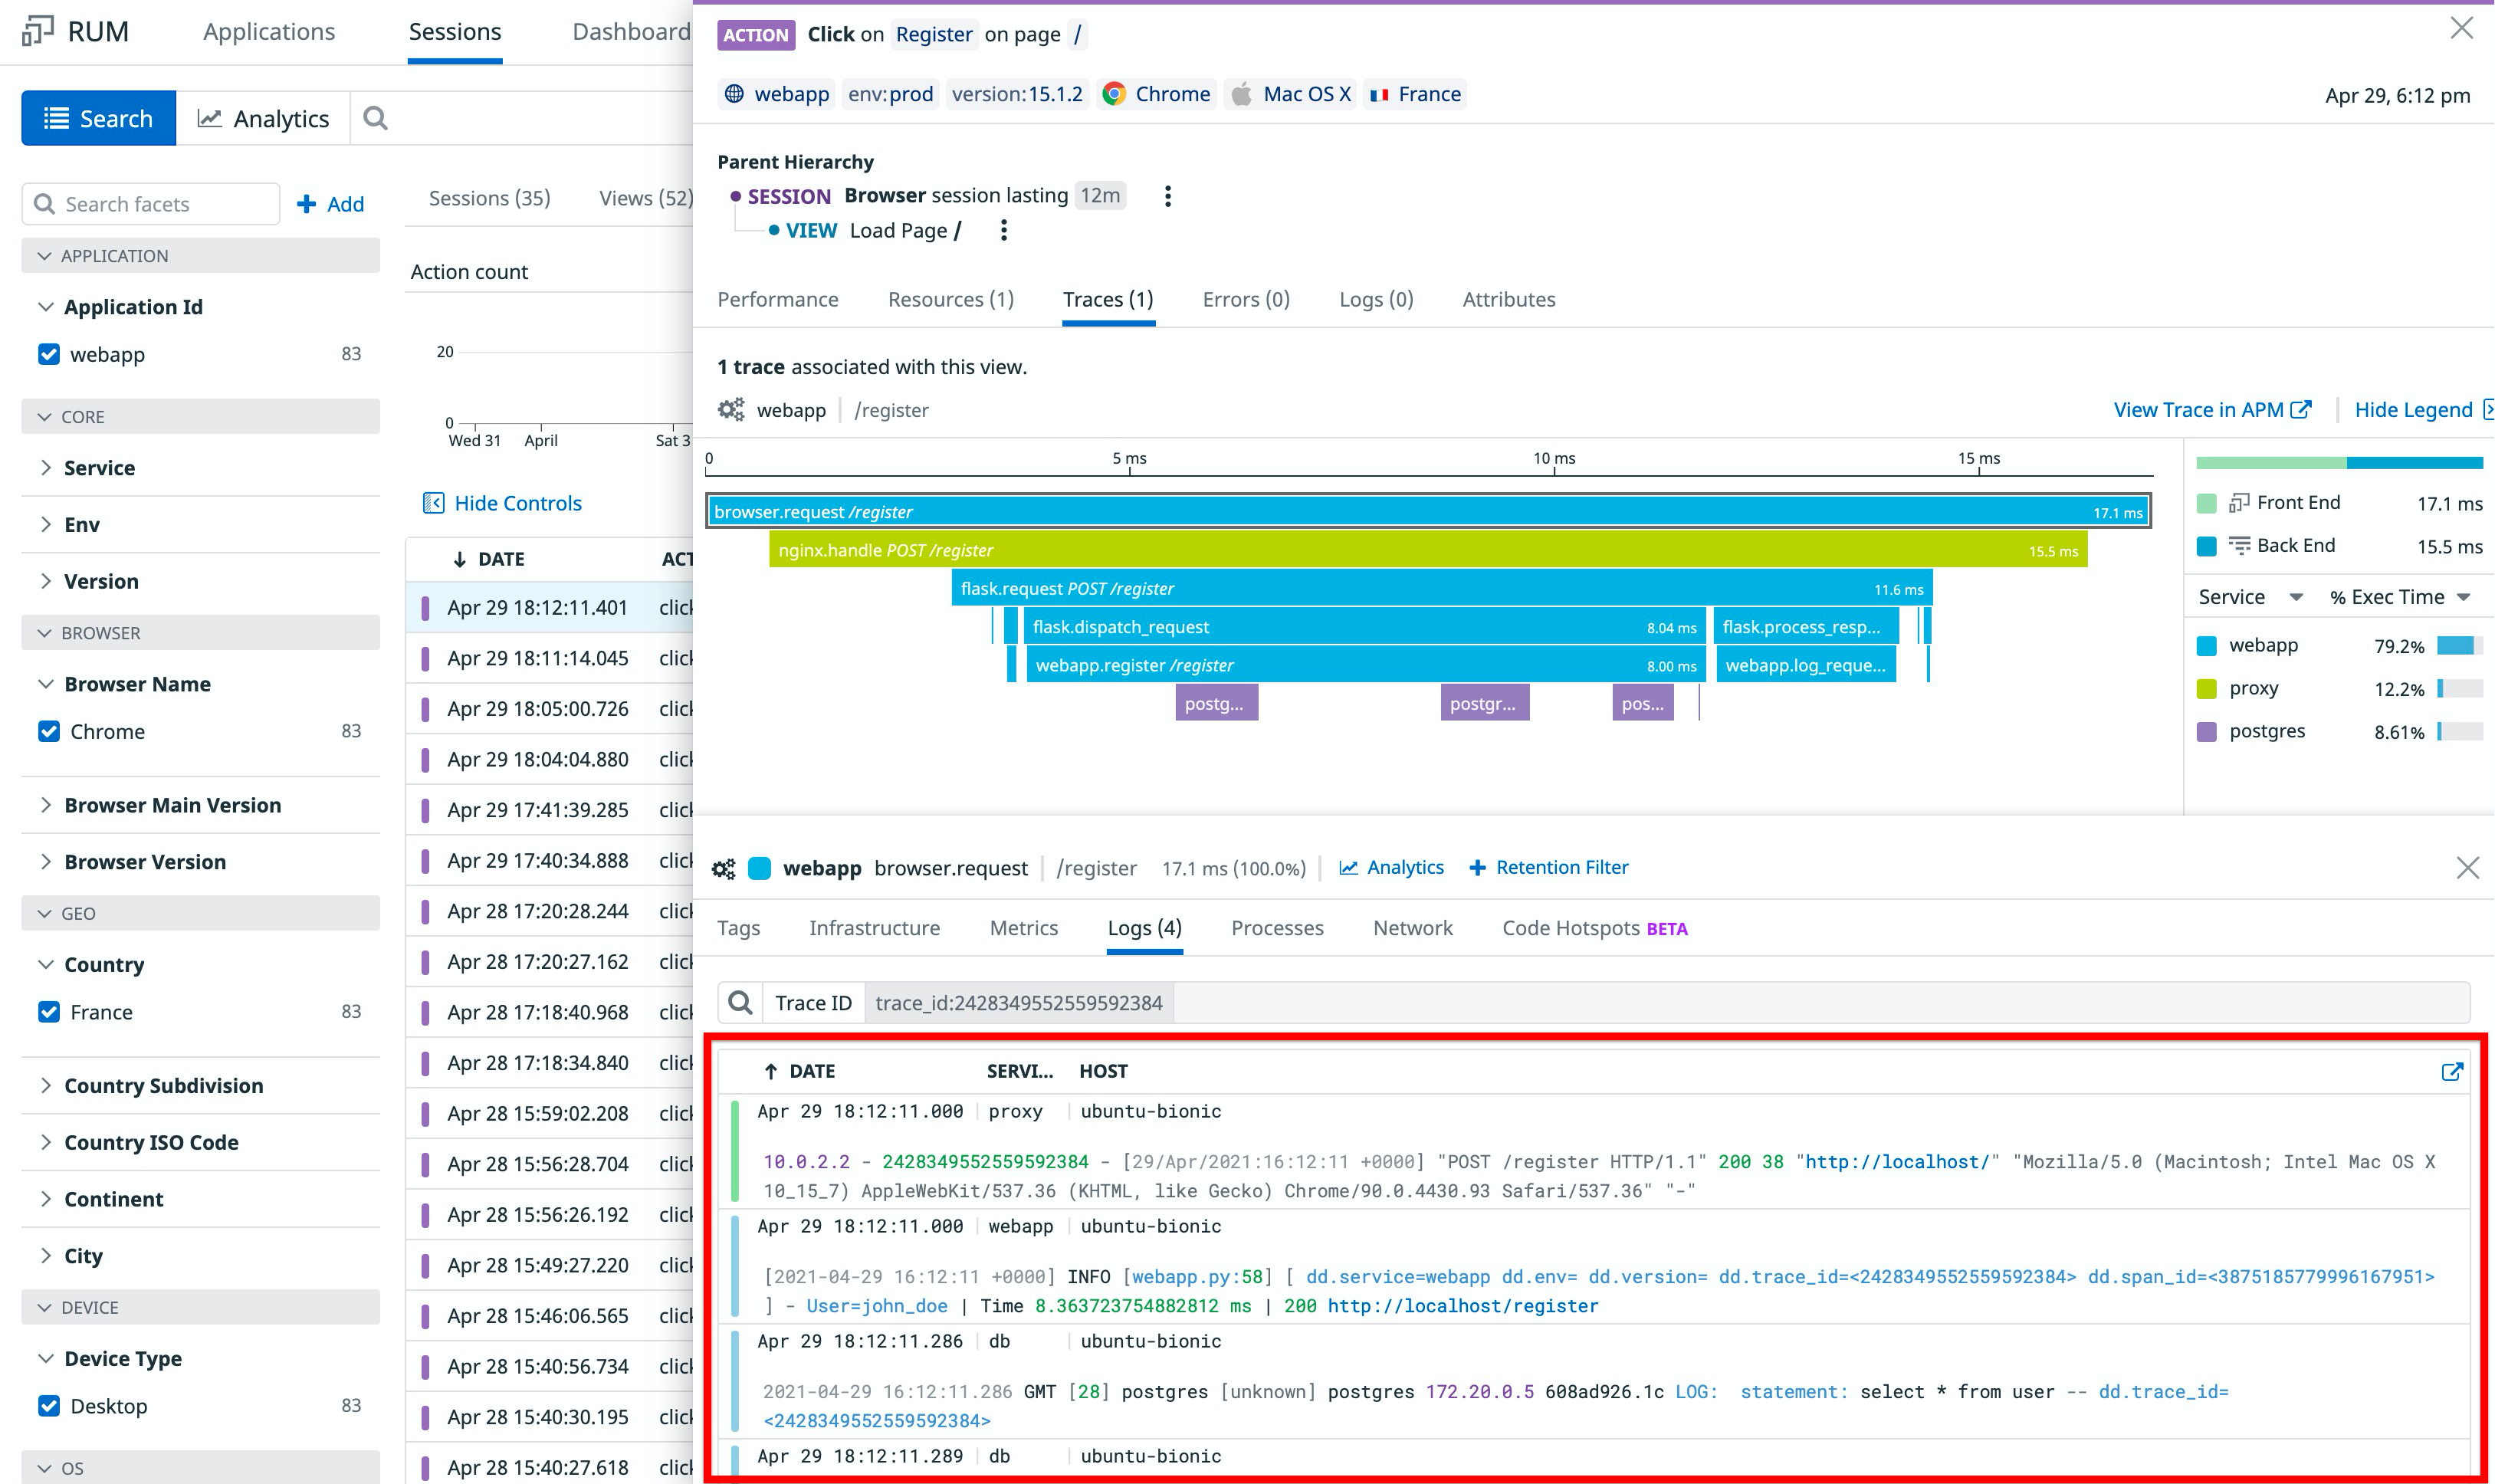
Browser logs inside a RUM event give context and insight into an issue. In the following example, browser logs indicate that the root cause of the bad query is an invalid user ID.
Correlating your browser logs with RUM also eases aggressive sampling strategy without losing entity-level consistency with the use of attributes like session_id and view.id.
How?
Browser logs and RUM events are automatically correlated. For more information, see RUM & Session Replay Billing. You must match configurations between the RUM Browser SDK and Logs SDK.
Correlate user experience with server behavior
Traditional backend and frontend monitoring are siloed and may require separate workflows to troubleshoot across a stack. Datadog’s full stack correlations allow you to identify a root cause—whether it comes from a browser issue or a database downtime—and estimate the user impact.
This section walks you through how to enable these correlations:
Correlate RUM views with traces
Why?
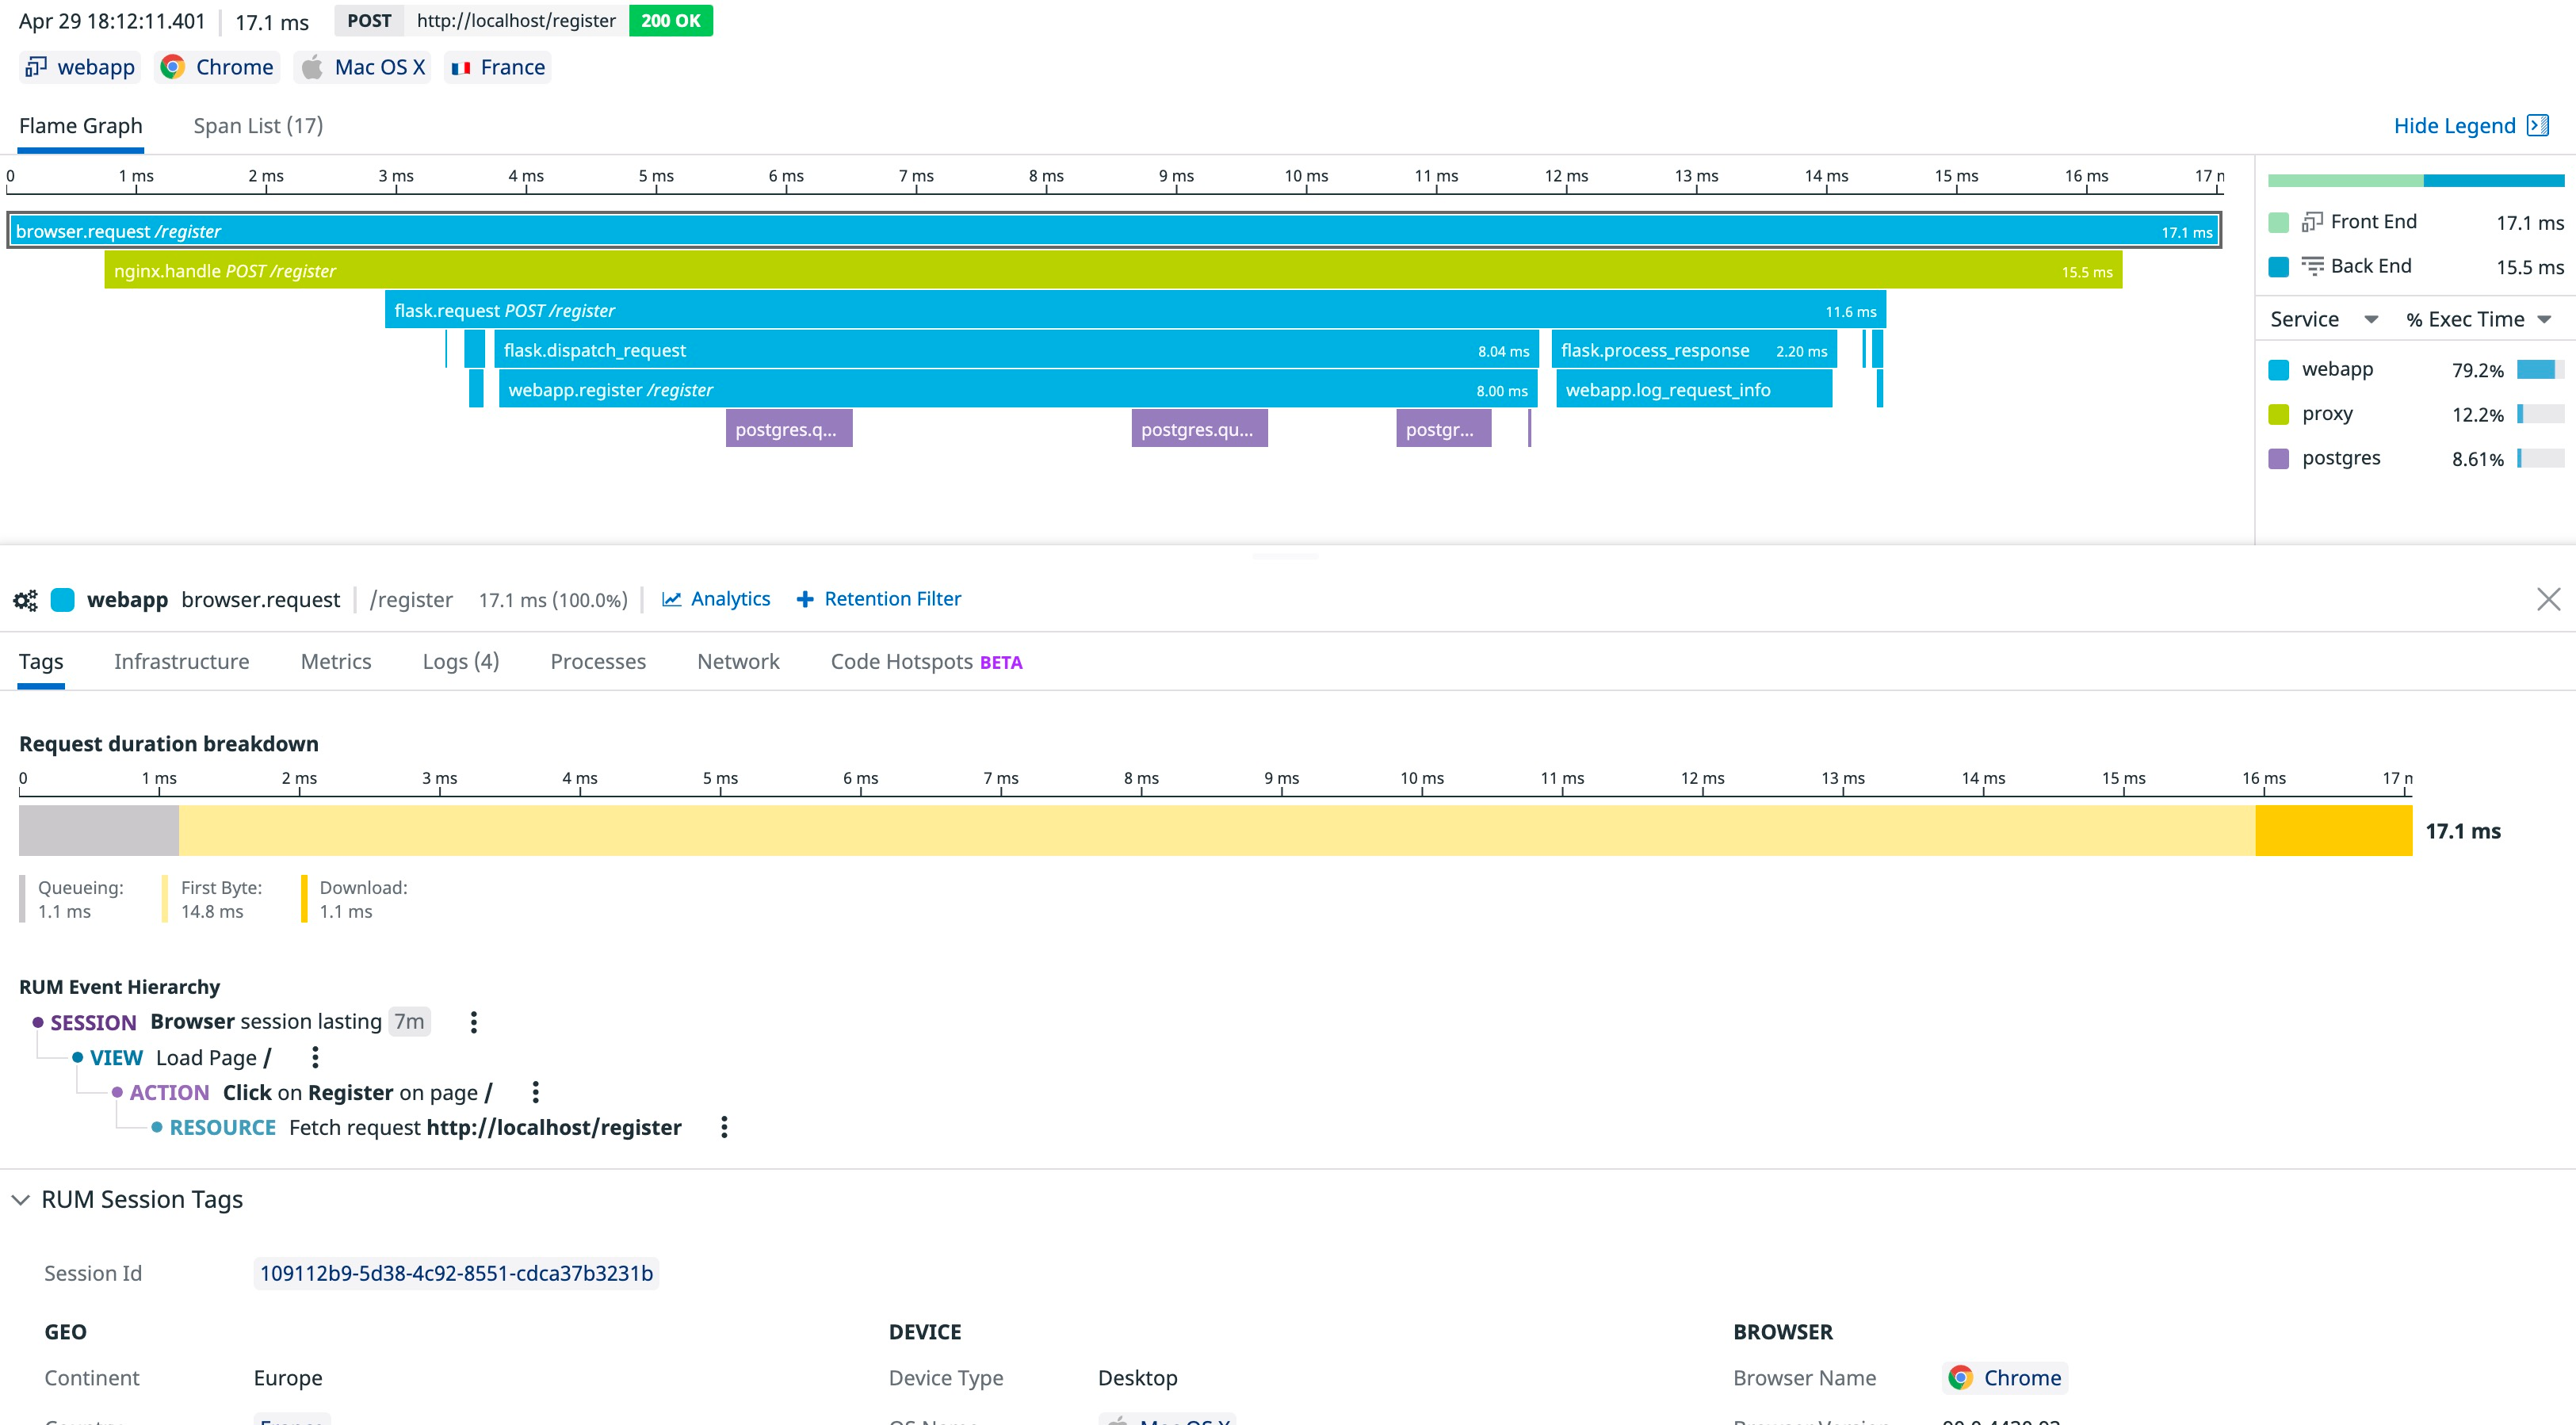
The APM integration with RUM & Session Replay allows you to see your frontend and backend data in one lens, in addition to:
- Quickly pinpoint issues anywhere in your stack, including the frontend
- Fully understand what your users are experiencing
How?
You can access RUM views in the Trace Explorer and APM traces in the RUM Explorer. For more information, see Connect RUM and Traces.
There is no direct correlation between RUM views and server logs. To see RUM events in a log and logs in a RUM event, click in the Traces tab.
Leverage trace correlation to troubleshoot Synthetic tests
Why?
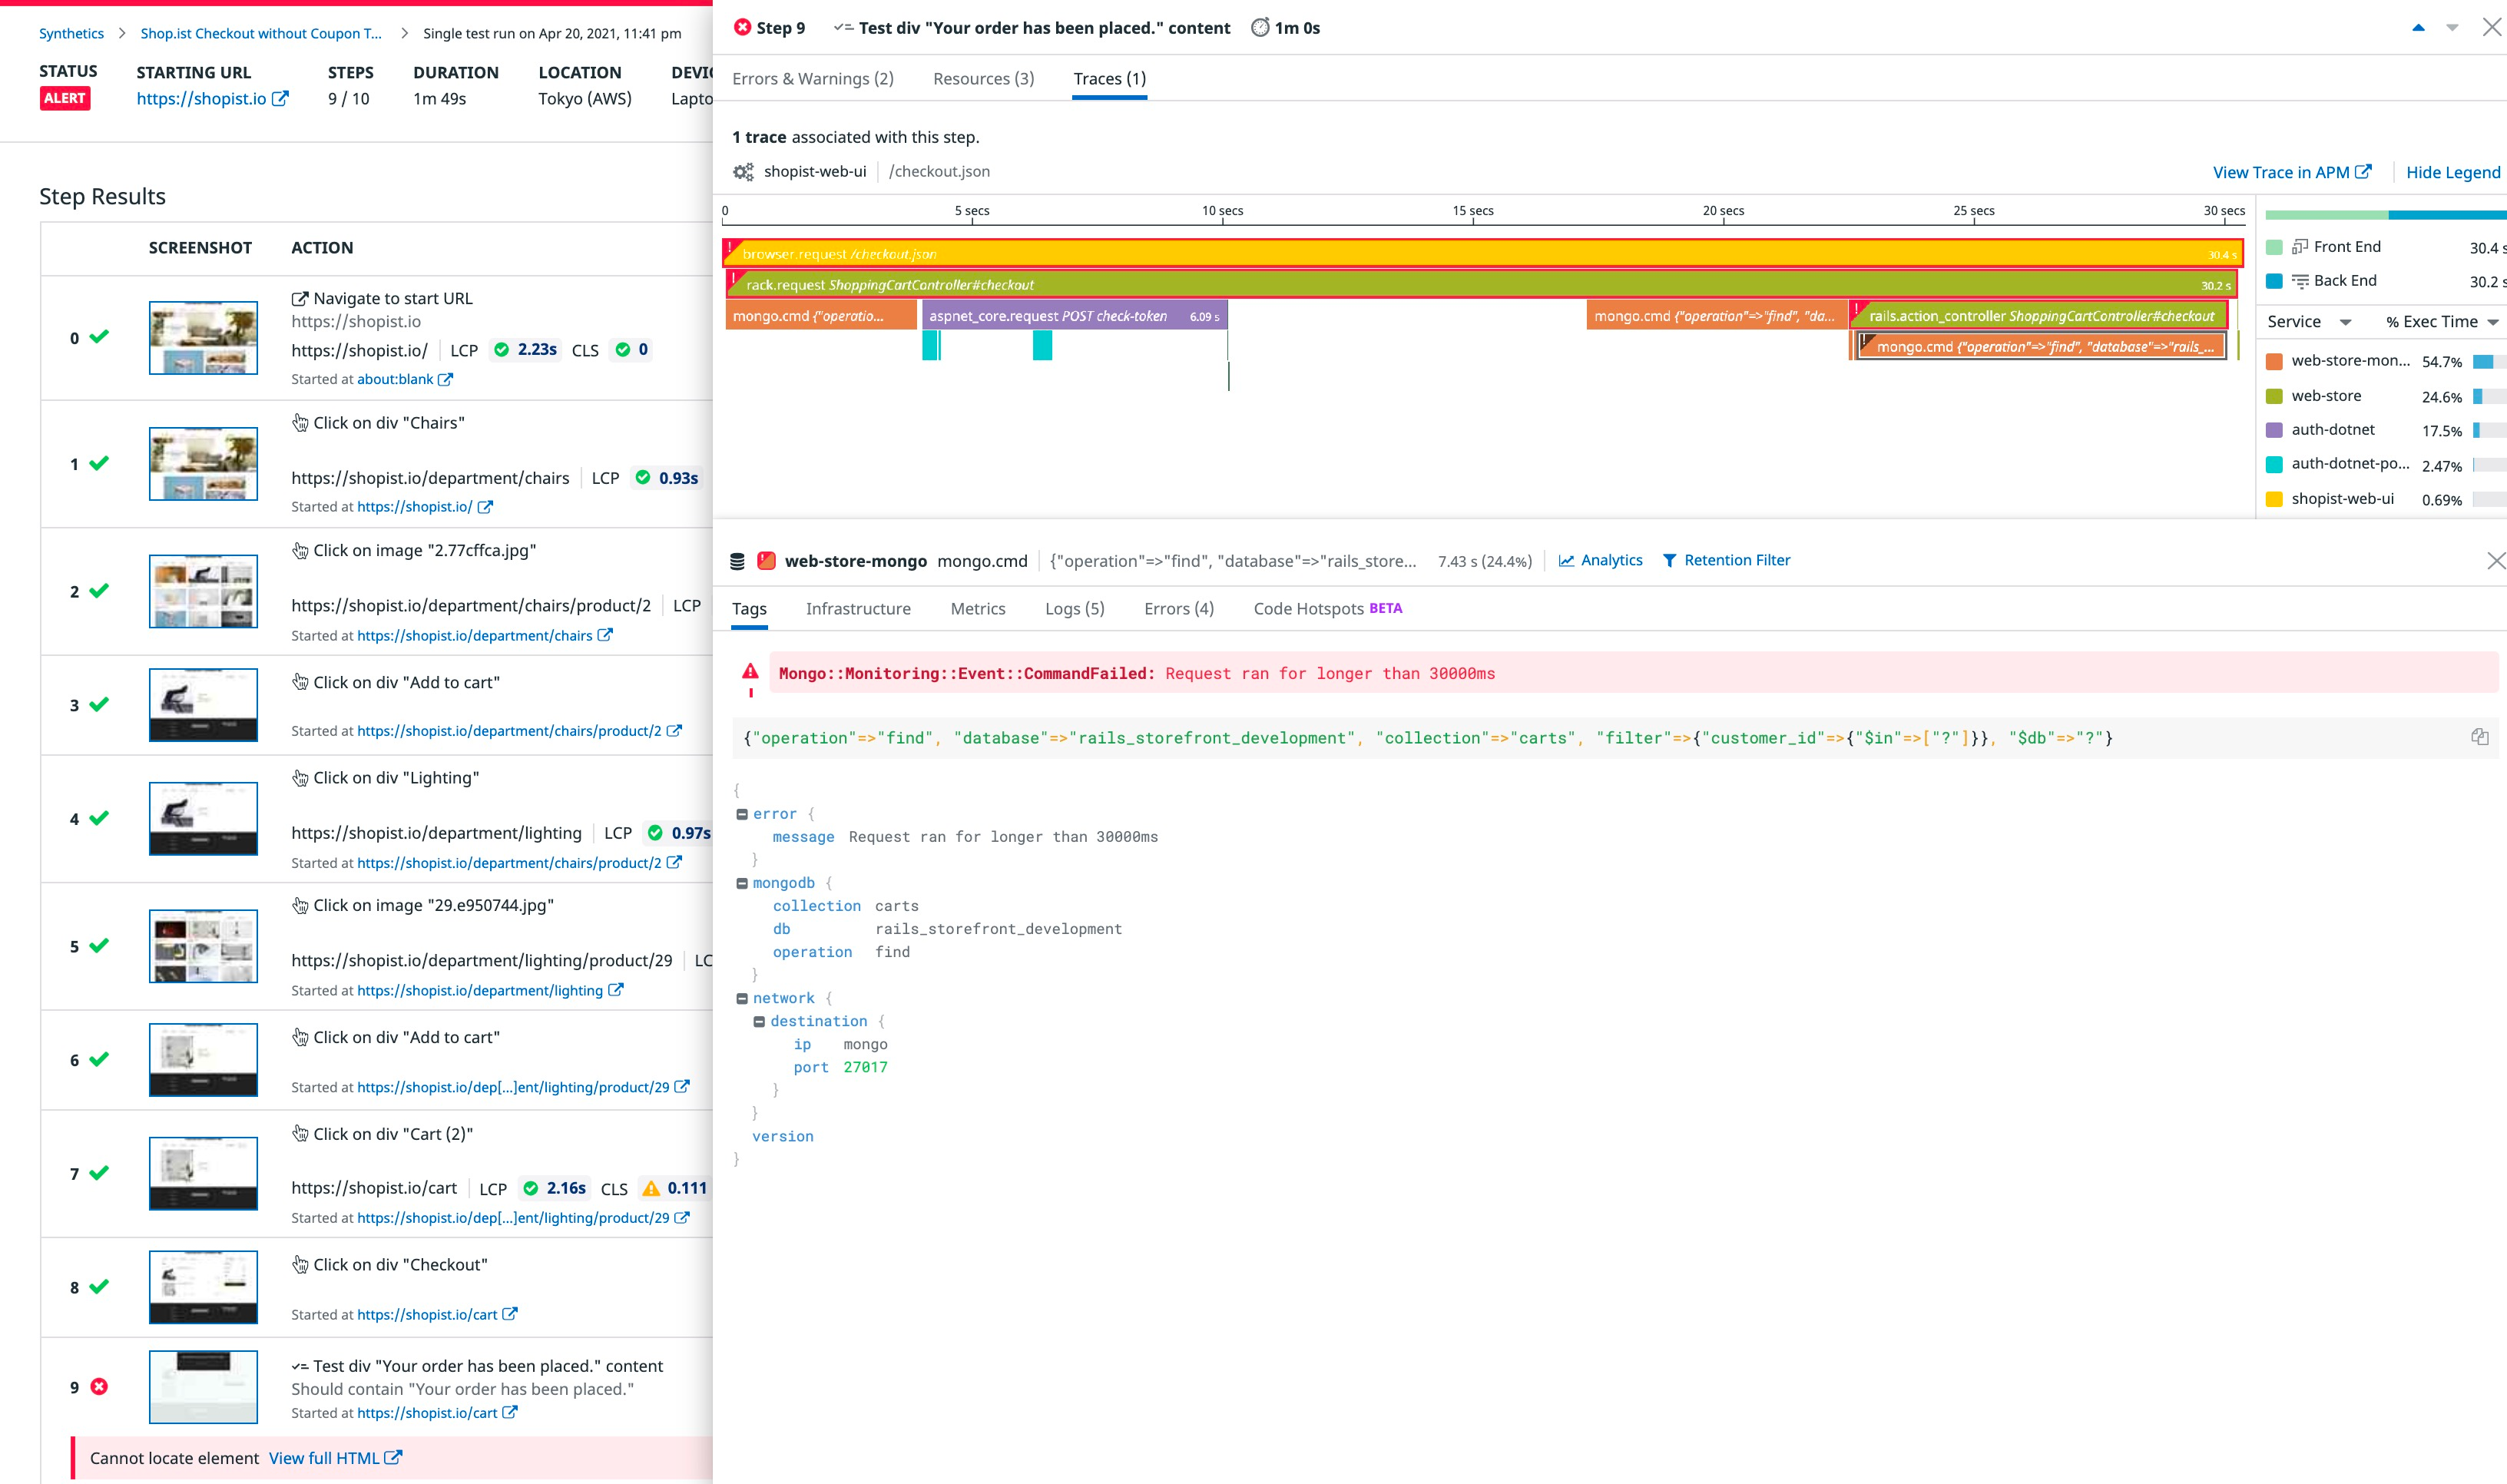
The APM integration with Synthetic Monitoring allows you to navigate from a failed test run to the root cause of the issue with the trace generated by the test.
Having network-related specifics from your test, in addition to backend, infrastructure, and log information from your trace, and RUM events (for browser tests only) allows you to access additional details about your application’s behavior and user experience.
How?
After enabling APM on your application’s endpoint, you can access APM traces in the Synthetic Monitoring & Continuous Testing page.
For more information, see Connect Synthetic Tests and Traces.
Further Reading
Additional helpful documentation, links, and articles:
