- Essentials
- Getting Started
- Datadog
- Datadog Site
- DevSecOps
- Serverless for AWS Lambda
- Agent
- Integrations
- Containers
- Dashboards
- Monitors
- Logs
- APM Tracing
- Profiler
- Tags
- API
- Service Catalog
- Session Replay
- Continuous Testing
- Synthetic Monitoring
- Incident Management
- Database Monitoring
- Cloud Security Management
- Cloud SIEM
- Application Security Management
- Workflow Automation
- CI Visibility
- Test Visibility
- Intelligent Test Runner
- Code Analysis
- Learning Center
- Support
- Glossary
- Standard Attributes
- Guides
- Agent
- Integrations
- OpenTelemetry
- Developers
- Authorization
- DogStatsD
- Custom Checks
- Integrations
- Create an Agent-based Integration
- Create an API Integration
- Create a Log Pipeline
- Integration Assets Reference
- Build a Marketplace Offering
- Create a Tile
- Create an Integration Dashboard
- Create a Recommended Monitor
- Create a Cloud SIEM Detection Rule
- OAuth for Integrations
- Install Agent Integration Developer Tool
- Service Checks
- IDE Plugins
- Community
- Guides
- API
- Datadog Mobile App
- CoScreen
- Cloudcraft
- In The App
- Dashboards
- Notebooks
- DDSQL Editor
- Sheets
- Monitors and Alerting
- Infrastructure
- Metrics
- Watchdog
- Bits AI
- Service Catalog
- API Catalog
- Error Tracking
- Service Management
- Infrastructure
- Application Performance
- APM
- Continuous Profiler
- Database Monitoring
- Data Streams Monitoring
- Data Jobs Monitoring
- Digital Experience
- Real User Monitoring
- Product Analytics
- Synthetic Testing and Monitoring
- Continuous Testing
- Software Delivery
- CI Visibility
- CD Visibility
- Test Visibility
- Intelligent Test Runner
- Code Analysis
- Quality Gates
- DORA Metrics
- Security
- Security Overview
- Cloud SIEM
- Cloud Security Management
- Application Security Management
- AI Observability
- Log Management
- Observability Pipelines
- Log Management
- Administration
Integrating Monitors With Statuspage
Overview
Atlassian Statuspage is a status and incident management tool that provides visibility into your applications’ and services’ uptime. A status page can display custom metrics and events from Datadog, and you can update the status of your systems with Datadog monitor notifications.
Add Statuspage alerts as Datadog events
You can configure the Statuspage integration to track Statuspage alerts in the Events Explorer.
- Navigate to Integrations and search for
statuspagefrom the list of integrations. - Select the StatusPage Integration tile and click Add New.
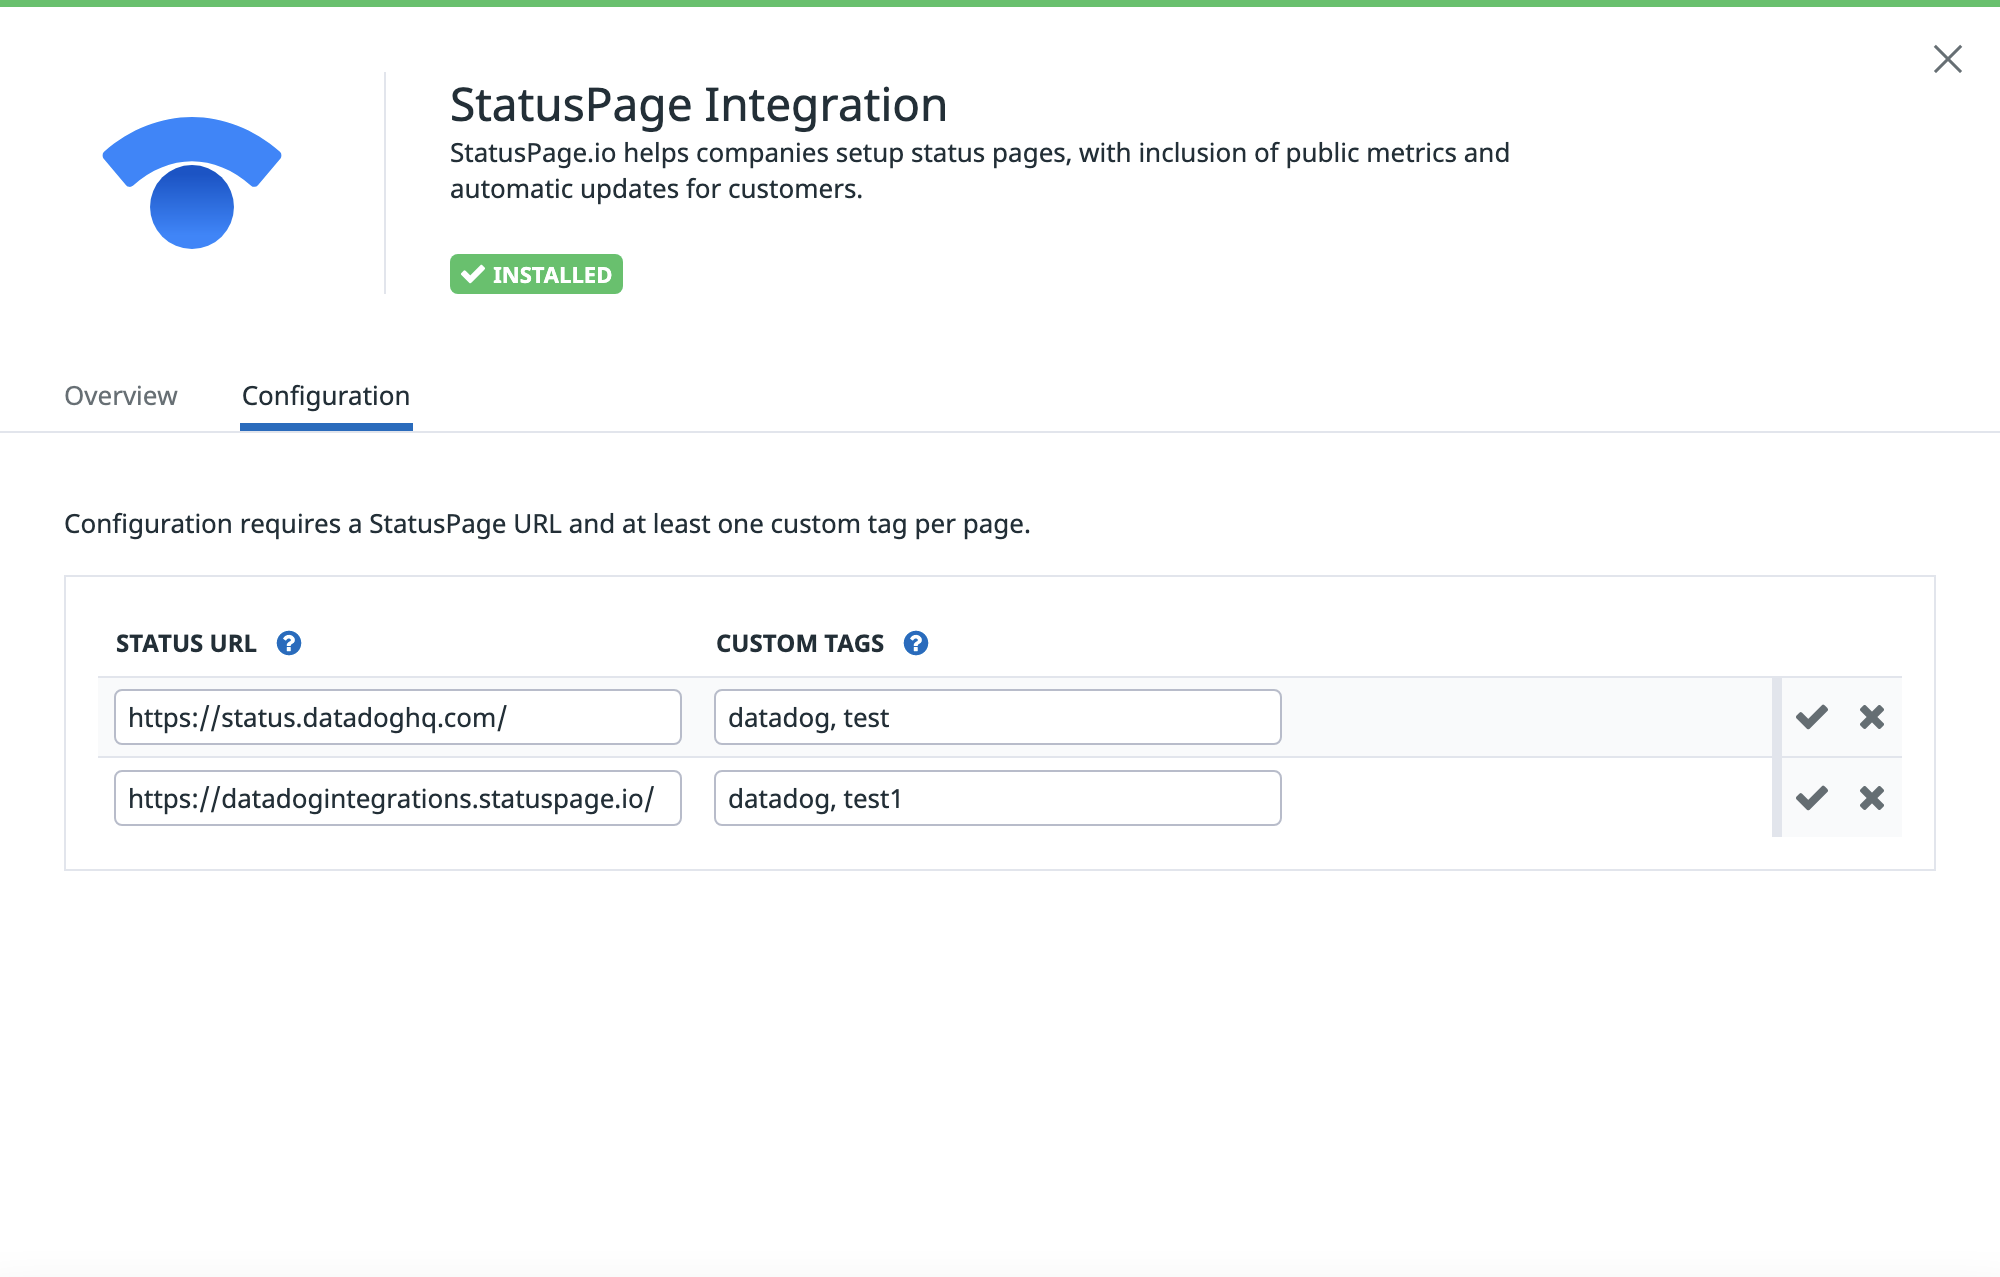
- Add the status URL and custom tags you want to monitor, for example:
https://status.datadoghq.comorhttps://datadogintegrations.statuspage.io/withdatadog,test, andtest1tags. You must include at least one custom tag per page. - Click the Save icon.
After five minutes, you should see monitor alerts from Statuspage appearing in the Events Explorer. Set a time frame on the top right corner and select Statuspage from the list of sources under Core.
Click on an alert to display a side panel containing the event’s message, tags, and attributes.
Add Statuspage alerts in Datadog monitors
Generate a Statuspage email address
See the Statuspage documentation to generate a component-specific email address.
Create a metric monitor
To create a metric monitor that triggers on Statuspage alerts:
- Navigate to Monitors > New Monitor and click Metric.
- See the Metric Monitor documentation to select a detection method, define your metric(s), set alerting conditions, and configure advanced monitor options.
- Customize the monitor name to return
UPorDOWNdepending on the test state. For example,{{#is_alert}}DOWN{{/is_alert}}{{#is_recovery}}UP{{/is_recovery}}. - In the Configure notifications and automations section, add the generated email address such as
@custom-statuspage-email@notifications.statuspage.ioin the message. This automatically populates theNotify your services and your team membersfield above Renotification. - Fill out the monitor notification section and add a summary in the monitor name such as
Shopist Checkout Functionality. - Set the monitor renotification conditions and add tags such as
service:status-page. - Select a team and assign a priority to the monitor.
- Define the monitor’s editing permissions and notification conditions.
- Once you have configured your monitor, click Create.
Further reading
Additional helpful documentation, links, and articles:


