- Essentials
- Getting Started
- Datadog
- Datadog Site
- DevSecOps
- Serverless for AWS Lambda
- Agent
- Integrations
- Containers
- Dashboards
- Monitors
- Logs
- APM Tracing
- Profiler
- Tags
- API
- Service Catalog
- Session Replay
- Continuous Testing
- Synthetic Monitoring
- Incident Management
- Database Monitoring
- Cloud Security Management
- Cloud SIEM
- Application Security Management
- Workflow Automation
- CI Visibility
- Test Visibility
- Intelligent Test Runner
- Code Analysis
- Learning Center
- Support
- Glossary
- Standard Attributes
- Guides
- Agent
- Integrations
- OpenTelemetry
- Developers
- Authorization
- DogStatsD
- Custom Checks
- Integrations
- Create an Agent-based Integration
- Create an API Integration
- Create a Log Pipeline
- Integration Assets Reference
- Build a Marketplace Offering
- Create a Tile
- Create an Integration Dashboard
- Create a Recommended Monitor
- Create a Cloud SIEM Detection Rule
- OAuth for Integrations
- Install Agent Integration Developer Tool
- Service Checks
- IDE Plugins
- Community
- Guides
- API
- Datadog Mobile App
- CoScreen
- Cloudcraft
- In The App
- Dashboards
- Notebooks
- DDSQL Editor
- Sheets
- Monitors and Alerting
- Infrastructure
- Metrics
- Watchdog
- Bits AI
- Service Catalog
- API Catalog
- Error Tracking
- Service Management
- Infrastructure
- Application Performance
- APM
- Continuous Profiler
- Database Monitoring
- Data Streams Monitoring
- Data Jobs Monitoring
- Digital Experience
- Real User Monitoring
- Product Analytics
- Synthetic Testing and Monitoring
- Continuous Testing
- Software Delivery
- CI Visibility
- CD Visibility
- Test Visibility
- Intelligent Test Runner
- Code Analysis
- Quality Gates
- DORA Metrics
- Security
- Security Overview
- Cloud SIEM
- Cloud Security Management
- Application Security Management
- AI Observability
- Log Management
- Observability Pipelines
- Log Management
- Administration
DNS Monitoring
Upgrade to Agent version 7.33 or later to enable DNS monitoring.
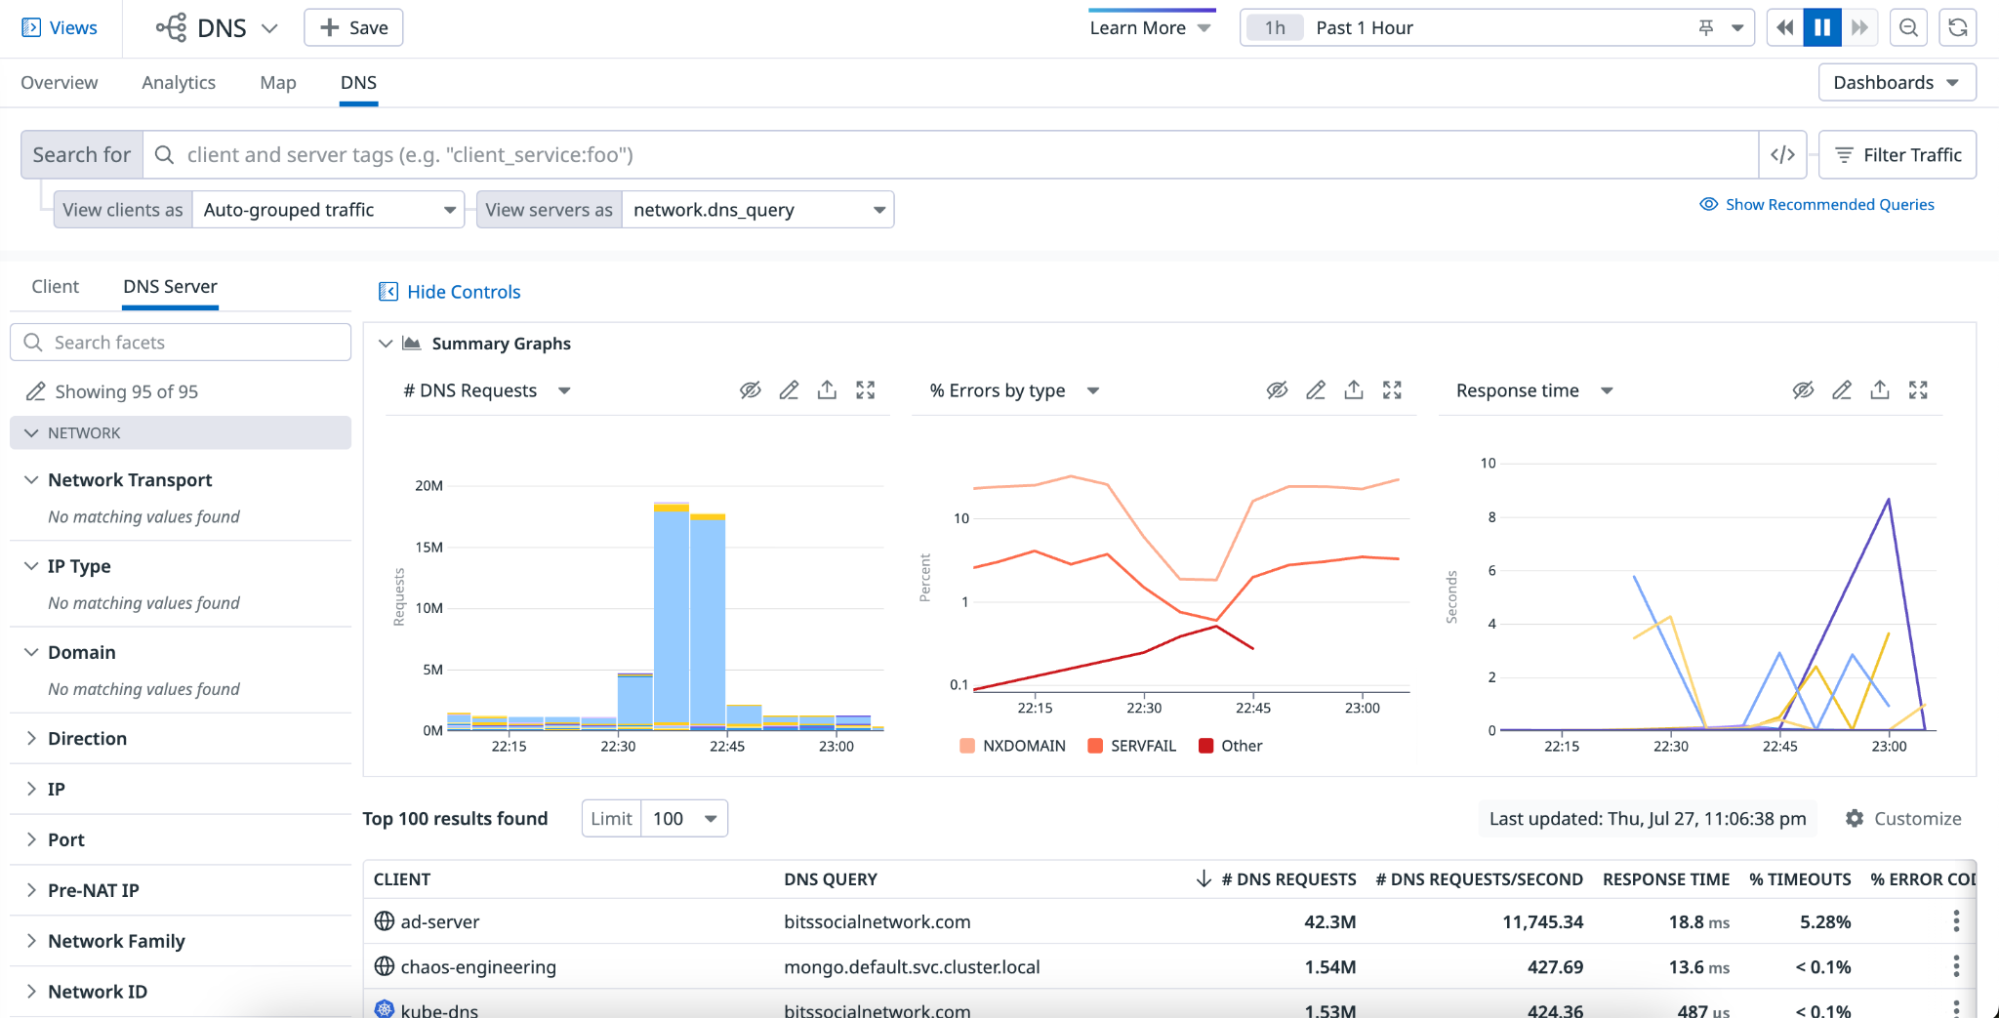
DNS Monitoring provides an overview of DNS server performance to help you identify server-side and client-side DNS issues. By collecting and displaying flow-level DNS metrics, this page can be used to identify:
- The pods or services making DNS requests and the servers receiving those requests.
- The endpoints making the most requests or making requests at the highest rate.
- If a DNS server’s response time to requests has gradually or suddenly increased.
- The DNS servers with a high error rate and the type of errors being emitted.
- Which domains are being resolved.
Setup
Before you can begin to use DNS Monitoring, set up Network Performance Monitoring. Also ensure you are using the latest version of the Agent, or at least Agent v7.23+ for Linux OS, and v7.28+ for Windows Server. Once installed, a DNS tab is accessible in the Network Performance Monitoring product.
Are you looking for Network Device Monitoring instead? See the NDM setup instructions.
Queries
Use the search bar at the top of the page to query for dependencies between a client (which makes the DNS request) and a DNS server (which responds to the DNS request). The destination port is automatically scoped to DNS port 53 so that all resulting dependencies match this (client → DNS server) format.
To refine your search to a particular client, aggregate and filter DNS traffic using client tags in the search bar. In the default view, the client is automatically grouped by the most common tags. Accordingly, each row in the table represents a service that is making DNS requests to some DNS server.
To refine your search to a particular DNS server, filter the search bar by using server tags. Configure your server display with one of the following options from the Group by dropdown menu:
dns_server: The server receiving DNS requests. This tag has the same value aspod_nameortask_name. If those tags are not available,host_nameis used.host: The host name of the DNS server.service: The service running on the DNS server.IP: The IP of the DNS server.dns_query: (Requires Agent version 7.33 or later) The domain that was queried.
This example shows all flows from pods in the production environment’s availability zone to hosts receiving DNS requests:
Recommended queries
There are three recommended queries at the top of the DNS page, similar to the Network Analytics page. These are static queries commonly used to investigate DNS health and view high-level DNS metrics. Use the recommended queries as a starting point to gain further insights into your DNS configuration and troubleshoot DNS issues.
You can hover over a recommended query to see a short description of what the results of the query mean. Click on the query to run the query, and click Clear query to remove the query. Each recommended query has its own set of recommended graphs as well; clearing the recommended query resets the graphs to their default settings.
Metrics
Your DNS metrics are displayed through the graphs and the associated table.
Note: Data is collected every 30 seconds, aggregated in five minute buckets, and retained for 14 days.
The following DNS metrics are available:
| Metric | Description |
|---|---|
| DNS requests | The number of DNS requests made from the client. |
| DNS requests / second | The rate of DNS requests made by the client. |
| DNS response time | The average response time of the DNS server to a request from the client. |
| Timeouts | The number of timed out DNS requests from the client (displayed as a percentage of all DNS responses). Note: These timeouts are a metric computed by NPM internally, and may not align with DNS timeouts reported from outside of NPM. They are not the same as the DNS timeouts reported by DNS clients or servers. |
| Errors | The number of requests from the client that generated DNS error codes (displayed as a percentage of all DNS responses). |
| SERVFAIL | The number of requests from the client that generated SERVFAIL (DNS server failed to respond) codes (displayed as a percentage of all DNS responses). |
| NXDOMAIN | The number of requests from the client that generated NXDOMAIN (domain name does not exist) codes (displayed as a percentage of all DNS responses). |
| OTHER | The number of requests from the client that generated error codes that are not NXDOMAIN or SERVFAIL (displayed as a percentage of all DNS responses). |
| Failures | The total number of timeouts and errors in DNS requests from the client (displayed as a percentage of all DNS responses). |
Table
The network table breaks down the above metrics by each client and server dependency defined by your query.
Configure the columns in your table using the Customize button at the top right of the table.
Narrow down the traffic in your view with the Filter Traffic options.
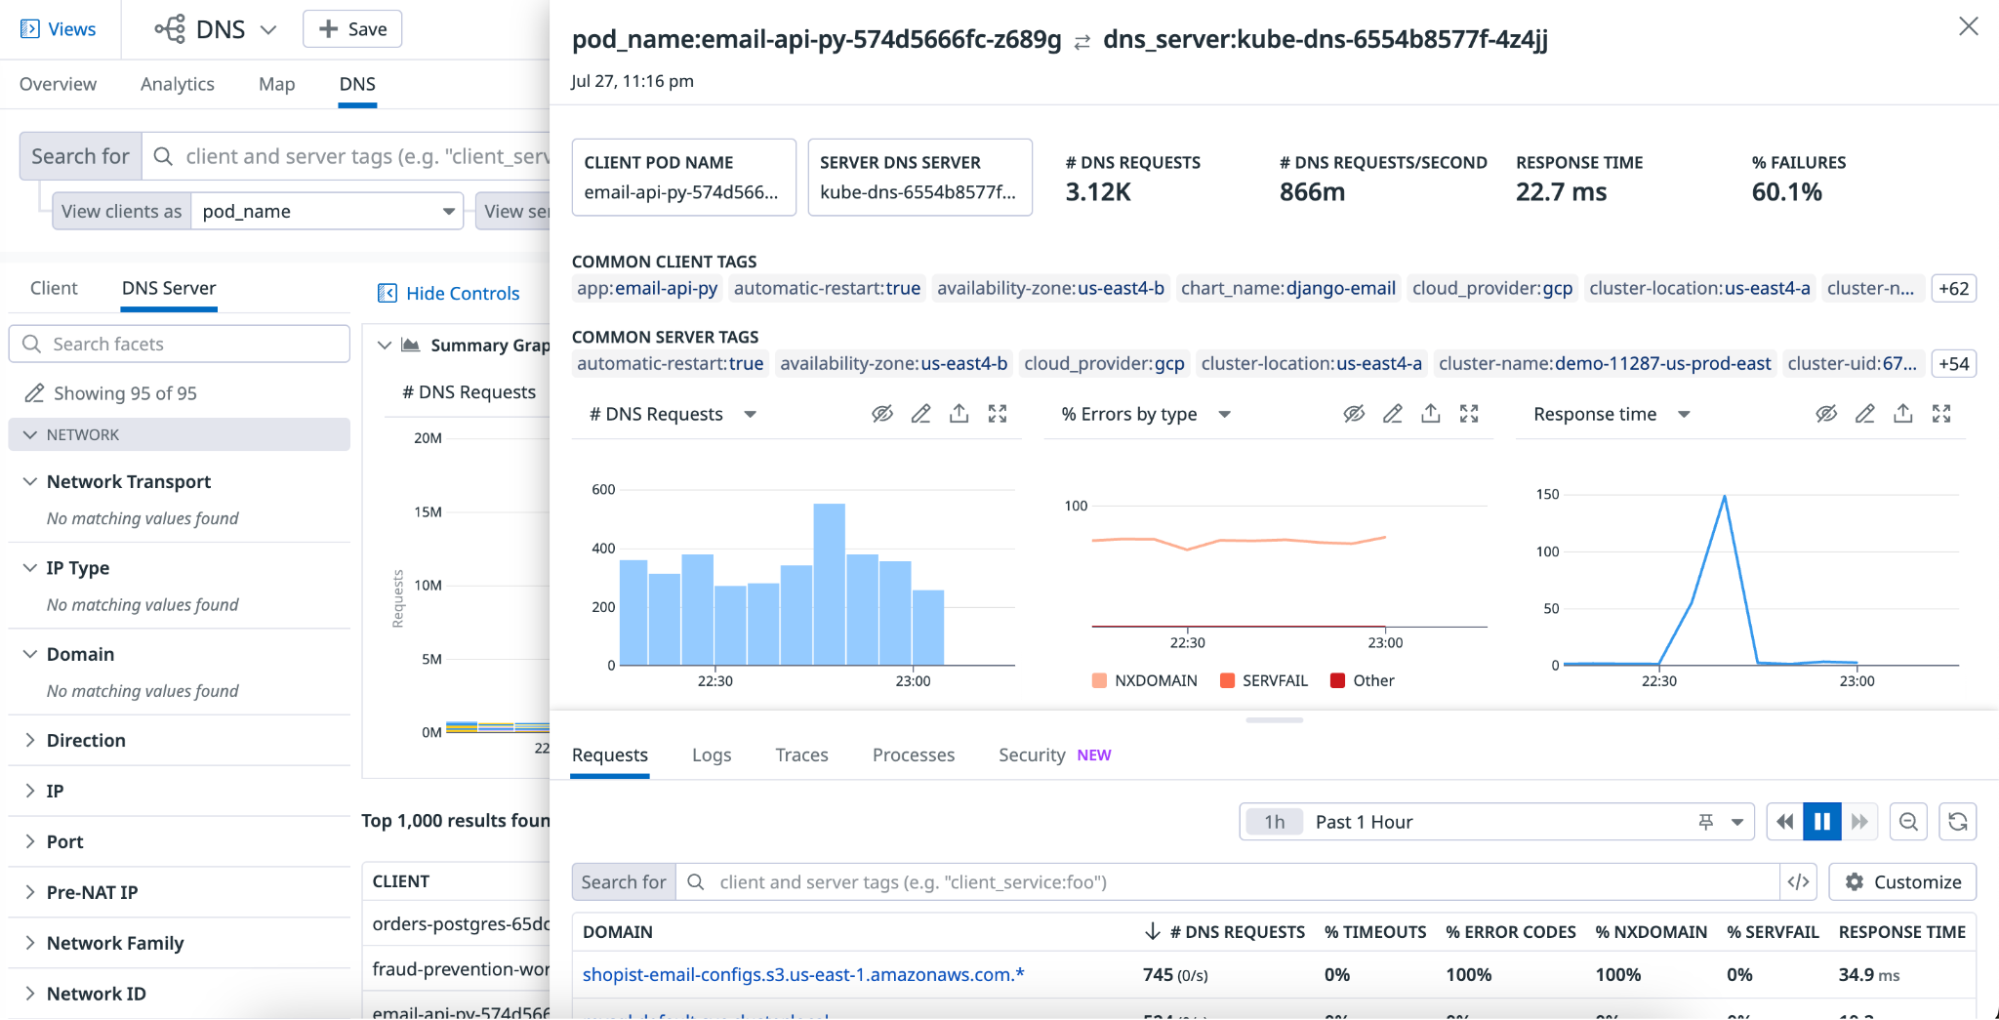
Sidepanel
The sidepanel provides contextual telemetry to help you quickly debug DNS server dependencies. Use the Flows, Logs, Traces, and Processes tabs to determine whether a DNS server’s high number of incoming requests, response time, or failure rate is due to:
- Heavy processes consuming the resources of the underlying infrastructure
- Application errors in the code on the client side
- A high number of requests originating from a particular port or IP
Further Reading
Additional helpful documentation, links, and articles:


