- Essentials
- Getting Started
- Datadog
- Datadog Site
- DevSecOps
- Serverless for AWS Lambda
- Agent
- Integrations
- Containers
- Dashboards
- Monitors
- Logs
- APM Tracing
- Profiler
- Tags
- API
- Service Catalog
- Session Replay
- Continuous Testing
- Synthetic Monitoring
- Incident Management
- Database Monitoring
- Cloud Security Management
- Cloud SIEM
- Application Security Management
- Workflow Automation
- CI Visibility
- Test Visibility
- Intelligent Test Runner
- Code Analysis
- Learning Center
- Support
- Glossary
- Standard Attributes
- Guides
- Agent
- Integrations
- OpenTelemetry
- Developers
- Authorization
- DogStatsD
- Custom Checks
- Integrations
- Create an Agent-based Integration
- Create an API Integration
- Create a Log Pipeline
- Integration Assets Reference
- Build a Marketplace Offering
- Create a Tile
- Create an Integration Dashboard
- Create a Recommended Monitor
- Create a Cloud SIEM Detection Rule
- OAuth for Integrations
- Install Agent Integration Developer Tool
- Service Checks
- IDE Plugins
- Community
- Guides
- API
- Datadog Mobile App
- CoScreen
- Cloudcraft
- In The App
- Dashboards
- Notebooks
- DDSQL Editor
- Sheets
- Monitors and Alerting
- Infrastructure
- Metrics
- Watchdog
- Bits AI
- Service Catalog
- API Catalog
- Error Tracking
- Service Management
- Infrastructure
- Application Performance
- APM
- Continuous Profiler
- Database Monitoring
- Data Streams Monitoring
- Data Jobs Monitoring
- Digital Experience
- Real User Monitoring
- Product Analytics
- Synthetic Testing and Monitoring
- Continuous Testing
- Software Delivery
- CI Visibility
- CD Visibility
- Test Visibility
- Intelligent Test Runner
- Code Analysis
- Quality Gates
- DORA Metrics
- Security
- Security Overview
- Cloud SIEM
- Cloud Security Management
- Application Security Management
- AI Observability
- Log Management
- Observability Pipelines
- Log Management
- Administration
(LEGACY) Capacity Planning and Scaling
Observability Pipelines is not available on the US1-FED Datadog site.
This guide is for large-scale production-level deployments.
Units for estimations
The following units are starting points for estimating your resource capacity, but can vary depending on your workload.
| Unit | Size | Observability Pipelines Worker Throughput* |
|---|---|---|
| Unstructured log event | ~512 bytes | ~10 MiB/s/vCPU |
| Structured log event | ~1.5 KB | ~25 MiB/s/vCPU |
| Metric event | ~256 bytes | ~25 MiB/s/vCPU |
| Trace span event | ~1.5 KB | ~25 MiB/s/vCPU |
*These numbers are conservative for estimation purposes. 1 vCPU = 1 ARM physical CPU and 0.5 Intel physical CPU.
Scaling
Horizontal scaling
Horizontal scaling refers to distributing traffic across multiple Observability Pipelines Worker instances. Observability Pipelines Worker has a shared-nothing architecture and does not require leader nodes or any such coordination that could complicate scaling.
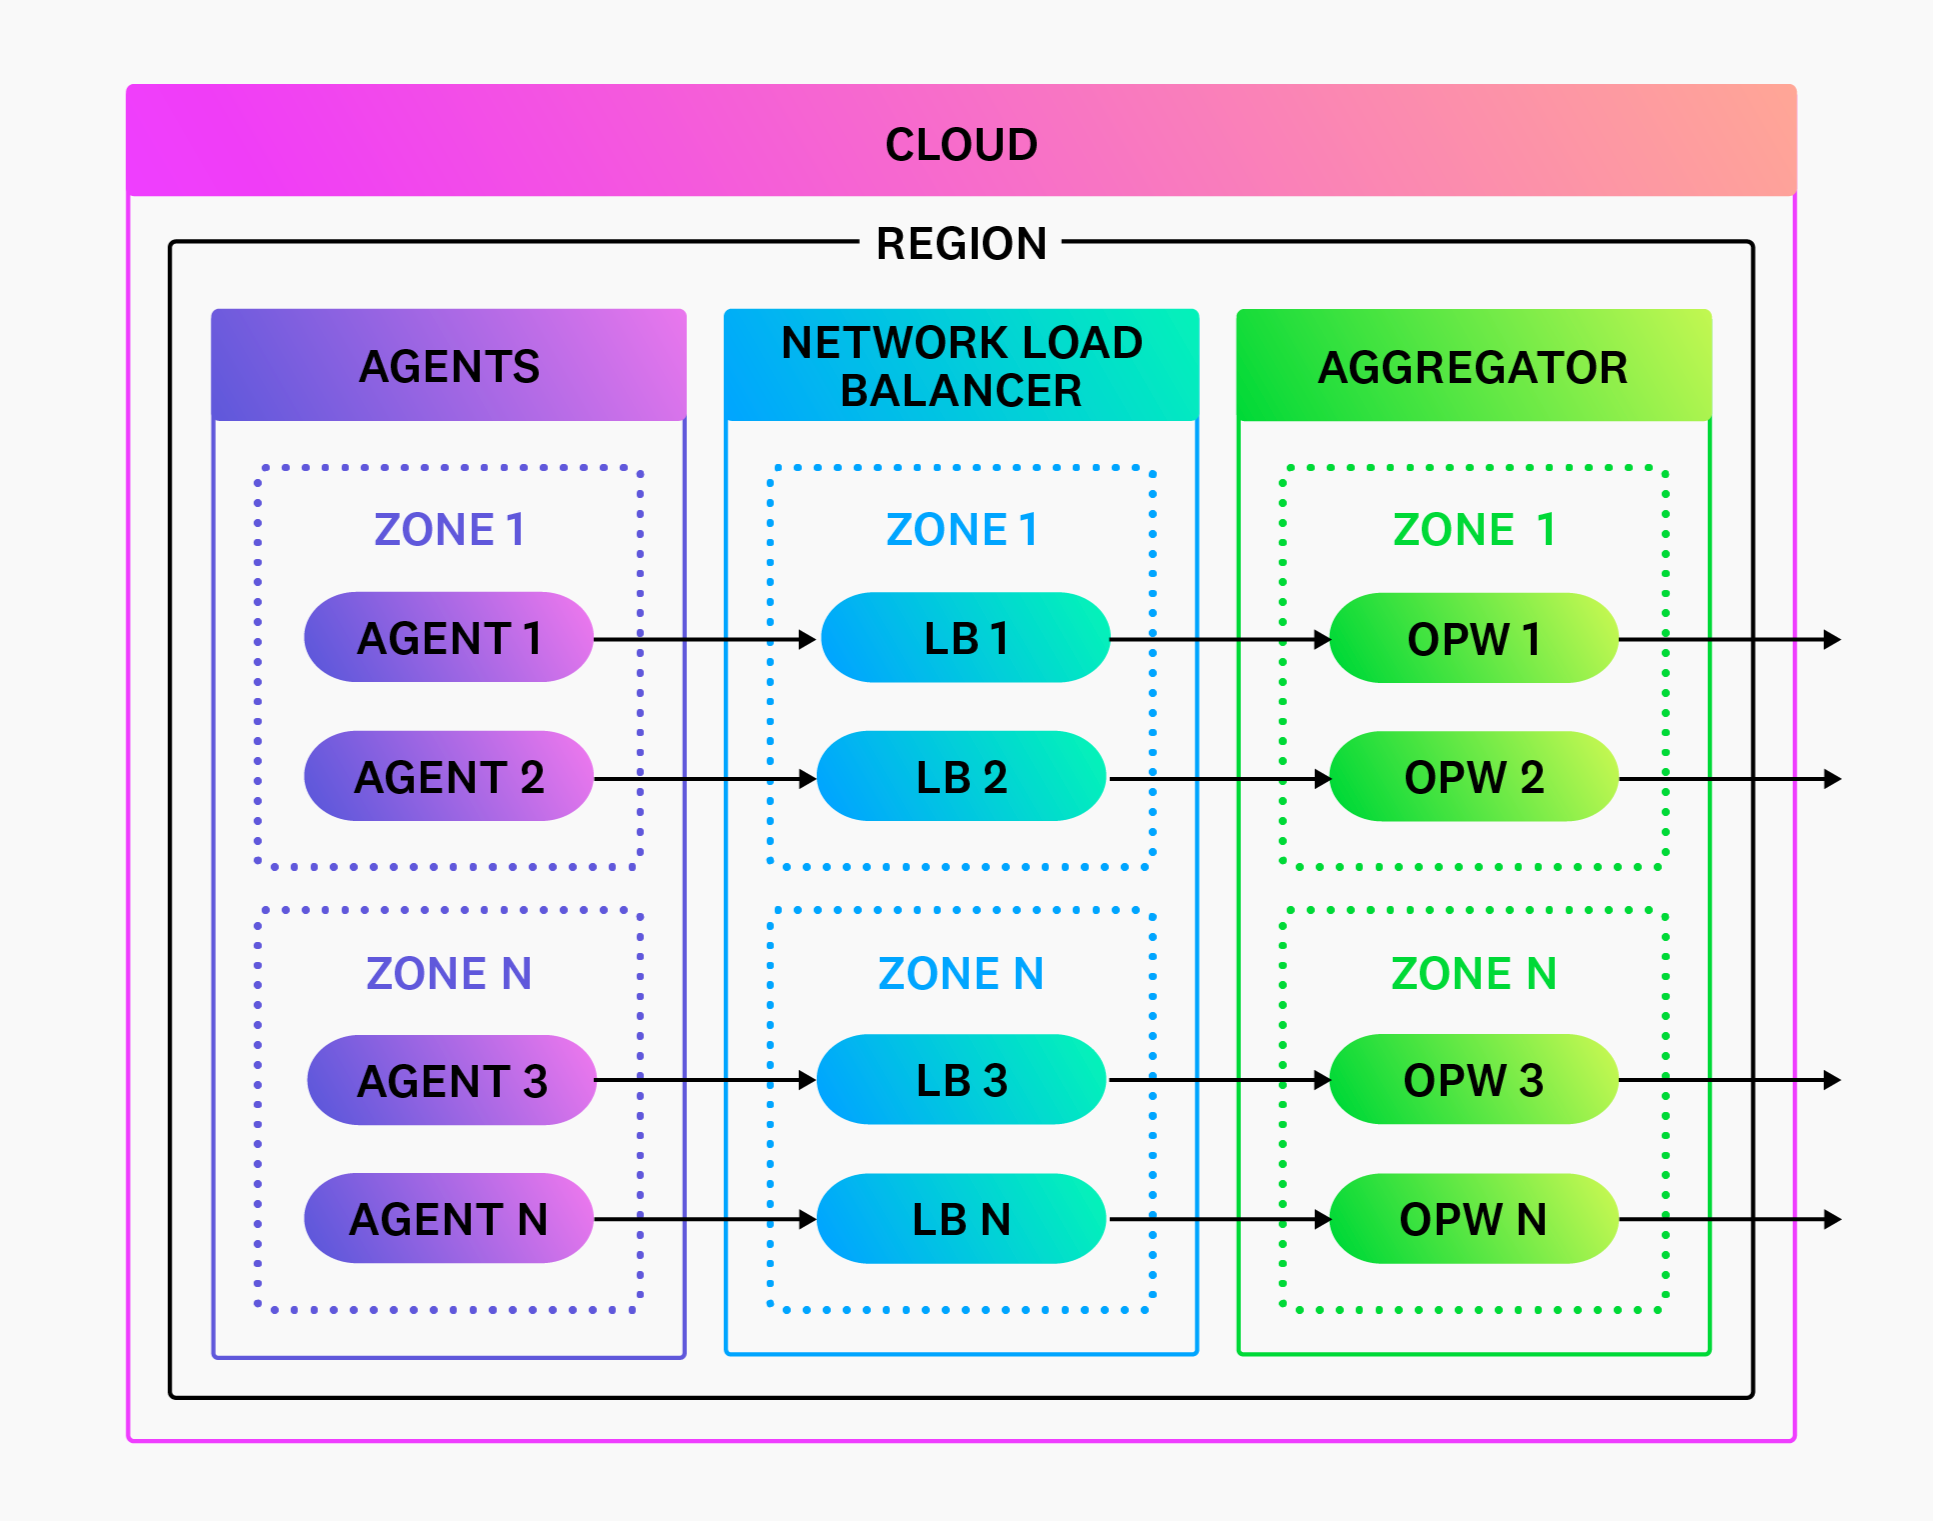
For push-based sources, front your Observability Pipelines Worker instances with a network load balancer and scale them up and down as needed.
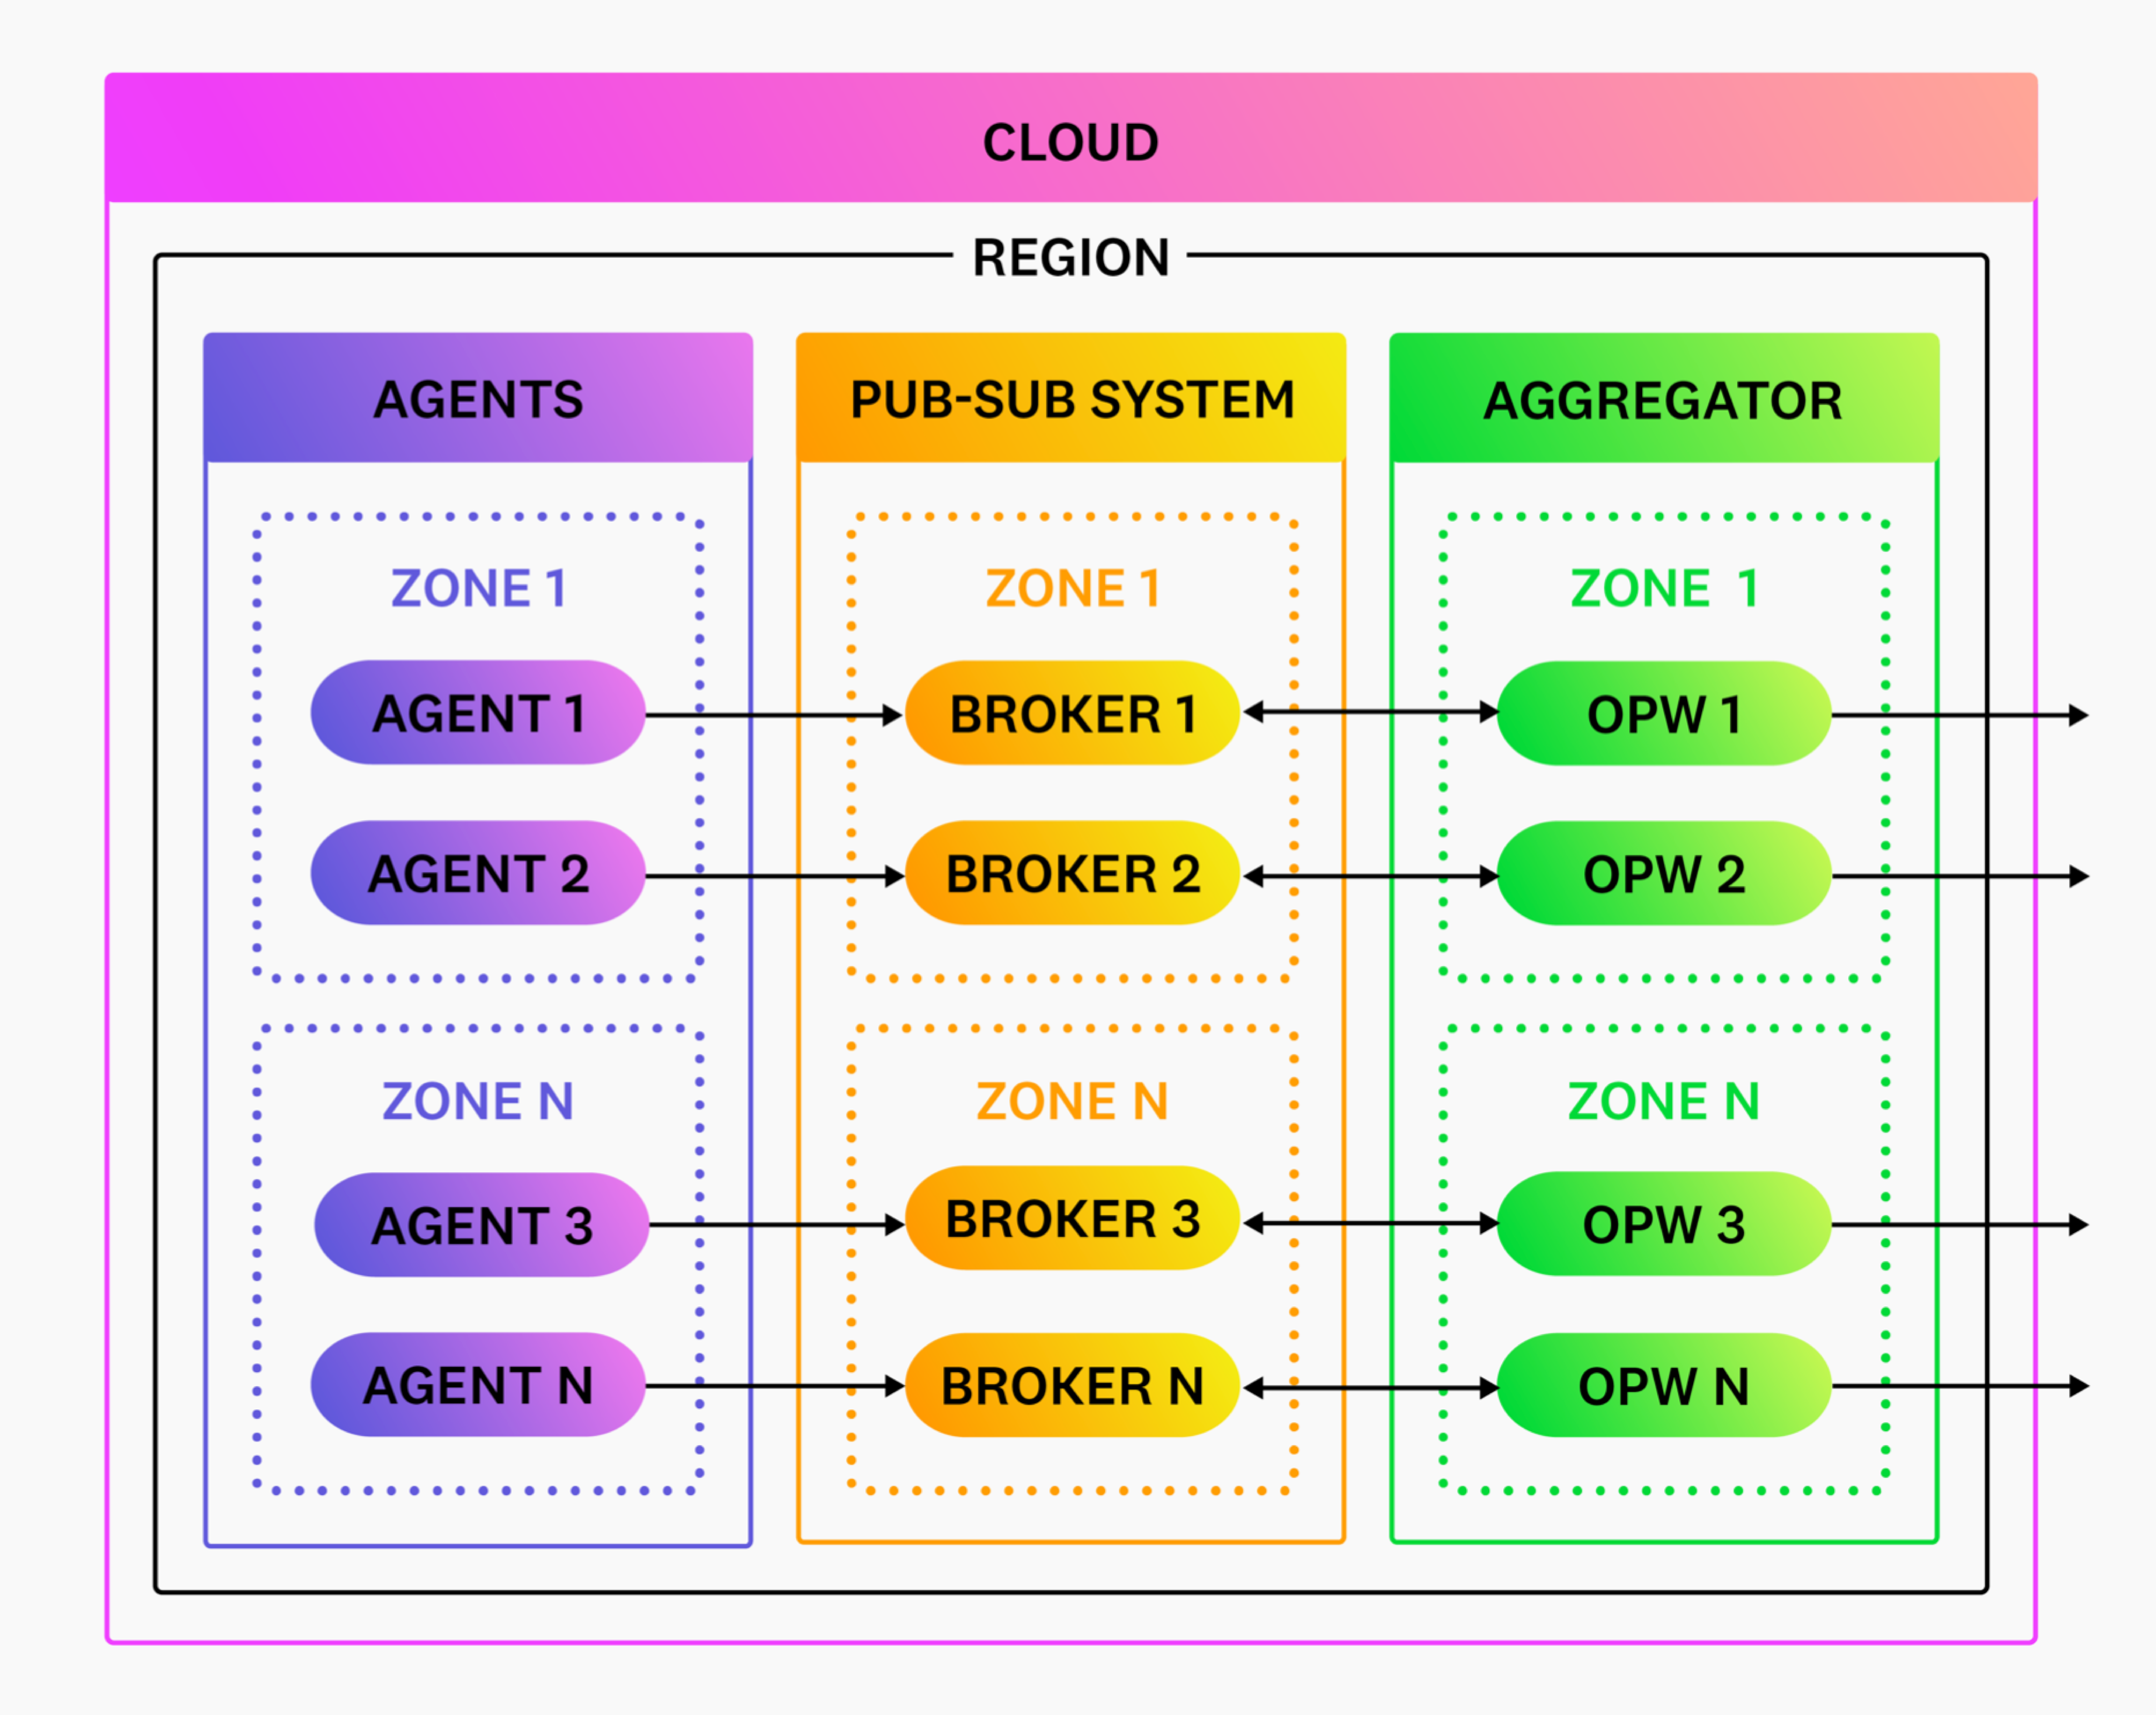
A load balancer is not required for pull-based sources. Deploy Observability Pipelines Worker and scale it up and down as needed. Your publish-subscription system coordinates exclusive access to the data when Observability Pipelines Worker asks to read it.
See Advanced configurations for more information on mixed workloads (push and pull-based sources).
Load balancing
A load balancer is only required for push-based sources, such as agents. You do not need a load balancer if you are exclusively using pull-based sources, such as Kafka.
Client-side load balancing
Client-side load balancing is not recommended. Client-side load balancing refers to clients doing the load balancing of traffic across multiple Observability Pipelines Worker instances. While this approach sounds simpler, it may be less reliable and more complicated because:
- Load balancing with proper failover is complex. Issues in this area are sensitive as they can result in data loss or incidents that disrupt your services. This is exacerbated if you are working with multiple types of clients.
- The point of the Observability Pipelines Worker aggregator is to shift responsibility away from your agents and taking on load balancing helps to do that.
Load balancer types
Datadog recommends Layer 4 (L4) load balancers (network load balancers) since they support Observability Pipelines Worker’s protocols (TCP, UDP, and HTTP). Even if you’re exclusively sending HTTP traffic (Layer 7), Datadog recommends L4 load balancers for their performance and simplicity.
| Cloud Provider | Recommendation |
|---|---|
| AWS | AWS Network Load Balancer (NLB) |
| Azure | Internal Azure Load Balancer |
| Google Cloud | Internal TCP/UDP Network Load Balancer |
| Private | HAProxy, Nginx, or another load balancer with layer-4 support |
Load balancer configurations
When configuring clients and load balancers, Datadog recommends the following general settings:
- Use a simple round-robin load balancing strategy.
- Do not enable cross-zone load balancing unless the traffic across zones is very imbalanced.
- Configure load balancers to use Observability Pipelines Worker’s health API endpoint for target health.
- Ensure that your Observability Pipelines Worker instances automatically register or de-register as they scale. See Networking for more information.
- Enable keep-alive with no more than one minute idle timeout for both your clients and load balancers.
- If supported, enable connection concurrency and pooling on your agents. If that is not supported, consider the unified architecture which deploys Observability Pipelines Worker at the edge. Connection pooling ensures large volumes of data are spread across multiple connections to help balance traffic.
Load balancer hot spots
Load balancing hot spots occur when one or more Observability Pipelines Worker instance receives disproportionate traffic. Hot spots usually happen due to one of two reasons:
- A substantial amount of traffic is being sent over a single connection.
- Traffic in one availability zone is much higher than in the others.
In these cases, the following respective mitigation tactics are recommended:
- Split large connections into multiple connections. Most clients allow connection concurrency and pooling that distributes data over multiple connections. This tactic allows your load balancer to distribute the connection across multiple Observability Pipelines Worker instances. If your client does not support this, consider the unified architecture, where Observability Pipelines Worker can be additionally deployed to the edge.
- Enable cross-zone load balancing on your load balancer. Cross-zone balancing balances all availability zone traffic across all Observability Pipelines Worker instances.
Vertical scaling
Observability Pipelines Worker’s concurrency model automatically scales to take advantage of all vCPUs. There are no concurrency settings or configuration changes required. When vertically scaling, Datadog recommends capping an instance’s size to process no more than 50% of your total volume and deploying at least two Observability Pipelines Worker instances for high availability.
Autoscaling
Autoscaling should be based on average CPU utilization. For the vast majority of workloads, Observability Pipelines Worker is CPU constrained. CPU utilization is the strongest signal for autoscaling since it does not produce false positives. Datadog recommends you use the following settings, adjusting as necessary:
- Average CPU with a 85% utilization target.
- A five minute stabilization period for scaling up and down.


